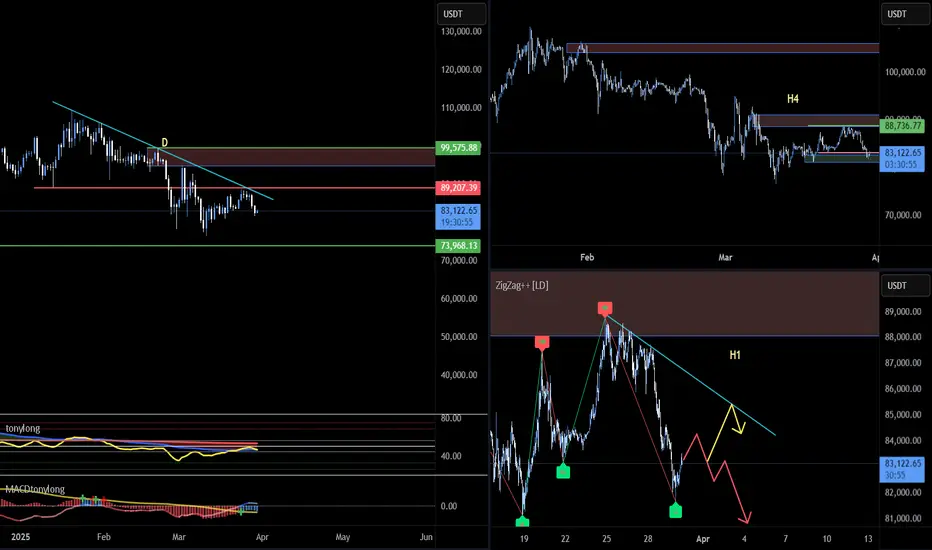
BTC23: BTC falls again. Testing support or finding a new bottom?📊 BINANCE:BTCUSD continued to decrease again in the past 2 days. Let's evaluate and look for opportunities through the multi-timeframe perspective below BINANCE:BTCUSDT :
🔹 **D Frame**: Before the price decrease in the past 2 days, we can see that although BTC had a recovery phase before, the fake decrease structure has not been broken yet.
🔹 **H4 Frame**: The keylever zone has been broken as marked on the chart, however, this is the first decrease after the increase wave in the past days, so it will need clearer confirmation.
🔹 **H1 Frame**: Currently, the price is reacting to the support zone of 81~83k. However, the price is still in a downward wave if looking at the price structure.
🚀 **Trading plan:*
📌 At the present time, we can look for a SELL position in line with the main trend in diagonal resistance areas to look for a trading position in line with the main trend. The current price is at an important support area, so it is no longer suitable to SELL at this time. BUYing in this area is not recommended when the downtrend has not shown any signs of ending. We will have to wait for a clearer signal from the price structure to properly assess the effect of the current support area.
💪 **Wishing you success in making a profit!**
BTCUSDT
BTCUSD Buy setup Bitcoin (BTC) - A Brief Description
Bitcoin (BTC) is the world's first and most widely recognized cryptocurrency. It was created in 2009 by an anonymous person or group known as Satoshi Nakamoto. Bitcoin operates on a decentralized, peer-to-peer network using blockchain technology, which ensures transparency, security, and immutability of transactions.
Unlike traditional currencies issued by governments (fiat money), Bitcoin is not controlled by any central authority such as banks or governments. Instead, it is maintained by a distributed network of computers (nodes) through a process called mining, where transactions are verified and recorded on the blockchain.
Key Features of Bitcoin:
1. Decentralization – No single entity controls Bitcoin.
2. Limited Supply – Only 21 million BTC will ever exist, making it scarce.
3. Security – Uses cryptographic techniques to ensure safe transactions.
4. Transparency – Transactions are recorded on a public ledger (blockchain).
5. Fast and Borderless Transactions – Can be sent anywhere in the world without intermediaries.
6. Store of Value – Often referred to as "digital gold" due to its potential as a hedge against inflation.
Bitcoin is widely used for investment, trading, and online payments, and it has influenced the creation of thousands of other cryptocurrencies.

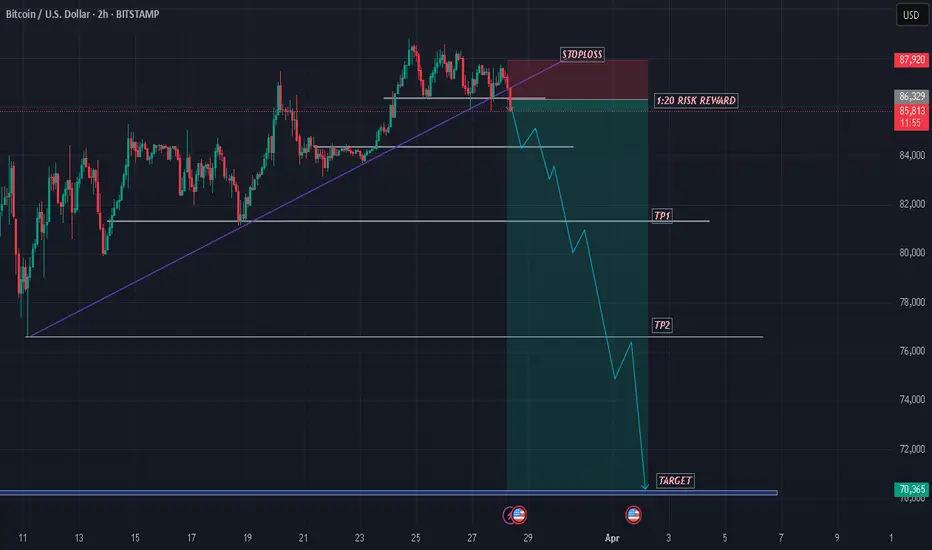
BTCUSD SHOWING A GOOD DOWN MOVE WITH 1:20 RISK REWARD BTCUSD SHOWING A GOOD DOWN MOVE WITH 1:20 RISK REWARD
DUE TO THESE REASON
A. its following a rectangle pattern that stocked the market
which preventing the market to move any one direction now it trying to break the strong resistant lable
B. after the break of this rectangle it will boost the market potential for break
C. also its resisting from a strong neckline the neckline also got weeker ald the price is ready to break in the outer region
all of these reason are indicating the same thing its ready for breakout BREAKOUT trading are follws good risk reward
please dont use more than one percentage of your capitalfollow risk reward and tradeing rules
that will help you to to become a bettertrader
thank you
BTC#22: BTC recovers slightly. Is the bear wave over?
In the past few days, BINANCE:BTCUSD has been continuously SW in the 81~85k area. Is this a sign that BTC will rise again? Let's analyze in detail and plan a trade BINANCE:BTCUSDT :
1️⃣ **Fundamental analysis:**
📊 The IMF has included Bitcoin and other digital assets in the framework of the global economic report for the first time. This shows that BTC is being recognized as a real asset.
🚀 The probability that the US government will buy Bitcoin in 2025 is 30% with information that the Trump administration may use profits from Gold to increase Bitcoin reserves
2️⃣ **Technical analysis:**
🔹 **Frame D**: the bear wave has not shown any signs of ending. The price has been anchored in the 80~85k area for a long time, but there has been no significant fluctuation and the sign of recovery is still unclear.
🔹 **H4+H1 frame**: The current short-term price structure is temporarily increasing with the appearance of higher peaks and higher bottoms. However, the price has not surpassed the important key zone to change the main trend.
3️⃣ **Trading plan:*
📌 At the present time, the current price has no clear signs when BTC is still fluctuating continuously in the SW area. Currently, the price is in a recovery phase with the nearest target being the resistance area of 88~91k. The current area is also not good for seeking profit from BUY positions. We can wait for the price reaction to the resistance area to consider establishing a SELL position. Prioritize trading in accordance with the main trend.
💪 **Wish you success in making profits!**

Bitcoin (BTC/USD) Supply & Demand Zone Analysis – Potential BearThis chart represents a Bitcoin (BTC/USD) price analysis on a 30-minute timeframe. Here’s a breakdown of the key elements:
Supply Zone (Resistance) at ~$85,599
The price has approached this supply zone, which could act as a resistance level.
The expectation is that the price may struggle to break above this level and could reverse downward.
Demand Zone (Support) at ~$81,500 - $81,755
This is labeled as the "diamond zone," which could act as a strong support area where buying interest may emerge.
The price is anticipated to decline towards this level.
Projected Price Movement
The blue arrows suggest a bearish scenario.
The price might initially react to the supply zone, then break below the trendline, confirming a downtrend.
The target for this downward move is the demand zone around $81,500.
Trendline Break
A rising trendline is drawn, which currently acts as support.
If the price breaks below it, it would confirm a bearish momentum shift.
Conclusion
This chart suggests a short-selling opportunity near the supply zone, targeting the demand zone. However, traders should watch for confirmations such as a rejection from resistance and a break below the trendline before entering a trade.

Lion Indicator bitcoin 1100 points running target5 reachThis lion indicator work well on 3min and 5min and 15 mins timeframes.
Disclaimer - this indicator only for education purpose and paper trade only

BTCUSD SHOWING A GOOD UP MOVE WITH 1:10 RISK REWARD BTCUSD SHOWING A GOOD
UP MOVE WITH 1:10 RISK REWARD
DUE TO THESE REASON
A. its following a rectangle pattern that stocked the market
which preventing the market to move any one direction now it trying to break the strong resistant lable
B. after the break of this rectangle it will boost the market potential for break
C. also its resisting from a strong neckline the neckline also got weeker ald the price is ready to break in the outer region
all of these reason are indicating the same thing its ready for breakout BREAKOUT trading are follws good risk reward
please dont use more than one percentage of your capitalfollow risk reward and tradeing rules
that will help you to to become a bettertrader
thank you

BTCUSDT EA MAN UPDATE > READ THE CHAOTAIN **BTCUSDT EA MAN Update – Analysis in English**
---
### **BTC/USDT Analysis (15 min) – Bullish Trend in Sight**
#### **Key Observations:**
- **FVG Support Zone (Fair Value Gap):** The price has reacted positively to this zone and is showing signs of a bullish recovery.
- **EMA Confluence:** The price is currently below the 30 EMA (red), but a breakout above could confirm stronger bullish momentum.
- **Target Point:** The analysis anticipates a move towards **85,104 USDT**, possibly after a slight pullback to test the support zone.
If the price sustains above the 30 EMA and breaks through the minor resistance, the bullish target seems achievable.

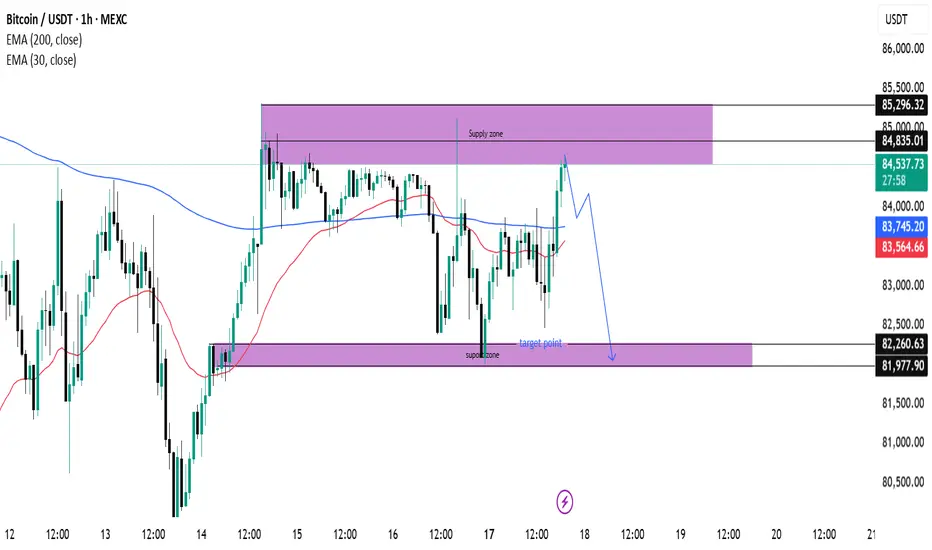
(BTC/USDT) Analysis: Supply Zone Rejection & Potential Drop Key Technical Levels:
Supply Zone (~85,296 - 84,835):
The price has reached a supply zone, which is acting as resistance. A rejection from this area could push BTC down.
Support Zone (~82,260 - 81,977):
This is a demand area where buyers might step in if the price declines.
Indicators:
EMA 30 (Red Line - 83,553.82): Short-term trend indicator.
EMA 200 (Blue Line - 83,743.52): Long-term trend indicator, currently above the price, indicating potential resistance.
Price Action & Prediction:
The price has touched the supply zone and is showing signs of rejection.
The blue projected path suggests a potential pullback followed by a drop toward the support zone (~82,260).
If price breaks below the support zone, further downside could be expected.
Potential Trade Idea:
Short Setup: If rejection at the supply zone continues, a short position could target the 82,260 support zone.
Long Setup: If price reaches the support zone and shows bullish reactions, a long position could aim for a rebound toward resistance.
BTCUSD 8H: Trendline Pressure and Key Support Test🔥 BTCUSD 8H Deep Dive
1️⃣ Trendline Pressure: Bears controlling the market with a strong descending trendline.
2️⃣ Support Zone Strength: $77,500-$80,000 is a key demand area. Previous bounce shows buyers stepping in.
3️⃣ Liquidity Hunt? Price might sweep the support zone before reversal.
4️⃣ Volume Check Needed: Low volume = fakeout risk. High volume = potential breakout.
🎯 Targets
Bullish Breakout: $85,000-$87,500
Bearish Breakdown: $77,500-$75,000
📍 Eyes on next 8H close.

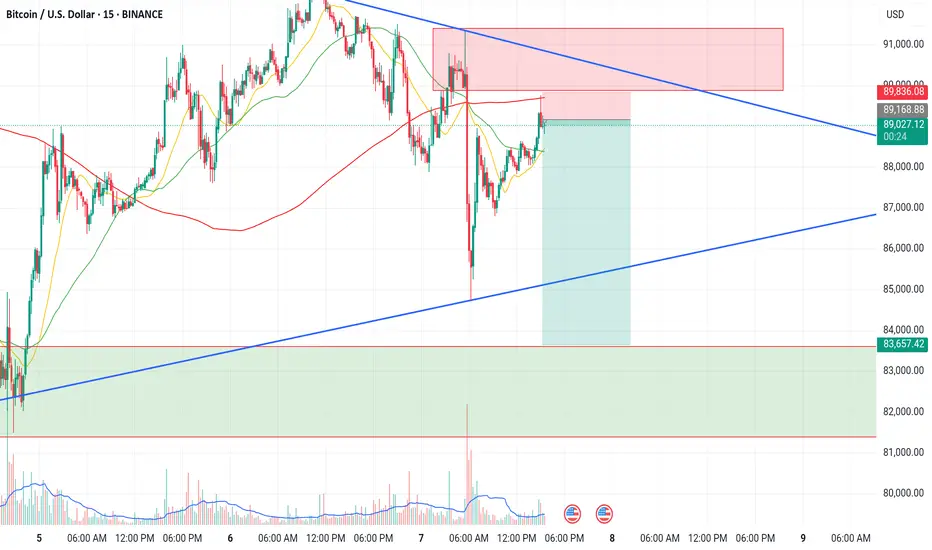
Bitcoin (BTC/USD) 30-Min Analysis: Bullish Breakout Towards $87This chart represents a 30-minute timeframe of Bitcoin (BTC/USD) on the BITSTAMP exchange. Here's a breakdown of the analysis:
Key Observations:
Support and Resistance Zones:
A Fair Value Gap (FVG) support zone is marked in purple around 82,343 - 83,498, indicating potential demand.
Another resistance zone is identified near 85,000, where price might react before moving further.
The final target point is near 87,947, suggesting a potential breakout.
Exponential Moving Averages (EMAs):
The 200 EMA (blue, 83,498) is acting as a dynamic support.
The 30 EMA (red, 83,654) is closer to the current price, indicating short-term momentum.
Trend Analysis:
An ascending trendline supports the uptrend.
The price bounced from the FVG support zone and surged, signaling bullish momentum.
Projec ted Move:
The blue arrow suggests an expected bullish breakout after a retest of the resistance zone near 85,000.
A potential 6.76% gain is anticipated, targeting 87,947.
Conclusion:
Bullish Bias: The chart suggests an upward trajectory.
Key Confirmation: A clean break above 85,000 would validate the target.
Potential Risks: A drop below the FVG support may invalidate the bullish setup.

BTCUSDT TRADING POINT UPDATE > READ THE CHAPTIANBuddy'S dear friend
SMC Trading Signals Update 🗾🗺️ crypto Traders SMC-Trading Point update you on New technical analysis setup for crypto BTC USDT. ) list time post signals 💯 reached target point ) 👉 New technical analysis setup BTC USDT looking for bullish trend 📈 FVG level support level. 83k 82k support level 87k 88k resistance level ). Guys 🤝 good luck 💯💯
Key Resistance level 87k + 88k
Key Support level 83k - 82kà
Mr SMC Trading point
Pales support boost 🚀 analysis follow)

BTC#21: Fear Index Rising. Will BTC Continue to Fall? 💎 💎 💎 BINANCE:BTCUSDT BTC's decline has somewhat slowed down in recent days with a recovery from 78k. We will plan for BINANCE:BTCUSD next 💎 💎 💎
1️⃣ **Fundamental Analysis:**
📊 The Fear and Greed Index dropped to 30 today, and the level is still fear
🚀 Cumulative net inflows into US spot Bitcoin ETFs have dropped to their lowest level since January 2
📌 The market is still in a pessimistic phase about BTC's bullish outlook. The outflow of money from the market is not only due to BTC's decline but also due to concerns about an economic recession due to Trump's unstable policies.
2️⃣ **Technical analysis:**
🔹 **D frame**: BTC's downtrend has shown signs of slowing down, but the main trend in frame D is still down. We will still need to wait for the price reaction in the resistance area to confirm.
🔹 **H4 frame**: The price trend is still down. The price reaction in the support area of 78K is not as strong as before, showing that market sentiment is still leaning towards the bears.
🔹 **H1 frame**: we are in a short-term correction. The target for this correction is the resistance area of 88-91K as you can see on the chart
3️⃣ **Trading plan:*
As you can see from the multi-frame perspective, the main trend is still down, but we are in a short-term correction. We can choose to wait for the price to return to the resistance area to trade in line with the main trend or if the price has a slight recovery, set up BUY to seek profit. However, because the main trend is down, we need to stop loss fully and not be greedy when the price hits resistance because the price can return to the main trend at any time.
💪 **Wish you success in achieving profits!**

Bitcoin (BTC/USDT) 1-Hour Chart Analysis
Bitcoin is currently in a pullback phase after reaching a local high, showing signs of short-term weakness. The price action reflects a clear upward trend supported by higher lows and strong buyer interest, but recent rejection at a resistance zone indicates profit-taking and potential short-term selling pressure.
A key support zone lies below the current price level, marked by increasing volume and a station level where buyers are likely to step in. If the price holds this support, a continuation of the bullish trend could follow, targeting the previous resistance zone. However, if the support fails, a deeper correction toward lower demand levels is possible.
Market sentiment is mixed — short-term signals show bullish strength, while higher timeframes remain cautious. The next key move depends on whether buyers defend the support zone and push through the overhead resistance. A confirmed breakout above resistance could drive the next upward leg, while a breakdown below support could shift momentum back to the bears.
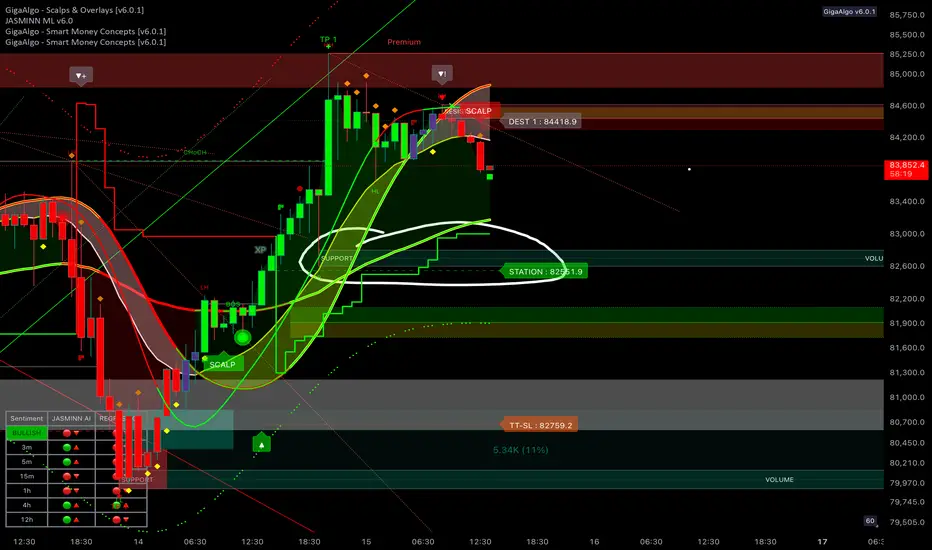
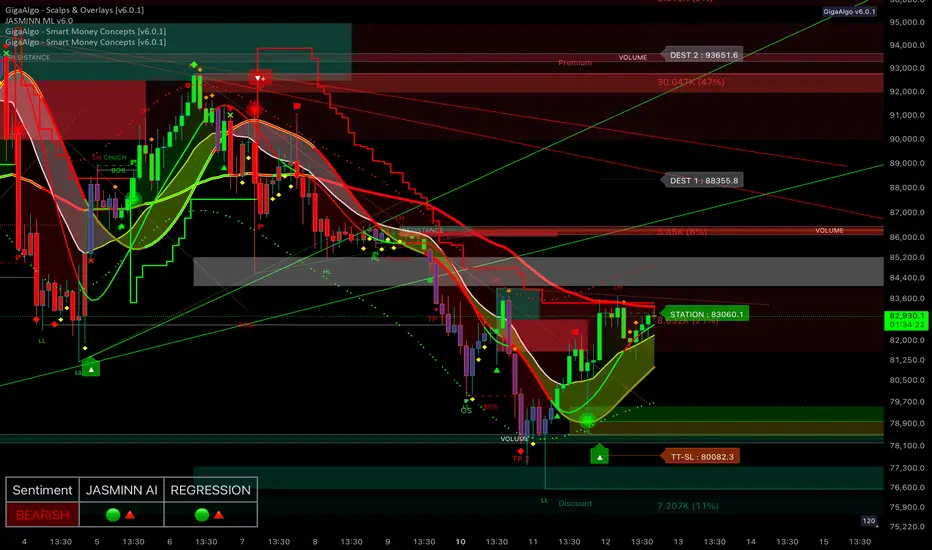
Bitcoin (BTC/USDT) 2-Hour Chart Analysis
Bitcoin is showing signs of recovery on the 2-hour chart after forming a local bottom at a key support zone. The price has bounced from a strong demand area, supported by increased buyer activity, and is currently attempting to push higher within a rising channel. The formation of higher lows (HL) and higher highs (HH) suggests that bullish momentum is building in the short term.
Despite this upward movement, the overall trend remains bearish, indicated by the dominance of red moving averages and the presence of strong resistance overhead. A major resistance zone sits above the current price level, marked by significant volume and selling pressure. The sentiment remains bearish, as confirmed by the red signal on the sentiment panel, although JASMINN AI and regression tools are showing early signs of potential upward strength.
If the price manages to break above the resistance zone and hold, the next upside target lies near the destination levels identified on the chart. However, failure to maintain upward momentum could result in a pullback toward the previous support zone, where buyers are likely to step in again. The key to further upside will be a decisive break and close above the resistance, supported by rising volume and bullish momentum. The overall market outlook remains cautiously bullish in the short term but within a larger bearish trend.
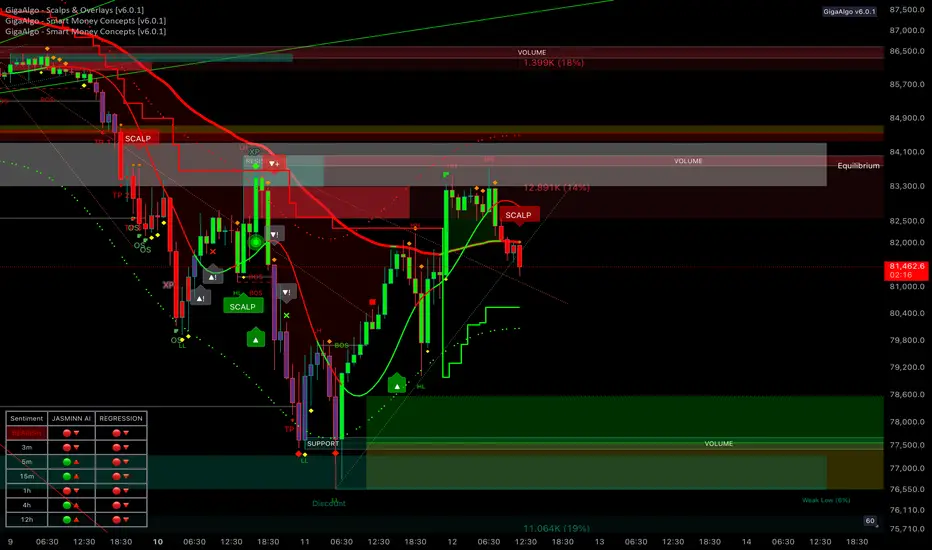
Bitcoin (BTC/USDT) 1-Hour Chart Analysis
Bitcoin is showing signs of bearish pressure on the 1-hour chart after a recent rejection from a key resistance zone. The market structure reflects a mixed trend, with signs of higher and lower lows indicating ongoing volatility. A recent break of structure and expansion suggest that the market is at a turning point.
There’s a clear resistance zone where sellers have stepped in, creating strong selling pressure. On the other hand, a support zone below shows signs of buyer interest, which could act as a floor if the price continues to decline. The equilibrium point near the middle of this range represents a potential decision area for future price movement.
Market sentiment remains bearish across multiple timeframes, reinforcing the downside bias. If the price continues to reject resistance, it could drop toward the support zone, with further downside possible if buyers fail to hold the level. Conversely, a breakout above resistance could signal renewed bullish momentum and lead to higher levels. The current outlook remains bearish, with selling pressure dominating near resistance and moderate buyer interest at support.
BITCOIN - THE FALL CONTINUESSymbol - BTCUSDT
CMP - 86200
Bitcoin is currently in a sell zone. Despite Trump's comments on the Federal Reserve and the recent Crypto Summit, these events have not had a substantial impact on the cryptocurrency market, aside from triggering a global disruption and liquidation.
So far, the market has failed to exhibit a clear bullish catalyst. Trump's statements regarding the policies related to tariffs led to a global shakeup, resulting in market liquidation. Additionally, the Crypto Summit held yesterday was unable to reverse the negative momentum, preventing the market from entering a positive phase.
From a technical perspective, global growth has temporarily stalled, and Bitcoin is now entering a significant correction phase, with 73K remaining the primary target. The market is in dire need of liquidity, as sustainable growth cannot be achieved at the expense of buyers or solely through perpetual bullish leverage.
Currently, the price is moving within a range of 90K to 82K after exiting the global consolidation phase. A false break above the 91K resistance, which had served as support during the consolidation, has resulted in a decline, potentially continuing to the 82K and 73K levels.
Resistance Levels: 89400, 91000, 93000
Support Levels: 82000, 78000, 73000
The critical liquidity zone lies between 73K and 66K. The price action suggests a false break of resistance, with an imbalance of forces favoring the bears. As such, the first potential stop is likely to be around the 82K range, marking the lower boundary of the current range. Moving forward, it is essential to observe the market's reaction to this support level. Should the market consolidate, break down, and then consolidate further below 82K, this could signal a deeper decline toward lower targets.
Despite the favorable fundamental backdrop created by US politicians, who hold considerable influence over the cryptocurrency market, the price continues to fall.

BTCUSDT TRADING POINT UPDATE >READ THE CHPTAIN SMC Trading Signals Update 🗾🗺️ crypto Traders SMC-Trading Point update you on New technical analysis setup for crypto BTC USDT. ) crypto Traders BTC USD ) list time post signals 🚀 Hit sucksfully My target point ) Now update on New analysis setup. BTC USDT still drop 💧. Trend 📉. Technical patterns FVG) 85k. Back down trand target point 78k.
Key Resistance level 85k
Key Support level 81k- 78k
Mr SMC Trading point
Pales support boost 🚀 analysis follow)

BTCUSDTBINANCE:BTCUSDT
As you can see in BTCUSDT was consolidation upto 1day so either side breakout we can take a trade and expect up to 5% movement. Takr retest entries to avoid falls breakouts and plan your trade accordingly.

BTCUSDT TRADING POINT UPDATE >READ THE CHAPTIAN Buddy's dear friend 👋
SMC Trading Signals Update 🗾🗺️ crypto Traders SMC-Trading Point update you on New technical analysis setup for crypto BTC USDT BTC still rejected supply zone. Again. Back Short Trade. FVG level) 83k I'm want to Sell now short trend 📈
Key Resistance level 93k + 95k
Key Support level 85k - 83k
Mr SMC Trading point
Pales support boost 🚀 analysis follow)

BTC#20: BTC Analysis: Price SW In Triangle – Next Direction?💎 💎 💎As analyzed in the previous article, BINANCE:BTCUSDT gave a bad price reaction when touching the old resistance area of 95~96x. The current price is SW in the triangle. Let's analyze the next plan BINANCE:BTCUSD : 💎 💎 💎
1️⃣ **Fundamental analysis:**
📊President Donald Trump signed an executive order to establish a Strategic Cryptocurrency Reserve that includes 200,000 BTC seized in criminal or civil cases. It will be held as a reserve asset and not sold. In addition, the Government will not purchase additional assets for the reserve.
🚀The Treasury and Commerce Departments may consider budget-neutral Bitcoin purchases. Agencies must provide full accounting books of digital assets to the Ministry of Finance. Regulatory crackdowns on crypto assets are ended
📌 From the above information, it can be seen that BTC and the top 5 coins in the market have been officially recognized as an asset. The legal framework will take time to complete. However, BTC will receive more attention and attention when the US government makes any purchase moves to hoard. This will lead to a huge demand for BTC in the near future.
2️⃣ **Technical analysis:**
🔹 **D Frame**: The price structure is still bearish, we have had a recovery phase to retest the resistance area and give a bad price reaction. It is entirely possible that BTC will go down to the support zone below
🔹 **H4 Frame**: We can see the price reaction more clearly. The continuous reaction of lower peaks in this area shows that the market sentiment is still dominated by the bears even though BTC has been recognized as a reserve asset.
🔹 **H1 frame**: The price is still SW in the triangle area in recent days. The price range is gradually narrowing as shown on the chart
3️⃣ **Trading plan:*
⛔ At the present time, it is no longer suitable to wait for a BUY position. The price has tested the resistance area and reacted badly, so there is a high possibility that there will be a correction below the support area below at any time.
✅ The top priority is to trade in accordance with the main trend in the SELL direction. Although the information about the Reserve Fund has given a positive response, the government not buying more assets for the reserve is also a sign that short-term cash flow will be difficult to push into BTC, especially when tariff policies are giving negative reactions to the economy.
💪 **Wishing you success in achieving profits!**

Very good shorting opportunity in BTC. Trade setup explainedBtc is getting rejection from 1hour supply zone. We can short btc with sl of 89840. We can target level of 83650. Risk reward ratio of the trade is very good i.e 1:8. Below at 83000 levels We have a demand zone which will be our target for the trade.
BTC#19: “Cryptocurrency Reserves” and trading plants💎 💎 💎 After Trump posted about his plan to put BTC into the national cryptocurrency reserve, BINANCE:BTCUSDT BINANCE:BTCUSD had a meteoric rise back to 93~95x. Let's plan to trade BTC: 💎 💎 💎
1️⃣ **Fundamental Analysis:**
📊 The current market is dominated by “US crypto assets”.
🚀 Trump: Will put BTC into the national reserve, this will help the crypto sector break out. However, it is also important to note that the US lacks budget support and crypto reserves are just empty words at present.
📌 The probability of the Fed keeping interest rates unchanged in March is 93%.
It can be seen that the current cash flow injected into the market is not really significant because interest rates have not yet decreased and the US tariff policy is still waiting to cause an economic war. Current news plays a role in restraining the downward momentum and fear in the recent past.
2️⃣ **Technical analysis:**
🔹 **Frame D**: it can be seen that the price is looking for an important resistance area. Note that the current price structure is decreasing, so the price can still turn around at any time when it touches the diagonal resistance zone.
🔹 **Frame H4**: It is clear that yesterday's increase has not yet had any technical recovery to be able to break through the current resistance zone.
🔹 **Frame H1**: Temporarily, the price is still in an upward trend influenced by yesterday's positive news. The previously broken trendline will act as an important support for the price to break out in the near future
3️⃣ **Trading plan:*
⛔ The current area is no longer ideal for establishing a trading position, if the price still has no recovery, we can consider looking for a SELL position when the price reaches the diagonal resistance area when a price structure appears on a smaller time frame. BUY should only be made if the price recovers and accumulates in the old resistance area and an increasing price structure appears on a smaller time frame.
✅ On the D and H4 time frames, the price structure is still bearish, besides, H1 has increased strongly without any technical recovery due to the influence of positive news. So we can completely wait for a trading opportunity when the price finds an important resistance and support zone.
💪 **Wishing you success in achieving profits!**
