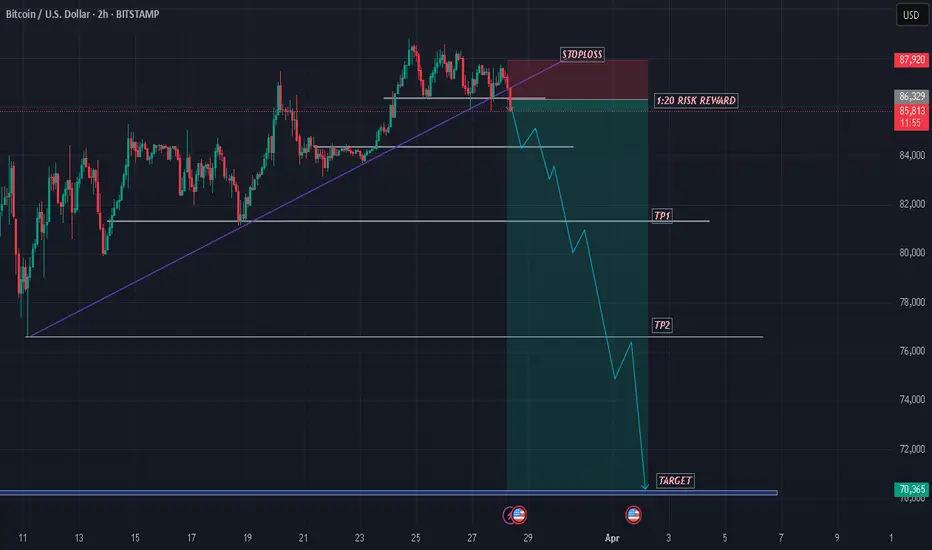
BTCUSD SHOWING A GOOD DOWN MOVE WITH 1:20 RISK REWARD BTCUSD SHOWING A GOOD DOWN MOVE WITH 1:20 RISK REWARD
DUE TO THESE REASON
A. its following a rectangle pattern that stocked the market
which preventing the market to move any one direction now it trying to break the strong resistant lable
B. after the break of this rectangle it will boost the market potential for break
C. also its resisting from a strong neckline the neckline also got weeker ald the price is ready to break in the outer region
all of these reason are indicating the same thing its ready for breakout BREAKOUT trading are follws good risk reward
please dont use more than one percentage of your capitalfollow risk reward and tradeing rules
that will help you to to become a bettertrader
thank you
Btcusdtanalysis
Bitcoin (BTC/USD) Supply & Demand Zone Analysis – Potential BearThis chart represents a Bitcoin (BTC/USD) price analysis on a 30-minute timeframe. Here’s a breakdown of the key elements:
Supply Zone (Resistance) at ~$85,599
The price has approached this supply zone, which could act as a resistance level.
The expectation is that the price may struggle to break above this level and could reverse downward.
Demand Zone (Support) at ~$81,500 - $81,755
This is labeled as the "diamond zone," which could act as a strong support area where buying interest may emerge.
The price is anticipated to decline towards this level.
Projected Price Movement
The blue arrows suggest a bearish scenario.
The price might initially react to the supply zone, then break below the trendline, confirming a downtrend.
The target for this downward move is the demand zone around $81,500.
Trendline Break
A rising trendline is drawn, which currently acts as support.
If the price breaks below it, it would confirm a bearish momentum shift.
Conclusion
This chart suggests a short-selling opportunity near the supply zone, targeting the demand zone. However, traders should watch for confirmations such as a rejection from resistance and a break below the trendline before entering a trade.

BTCUSD SHOWING A GOOD UP MOVE WITH 1:10 RISK REWARD BTCUSD SHOWING A GOOD
UP MOVE WITH 1:10 RISK REWARD
DUE TO THESE REASON
A. its following a rectangle pattern that stocked the market
which preventing the market to move any one direction now it trying to break the strong resistant lable
B. after the break of this rectangle it will boost the market potential for break
C. also its resisting from a strong neckline the neckline also got weeker ald the price is ready to break in the outer region
all of these reason are indicating the same thing its ready for breakout BREAKOUT trading are follws good risk reward
please dont use more than one percentage of your capitalfollow risk reward and tradeing rules
that will help you to to become a bettertrader
thank you

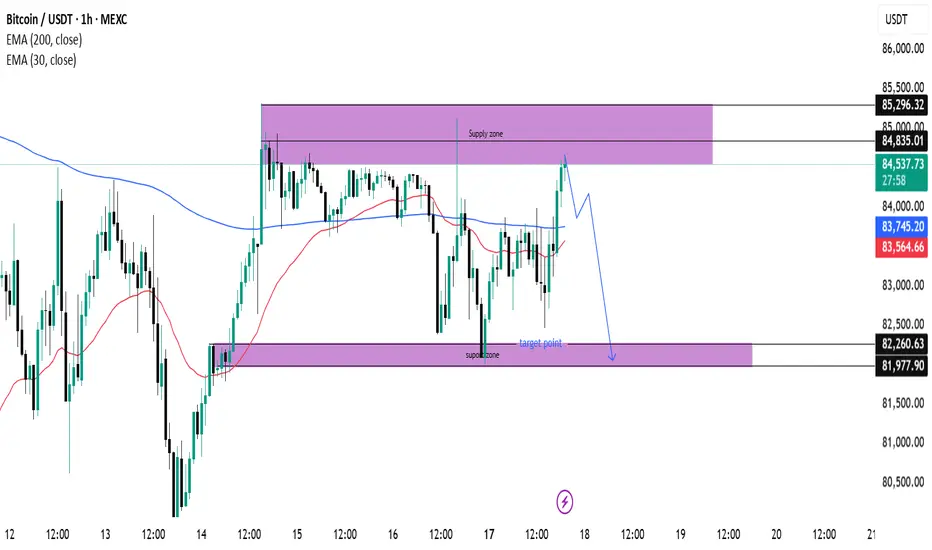
(BTC/USDT) Analysis: Supply Zone Rejection & Potential Drop Key Technical Levels:
Supply Zone (~85,296 - 84,835):
The price has reached a supply zone, which is acting as resistance. A rejection from this area could push BTC down.
Support Zone (~82,260 - 81,977):
This is a demand area where buyers might step in if the price declines.
Indicators:
EMA 30 (Red Line - 83,553.82): Short-term trend indicator.
EMA 200 (Blue Line - 83,743.52): Long-term trend indicator, currently above the price, indicating potential resistance.
Price Action & Prediction:
The price has touched the supply zone and is showing signs of rejection.
The blue projected path suggests a potential pullback followed by a drop toward the support zone (~82,260).
If price breaks below the support zone, further downside could be expected.
Potential Trade Idea:
Short Setup: If rejection at the supply zone continues, a short position could target the 82,260 support zone.
Long Setup: If price reaches the support zone and shows bullish reactions, a long position could aim for a rebound toward resistance.
Bitcoin (BTC/USD) 30-Min Analysis: Bullish Breakout Towards $87This chart represents a 30-minute timeframe of Bitcoin (BTC/USD) on the BITSTAMP exchange. Here's a breakdown of the analysis:
Key Observations:
Support and Resistance Zones:
A Fair Value Gap (FVG) support zone is marked in purple around 82,343 - 83,498, indicating potential demand.
Another resistance zone is identified near 85,000, where price might react before moving further.
The final target point is near 87,947, suggesting a potential breakout.
Exponential Moving Averages (EMAs):
The 200 EMA (blue, 83,498) is acting as a dynamic support.
The 30 EMA (red, 83,654) is closer to the current price, indicating short-term momentum.
Trend Analysis:
An ascending trendline supports the uptrend.
The price bounced from the FVG support zone and surged, signaling bullish momentum.
Projec ted Move:
The blue arrow suggests an expected bullish breakout after a retest of the resistance zone near 85,000.
A potential 6.76% gain is anticipated, targeting 87,947.
Conclusion:
Bullish Bias: The chart suggests an upward trajectory.
Key Confirmation: A clean break above 85,000 would validate the target.
Potential Risks: A drop below the FVG support may invalidate the bullish setup.

BTCUSDT TRADING POINT UPDATE > READ THE CHAPTIANBuddy'S dear friend
SMC Trading Signals Update 🗾🗺️ crypto Traders SMC-Trading Point update you on New technical analysis setup for crypto BTC USDT. ) list time post signals 💯 reached target point ) 👉 New technical analysis setup BTC USDT looking for bullish trend 📈 FVG level support level. 83k 82k support level 87k 88k resistance level ). Guys 🤝 good luck 💯💯
Key Resistance level 87k + 88k
Key Support level 83k - 82kà
Mr SMC Trading point
Pales support boost 🚀 analysis follow)

Bitcoin (BTC/USDT) Short Trade Setup | 30-Min Chart AnalysisThis chart is a Bitcoin (BTC/USDT) 30-minute timeframe trading setup from Binance on TradingView, showing a short (sell) trade setup with a stop loss, entry, and multiple take profit (TP) levels.
Key Observations:
Indicators Used:
200 EMA (blue line at 83,177.82 USDT) – Long-term trend indicator.
30 EMA (red line at 84,064.45 USDT) – Short-term trend indicator.
Trade Setup:
Entry: 84,423.01 USDT
Stop Loss: 85,315.76 - 85,330.89 USDT (Above the recent high)
Take Profit Levels:
TP1: 84,064.45 USDT
TP2: 83,953.94 USDT
TP3: 83,439.48 USDT
Final Target: 81,850.69 USDT
Market Context:
Price recently tested the 30 EMA and is potentially rejecting it.
Bearish outlook: If price fails to break higher, it may drop to TP levels.
Risk-to-Reward Ratio (RRR): Favorable

BTCUSD SHOWING A GOOD DOWN MOVE WITH 1:30 RISK REWARD BTCUSD SHOWING A GOOD DOWN MOVE WITH 1:30 RISK REWARD
DUE TO THESE REASON
A. its following a rectangle pattern that stocked the market
which preventing the market to move any one direction now it trying to break the strong resistant lable
B. after the break of this rectangle it will boost the market potential for break
C. also its resisting from a strong neckline the neckline also got weeker ald the price is ready to break in the outer region
all of these reason are indicating the same thing its ready for breakout BREAKOUT trading are follws good risk reward
please dont use more than one percentage of your capitalfollow risk reward and tradeing rules
that will help you to to become a bettertrader
thank you

BITCOIN - THE FALL CONTINUESSymbol - BTCUSDT
CMP - 86200
Bitcoin is currently in a sell zone. Despite Trump's comments on the Federal Reserve and the recent Crypto Summit, these events have not had a substantial impact on the cryptocurrency market, aside from triggering a global disruption and liquidation.
So far, the market has failed to exhibit a clear bullish catalyst. Trump's statements regarding the policies related to tariffs led to a global shakeup, resulting in market liquidation. Additionally, the Crypto Summit held yesterday was unable to reverse the negative momentum, preventing the market from entering a positive phase.
From a technical perspective, global growth has temporarily stalled, and Bitcoin is now entering a significant correction phase, with 73K remaining the primary target. The market is in dire need of liquidity, as sustainable growth cannot be achieved at the expense of buyers or solely through perpetual bullish leverage.
Currently, the price is moving within a range of 90K to 82K after exiting the global consolidation phase. A false break above the 91K resistance, which had served as support during the consolidation, has resulted in a decline, potentially continuing to the 82K and 73K levels.
Resistance Levels: 89400, 91000, 93000
Support Levels: 82000, 78000, 73000
The critical liquidity zone lies between 73K and 66K. The price action suggests a false break of resistance, with an imbalance of forces favoring the bears. As such, the first potential stop is likely to be around the 82K range, marking the lower boundary of the current range. Moving forward, it is essential to observe the market's reaction to this support level. Should the market consolidate, break down, and then consolidate further below 82K, this could signal a deeper decline toward lower targets.
Despite the favorable fundamental backdrop created by US politicians, who hold considerable influence over the cryptocurrency market, the price continues to fall.

BTCUSDT TRADING POINT UPDATE >READ THE CHPTAIN SMC Trading Signals Update 🗾🗺️ crypto Traders SMC-Trading Point update you on New technical analysis setup for crypto BTC USDT. ) crypto Traders BTC USD ) list time post signals 🚀 Hit sucksfully My target point ) Now update on New analysis setup. BTC USDT still drop 💧. Trend 📉. Technical patterns FVG) 85k. Back down trand target point 78k.
Key Resistance level 85k
Key Support level 81k- 78k
Mr SMC Trading point
Pales support boost 🚀 analysis follow)

BTCUSDT TRADING POINT UPDATE >READ THE CHAPTIAN Buddy's dear friend 👋
SMC Trading Signals Update 🗾🗺️ crypto Traders SMC-Trading Point update you on New technical analysis setup for crypto BTC USDT BTC still rejected supply zone. Again. Back Short Trade. FVG level) 83k I'm want to Sell now short trend 📈
Key Resistance level 93k + 95k
Key Support level 85k - 83k
Mr SMC Trading point
Pales support boost 🚀 analysis follow)

BTCUSD SHOWING A GOOD DOWN MOVE WITH 1:10 RISK REWARD BTCUSD SHOWING A GOOD DOWN MOVE WITH 1:10 RISK REWARD
DUE TO THESE REASON
A. its following a rectangle pattern that stocked the market
which preventing the market to move any one direction now it trying to break the strong resistant lable
B. after the break of this rectangle it will boost the market potential for break
C. also its resisting from a strong neckline the neckline also got weeker ald the price is ready to break in the outer region
all of these reason are indicating the same thing its ready for breakout BREAKOUT trading are follws good risk reward
please dont use more than one percentage of your capitalfollow risk reward and tradeing rules
that will help you to to become a bettertrader
thank you

BTCUSDT TRADING POINT UPDATE >READ THE CHPATIANBuddy'S dear friend 👋
SMC Trading Signals Update 🗾🗺️ crypto Traders SMC-Trading Point update you on New technical analysis setup for BTC USDT signals 🚀. BTC list 3 months. Drop 💧. moment close below 👇 big support level now. See tow Big support level. One said close that expect it buying or selling position. 80k close below 1D candle that expect more selling position 49k. ) if not close below 1D back up trand close above 82k 83k expect it more Bullish trend 📈 📈
Key Resistance level 104k
Key Support level 80k 49k
Mr SMC Trading point
Plaes support boost 🚀 analysis follow)

BTCUSD SHOWING A GOOD DOWN MOVE WITH 1:10 RISK REWARD BTCUSD SHOWING A GOOD DOWN MOVE WITH 1:10 RISK REWARD
DUE TO THESE REASON
A. its following a rectangle pattern that stocked the market
which preventing the market to move any one direction now it trying to break the strong resistant lable
B. after the break of this rectangle it will boost the market potential for break
C. also its resisting from a strong neckline the neckline also got weeker ald the price is ready to break in the outer region
all of these reason are indicating the same thing its ready for breakout BREAKOUT trading are follws good risk reward
please dont use more than one percentage of your capitalfollow risk reward and tradeing rules
that will help you to to become a bettertrader
thank you

Bitcoin Following 2013-2017 Fractal - UPDATE -still on target ?
As expected, PA has dropped below the Fractal pattern but given how overBought PA was, this is not surprising and I think I mentioned this last time I posted this chart, that we may drop below.
It does bring up the idea that we may have fallen off the pattern, as there is always a time when PA stops following Fractals..But we have to wait and see
We can see how in August 2023, PA fell below this fractal line..and indeed, to many extents, we were close to a bear entry there. as shown by some on chain data......But PA recovered
We can see how in 2023, PA Accelerated very quickly from this point on the Fractal.
Current PA is NOT in a position to do this.
Weekly MACD is Over Bought and is currently Falling Bearish, cooling off. At current rate of descent, is will be MAY when PA has enough strength on a Weekly chart to try and catch up with the Fractal once again.
You can see that rising Long Term line of support ( Dashed line )
We bounced off it Twice in this cycle...
Once when we began recovery in Jan 2023 and again, When we nearly entered that Bear when we fell under the Fractal in August 2023
A Vertical Drop by PA from current position takes us to 58K usdt on that line
I think I prefer to think we could see 65K off that line if we retrace enough in April.
But I have just posted about the expected MARCH candle Close and how we seem to be more likely to see a RED March and a Green April
So, are we still on track to follow Fractal ?
Impossible to say but if the Monthly candle close chart turns out to be accurate, then we could catch up and overtake the Fractal in Q3
We need to watch this closely...
p.s. A Red Mach candle Close need not be a big drop from current price, a decrease of only 0.01 usdt would create a RED candle....

Bitcoin Monthly Candle Close Colours from 2011 - maybe RED March
The Odds were higher to get a GREEN February Close but we ended up closing RED
Of the previous 3 RED February closes, Everyone was followed by a RED MARCH
Those same previous RED February Candles were all preceded by a GREEN JAN
We have just had a GREEN January and a RED February and so, Odds are that March will also be RED.
But as we saw in the JANUARY post of this chart, the odds were for a GREEN Feb this year....so do not take this as a certainty. For March to close RED, we do not need to see a massive drop. Just 0.01 USDT below this Feb Close is enough
Also on a BEARISH side, the candles colours since October 2024 follow the sequence from pre 2013 ATH to just after, entering a bear
From Oct 2013 till Feb, Green Green Red Green Red- followed by March and April RED also.
From Oct 2024 till Feb, Green Green Red Green Red
On the BULLISH side, and this has a higher % chance of repeating, Of those 3 previous occasions were we had Green Jan then a Red Feb and a Red March, Two of those Three were entering a Bull run. 2012 and 2020
It should be Noted that those years were the years BEFORE Cycle TOP - We are currently IN the year of expected cycle TOP
Currently March is 6 Green - 7 Red monthly closes.
March is Currently GREEN at time of writing ( 1st March )
Of the previous 7 RED March, 5 were followed by a Green April
Of the 6 Green closes, 3 were followed by a Green April
Of those 6 Green March closes, only 2 really led on to further multi month gains.
In conclusion,
We are statistically more likely to get a RED March and that would put us in a better position to continue to reach a cycle ATH later in the year as the weekly MACD is still falling Bearish from High.
This will have cooled off PA and allowed it to range, possibly in a Wyckoff distribution model
A Red March also Gives us a better buying opportunity and MAYBE, MAYBE some time for ALTS to recover some o their losses......Maybe......
But it really should be remembered that we could also be entering a bear. More info is needed before this is seen clearly but caution is certainly something I will continue to talk about.
Stay safe and remain Cautious

Is Bitcoins NUPL showing us we already had 2 cycle Tops ?As explained by Trading View
"Indicator Overview NET UNREALISED PROFIT LOSS - NUPL
This indicator is derived from Market Value and Realized Value, which can be defined as:
**Market Value: The current price of Bitcoin multiplied by the number of coins in circulation. This is like market cap in traditional markets i.e. share price multiplied by number of shares.
**Realized Value: Rather than taking the current price of Bitcoin, Realized Value takes the price of each Bitcoin when it was last moved
It then adds up all those individual prices and takes an average of them. It then multiplies that average price by the total number of coins in circulation.
By subtracting Realized Value from Market Value we calculate Unrealized Profit/Loss.
The Net Unrealized Profit/Loss (NUPL) for Bitcoin can drop due to several factors.
One significant reason is the correction in Bitcoin's price
This price correction can push the NUPL indicator closer to the fear area, which begins after a drop below 0.25.
Additionally, short-term holders (STH) may still be experiencing capitulation, indicating that new investors are still underwater.
This can cause the NUPL to reflect deeper pessimism among newer investors, even if the overall market sentiment shows signs of optimism.
SO, we can see from the chart how, back in 2021, NUPL went up and peaked twice - each occasion was around the 1st major ATH and then Cycle ATH in Nov 2021.
Also note how the NUPL was lower the 2nd time round as Most major profit taking had been taken in March and so the next lowest Buy price was on the Dip before PA began to rise, and so the profit margin was lower
We have just experienced a similar thing this cycle..The peaks of profit taking were a similar number of days apart and om a similar Range to 2021
And now, we see the NUPL Dropping.
This is. to remind you, the fact that PA is dropping and Short term holders, who bought High, are now in Loss, underwater.
Does this mean that we are at cycle end ?
NOT AT ALL
But it does very clearly show how all th epeople that said "This time is different" WERE RIGHT
So, Hang on Guys and Gals, - it is different,
Keep your eyes on NUPL,it is a great way of seeing Market Profits and how, when nthis is high, Profit taking is very likely to happen
It is also a great signal as to when to BUY, when this is Low....it is usually because PA is LOW

BITCOIN TESTING $87K - FALSE OR TRUE BREAKDOWN?Symbol - BTCUSD
CMP 87100
BTCUSD has entered a risk zone, exhibiting a breakdown of the key support level. The market's attention is now on the bulls and their ability to maintain their defense. On the daily and weekly timeframes, the price is in a phase of global consolidation following a period of significant upward movement. The focus remains on the $90-91K range, a strong support area that aligns with the broader trend. Currently, a breakdown of support appears to be unfolding.
On the local timeframes (H1 - H4), the price is testing the support of the local channel, as well as the risk zone at 87,000. If the bulls are able to sustain their defense above 86,400 level, Bitcoin could potentially strengthen. In this scenario, the primary target would be $91-92K
Key support levels: 86,400, 85,530
Key resistance levels: 89,400, 91,600
Historically, the most significant price movements tend to occur after a false breakdown. However, the critical factor here is whether the breakout is genuine or false. In this case, confirmation is required — specifically, price consolidation above the key zones and levels.
Regarding my previous BTCUSD analysis, I had projected a decline to the $90K risk zone while Bitcoin was trading around $96-97K at that time. After some consolidation, the analysis proved accurate as Bitcoin dropped to the $90K range.
I believe this recent sell-off has disrupted the previous bullish structure, and a bearish structure is now beginning to take shape. I expect a retracement to the $91-92K range before the downtrend continues.

So, the Range box WAS hiding a Secret - what now for Bitcoin
2 days ago, I posted and showed why the Current Range Box of Bitcoin may have had a bearish secret and, well , It happened.
Currently, PA has fallen out of Range and is sitting on levels of Low support
And, as I have been saying since November, there is a CME Gap from 80700 down to 77535
This Gap may get filled as this could be an excellent opportunity to do so.
It is also a great chance for us mere mortals to buy a few More Sats of a Bitcoin at a cheaper price than previously.
And I will, I do not believe this cycle is over yet...
Notice the 2.272 Fib line at 78920 which will offer support and then, just below that we have a rising Long Term line of support at around 76100, depending where PA hits it, should the support above fail.
Of course, we should remember that PA may turn around now, and reclaim a higher high
We have to Watch and react to what happens...
Stay safe

BITCOIN PA got rejected by the same Fib Circle as Nov 2021 ATH
This may not really Mean anything other than to show how amazing Fib Circles are and how they have a legacy in the past, even if the anchors are in the future.
Let me Explain.
To Draw a Fib circle, on the whole, we place one Anchor on a Low point of PA and then place a 2nd on a high
These Fib Circles have their Anchors in Early 2023
But Look how these Circles cross PA back in 2021.
The Current Circle that PA just went through and then turned down in the 2.618
On the Left side of the chart, see that Fib Circlwe that rejected March 2021 ATH..thats the 3.618 which we will cross again from July 2025
See what happened with the inner circle, the 1.618, on both occasions the PA ran into it.
Just somethin to think about while we wait for BTC PA to Dip down to 77K and bounce back up ;-)

BITCOIN IS HEADED TO 90K?Symbol - BTCUSD
BTCUSD is reflecting a shift in market sentiment, with its current price action indicating a potential continuation of the ongoing correction. BTCUSD is currently trading within a falling channel pattern, with global market consolidation providing the broader context. There is a possibility of another retest of the 90,000 risk zone. On the medium-term timeframe, Bitcoin has failed to maintain its position near its all-time high, entering the local selling zone below the 99,800 level, and is now within the upper consolidation range. This shift is accompanied by a noticeable negative sentiment within the cryptocurrency market. Altcoins continue to experience persistent declines without any signs of recovery, further highlighting the lack of positive prospects. At this stage, Bitcoin appears to be reacting to the lack of fulfillment of promises from President Trump, as well as ongoing market manipulation and geopolitical tensions. These factors are contributing to the market’s protracted correction phase. New coins created ahead of the U.S. election have siphoned liquidity from the market, adding to the bearish sentiment. This situation, combined with a global trade conflict, has led to a significant market downturn.
Support levels: 95,800, - 91,300, - 90,000
Resistance levels: 1,00,300 - 1,02,670
Technically, Bitcoin may continue its downward movement, potentially testing the 90,000 support level again. As the price approaches this level, the risks surrounding it will increase. Currently, the asset is in a consolidation phase between 95,800 and 1,00,300 which could precede a breakdown and further decline towards 90,000. However, considering Bitcoin’s sensitivity to U.S. political actions, there may be a temporary rise towards the 1,00,300 level before the asset resumes its decline. The likelihood of the price testing the 95,800 level for a breakdown and subsequent fall remains high. However, on a broader scale, the asset still maintains a bullish outlook, with strong support placed in the 90K-91K zone.

Could Bitcoin PA head down to fill CME Gap at 82K-77K usdt
And the answer is "Very possibly"
50 SMA ( RED ) -100 SMA ( BLUE ) - 128 SMA ( GREEN ) - 200 SMA ( YELLOW )
For a start, Lets Look at what the 50 SMA did in the previous range.
PA bounced off that 50, having tested it 4 weeks previously ( see wick down )
I can see no reason why that would not happen again if PA reaches this point.
But we are now seeing the 50 beginning to flatten out after 3 months of PA ranging.
The CME Gap exists since 11 Nov 2024
Price range of Gap is 80720 down to 77535
On the main chart, See how that 50 SMA is currently flattening out just under this range ?
If PA comes down to the 50 SMA for support, it will fill that CME gap.
Notice also how there is a similarity to the pattern of PA from that Range in 2024, though it seems we are experiencing a contracted version.
As mentioned in previous posts, this range is also different in that we are under a 618 Fib Ext.
Little Support below.
This does not mean we will not bounce, indeed, I think we will but ultimately, I can see PA visiting that CME Gap, even if it is just a flash Wick down.
It is a superb opportunity to buy BTC at a lower price

Here is why Bitcoin cycle ATH in Q4 maybe @ 250 K USDT
This is my oldest chart
I trust this chart - Keeping iot simple
See the Pennant PA is currently in, under resistance of the 2.618 Fib Ext.
Previous 618 Ext have been support this cycle and this leads me to think we will remain here a while.
The Rising line of support we are in pushes PA to an apex in June and PA will react shortly before that time. ( PA may drop below support and then return before June)
Weekly MACD currently falling Bearish, resetting and should be Neutral by June and so I am seeing PA rising from there.
See how PA reacts to a Fib Circle. In this Cycle,
Note that this apex of the triangle we are currently in is just after the 9.618 Fib Circle.
IF we range into the Fib circle in June, I fully expect PA to Rise after
Last time we ranged into a Fib circle with a Neutral MACD, was in Jan 2023 on the 4.618.
This lead to a rise of just under 100%
The Upper Blue Trend Line is the Ascending line of the previous Bitcoin ATH Tops, back to 2017 on this chart but to 2013 on Longer range charts.
Many charts have confluence for a cycle Top in Q4 2025 and so, using that blue line, the expected push higher from BTC PA when it breaks out of pennant in June ( or near June), we end up around the 250K USDT mark
This would, like in Jan 2023, lead to a increase in Price around 100% ( a little more actually )
While this is all based on Assumptions that PA remains Calm and in Range while the MACD resets itself from Oversold, it has happened before and there exists the chance it will again
Obviously, PA may fall through the floor and so we all need to have plans for Both Bullish and Bearish scenarios. ( there is a strong possibility of a Dip to Mid 70K and swift return )
But over all, I find THIS chart to point towards a more realistic cycle Top ATH of 250 K
Some LOG charts point to a near 1Million USDT Cycle top and that, given the market Cap required, is probably not going to happen THIS cycle....... But it will one day
As ever, we take Bitcoin PA as it comes.....and react accordingly.
This week is going to be Fun
End of Month on Friday - Monthly patterns showing some interesting things.
I'll explain those next week after month close.
