BTCUSD-Eyes on Bullish PullbackPrice action formed a clean pullback into prior support after an earlier rally.
Multiple Buy signals have appeared at the lows, with the latest near a previous Liquidity Control Box.
The yellow caution label triggered near the top earlier, signaling possible short-term exhaustion — now invalidated as price re-approaches structure.
🔍 Trade Structure (Educational Reference):
Observed Entry Zone: Near 117,840 after reclaiming short-term EMA
Stop Level: Below 117,379 (beneath structure low)
Potential Target: 121,102 — aligns with higher timeframe imbalance and previous untested levels
🧠 SignalPro Notes:
The earlier Sell signals followed by failed downside continuation show weakening bearish control.
EMA realignment in progress — continued strength above white EMA could accelerate momentum.
⚠️ This chart and analysis are for educational purposes only. It is not financial advice. Please perform your own analysis and manage risk carefully.
Btcusdtforecast

BTCUSD SHOWING A GOOD DOWN MOVE WITH 1:10 RISK REWARD BTCUSD SHOWING A GOOD DOWN MOVE WITH 1:10 RISK REWARD
DUE TO THESE REASON
A. its following a rectangle pattern that stocked the market
which preventing the market to move any one direction now it trying to break the strong resistant lable
B. after the break of this rectangle it will boost the market potential for break
C. also its resisting from a strong neckline the neckline also got weeker ald the price is ready to break in the outer region
all of these reason are indicating the same thing its ready for breakout BREAKOUT trading are follws good risk reward
please dont use more than one percentage of your capital follow risk reward and tradeing rules
that will help you to to become a bettertrader
thank you

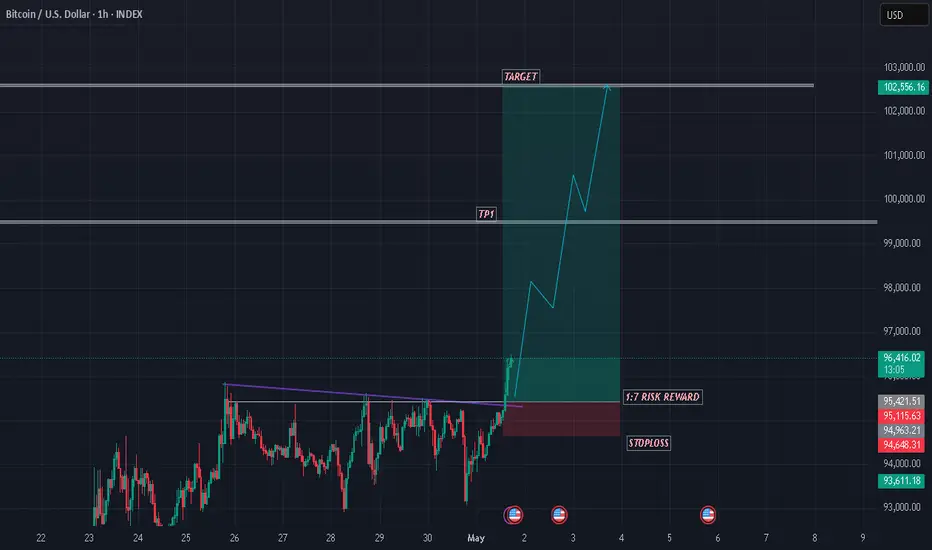
BTCUSD SHOWING A GOOD UP MOVE WITH 1:7 RISK REWARD BTCUSD SHOWING A GOOD
UP MOVE WITH 1:7 RISK REWARD
DUE TO THESE REASON
A. its following a rectangle pattern that stocked the market
which preventing the market to move any one direction now it trying to break the strong resistant lable
B. after the break of this rectangle it will boost the market potential for break
C. also its resisting from a strong neckline the neckline also got weeker ald the price is ready to break in the outer region
all of these reason are indicating the same thing its ready for breakout BREAKOUT trading are follws good risk reward
please dont use more than one percentage of your capitalfollow risk reward and tradeing rules
that will help you to to become a bettertrader
thank you

BTCUSD SHOWING A GOOD DOWN MOVE WITH 1:7 RISK REWARD BTCUSD SHOWING A GOOD DOWN MOVE WITH 1:7 RISK REWARD
DUE TO THESE REASON
A. its following a rectangle pattern that stocked the market
which preventing the market to move any one direction now it trying to break the strong resistant lable
B. after the break of this rectangle it will boost the market potential for break
C. also its resisting from a strong neckline the neckline also got weeker ald the price is ready to break in the outer region
all of these reason are indicating the same thing its ready for breakout BREAKOUT trading are follws good risk reward
please dont use more than one percentage of your capitalfollow risk reward and tradeing rules
that will help you to to become a bettertrader
thank you

BTCUSD SHOWING A GOOD UP MOVE WITH 1:10 RISK REWARD BTCUSD SHOWING A GOOD
UP MOVE WITH 1:10 RISK REWARD
DUE TO THESE REASON
A. its following a rectangle pattern that stocked the market
which preventing the market to move any one direction now it trying to break the strong resistant lable
B. after the break of this rectangle it will boost the market potential for break
C. also its resisting from a strong neckline the neckline also got weeker ald the price is ready to break in the outer region
all of these reason are indicating the same thing its ready for breakout BREAKOUT trading are follws good risk reward
please dont use more than one percentage of your capitalfollow risk reward and tradeing rules
that will help you to to become a bettertrader
thank you
BTCUSD SHOWING A GOOD DOWN MOVE WITH 1:10 RISK REWARD BTCUSD SHOWING A GOOD DOWN MOVE WITH 1:10 RISK REWARD
DUE TO THESE REASON
A. its following a rectangle pattern that stocked the market
which preventing the market to move any one direction now it trying to break the strong resistant lable
B. after the break of this rectangle it will boost the market potential for break
C. also its resisting from a strong neckline the neckline also got weeker ald the price is ready to break in the outer region
all of these reason are indicating the same thing its ready for breakout BREAKOUT trading are follws good risk reward
please dont use more than one percentage of your capitalfollow risk reward and tradeing rules
that will help you to to become a bettertrader
thank you

BTCUSD SHOWING A GOOD DOWN MOVE WITH 1:10 RISK REWARD BTCUSD SHOWING A GOOD DOWN MOVE WITH 1:5 RISK REWARD
DUE TO THESE REASON
A. its following a rectangle pattern that stocked the market
which preventing the market to move any one direction now it trying to break the strong resistant lable
B. after the break of this rectangle it will boost the market potential for break
C. also its resisting from a strong neckline the neckline also got weeker ald the price is ready to break in the outer region
all of these reason are indicating the same thing its ready for breakout BREAKOUT trading are follws good risk reward
please dont use more than one percentage of your capitalfollow risk reward and tradeing rules
that will help you to to become a bettertrader
thank you

BTCUSD SHOWING A GOOD UP MOVE WITH 1:10 RISK REWARD BTCUSD SHOWING A GOOD
UP MOVE WITH 1:10 RISK REWARD
DUE TO THESE REASON
A. its following a rectangle pattern that stocked the market
which preventing the market to move any one direction now it trying to break the strong resistant lable
B. after the break of this rectangle it will boost the market potential for break
C. also its resisting from a strong neckline the neckline also got weeker ald the price is ready to break in the outer region
all of these reason are indicating the same thing its ready for breakout BREAKOUT trading are follws good risk reward
please dont use more than one percentage of your capitalfollow risk reward and tradeing rules
that will help you to to become a bettertrader
thank you

Bitcoin Monthly Candle Close Colours from 2011 - maybe RED March
The Odds were higher to get a GREEN February Close but we ended up closing RED
Of the previous 3 RED February closes, Everyone was followed by a RED MARCH
Those same previous RED February Candles were all preceded by a GREEN JAN
We have just had a GREEN January and a RED February and so, Odds are that March will also be RED.
But as we saw in the JANUARY post of this chart, the odds were for a GREEN Feb this year....so do not take this as a certainty. For March to close RED, we do not need to see a massive drop. Just 0.01 USDT below this Feb Close is enough
Also on a BEARISH side, the candles colours since October 2024 follow the sequence from pre 2013 ATH to just after, entering a bear
From Oct 2013 till Feb, Green Green Red Green Red- followed by March and April RED also.
From Oct 2024 till Feb, Green Green Red Green Red
On the BULLISH side, and this has a higher % chance of repeating, Of those 3 previous occasions were we had Green Jan then a Red Feb and a Red March, Two of those Three were entering a Bull run. 2012 and 2020
It should be Noted that those years were the years BEFORE Cycle TOP - We are currently IN the year of expected cycle TOP
Currently March is 6 Green - 7 Red monthly closes.
March is Currently GREEN at time of writing ( 1st March )
Of the previous 7 RED March, 5 were followed by a Green April
Of the 6 Green closes, 3 were followed by a Green April
Of those 6 Green March closes, only 2 really led on to further multi month gains.
In conclusion,
We are statistically more likely to get a RED March and that would put us in a better position to continue to reach a cycle ATH later in the year as the weekly MACD is still falling Bearish from High.
This will have cooled off PA and allowed it to range, possibly in a Wyckoff distribution model
A Red March also Gives us a better buying opportunity and MAYBE, MAYBE some time for ALTS to recover some o their losses......Maybe......
But it really should be remembered that we could also be entering a bear. More info is needed before this is seen clearly but caution is certainly something I will continue to talk about.
Stay safe and remain Cautious

BTCUSD SHOWING A GOOD DOWN MOVE WITH 1:5 RISK REWARD BTCUSD SHOWING A GOOD DOWN MOVE WITH 1:5 RISK REWARD
DUE TO THESE REASON
A. its following a rectangle pattern that stocked the market
which preventing the market to move any one direction now it trying to break the strong resistant lable
B. after the break of this rectangle it will boost the market potential for break
C. also its resisting from a strong neckline the neckline also got weeker ald the price is ready to break in the outer region
all of these reason are indicating the same thing its ready for breakout BREAKOUT trading are follws good risk reward
please dont use more than one percentage of your capitalfollow risk reward and tradeing rules
that will help you to to become a bettertrader
thank you

BTCUSD SHOWING A GOOD DOWN MOVE WITH 1:10 RISK REWARD BTCUSD SHOWING A GOOD DOWN MOVE WITH 1:10 RISK REWARD
DUE TO THESE REASON
A. its following a rectangle pattern that stocked the market
which preventing the market to move any one direction now it trying to break the strong resistant lable
B. after the break of this rectangle it will boost the market potential for break
C. also its resisting from a strong neckline the neckline also got weeker ald the price is ready to break in the outer region
all of these reason are indicating the same thing its ready for breakout BREAKOUT trading are follws good risk reward
please dont use more than one percentage of your capitalfollow risk reward and tradeing rules
that will help you to to become a bettertrader
thank you

Did BTC really Crash or just a Bullish move ? IT IS BULLISH MOVESo many people, including some "Experts" have called this Dip by BTC as a Crash, caused by inflation and / or the Fed
But it is NOT that at all, it is a perfect retest of resistance and here is why
I have posted this chart a number of times here and it still stands, when PA crosses over that lower Bold line. PA is en-route to ATH.
PA has been bouncing along this line for a number fo weeks, failing to break over and stay above
This chart, daily, was taken just a little while ago
And here we can clearly see that PA broke over that line of resistance and is now returning and tested it as support.
So far, we are holding above it
Should PA just range along this, we can see that Red 50 SMA coming in as support but this line we just crossed, if we can hold above...well.....It could be a Very nice christmas presant..
25 Dec....... You heard it here ;-)
Have a good one.
IF we loose support, there is plenty of support below...but have aplan incase.....always have a plan

BITCUSDENTRY TARGET SL Mention in the chart.
ALWAYS TAKE TRADE WITH CONFIRMATION
Note : Trading in any financial market is very risky. I post ideas for educational purpose only. It is not financial advice. Do not hold us responsible for any potential loss you may incur. Please consult your financial adviser before trading.

BTCUSD SHOWING A GOOD UP MOVE WITH 1:8 RISK REWARDBTCUSD SHOWING A GOOD
UP MOVE WITH 1:8 RISK REWARD
DUE TO THESE REASON
A. its following a rectangle pattern that stocked the market
which preventing the market to move any one direction now it trying to break the strong resistant lable
B. after the break of this rectangle it will boost the market potential for break
C. also its resisting from a strong neckline the neckline also got weeker ald the price is ready to break in the outer region
all of these reason are indicating the same thing its ready for breakout BREAKOUT trading are follws good risk reward
please dont use more than one percentage of your capitalfollow risk reward and tradeing rules
that will help you to to become a bettertrader
thank you

A decending triangle patterns showing on BITCOIN A decending triangle patterns showing on BITCOIN
A short term 15m tradeing setup showing on BITCOIN
Selling setup
With a risk reward ratio of 1:10
The setup giving clarity to selling because in longterm it's a Down TREND
Also in a pick top lable
And forming a DOWN setup
So according to the combine results of
15minit 1hour and daily chat
And the short term setup
All are of them indicating the same SELLING SETUP
Also cryptocurrencies are follows priseaction in a good way
Follow for more please don't use more than one percentage of your capital
Follows risk reward
Tradeing rules
And be deceplened
Try to be a better trader
Love you all❤️

BTCUSD SHOWING A GOOD UP MOVE WITH 1:6 RISK REWARDBTCUSD SHOWING A GOOD D
UP MOVE WITH 1:6 RISK REWARD
DUE TO THESE REASON
A. its following a rectangle pattern that stocked the market
which preventing the market to move any one direction now it trying to break the strong resistant lable
B. after the break of this rectangle it will boost the market potential for break
C. also its resisting from a strong neckline the neckline also got weeker ald the price is ready to break in the outer region
all of these reason are indicating the same thing its ready for breakout BREAKOUT trading are follws good risk reward
please dont use more than one percentage of your capitalfollow risk reward and tradeing rules
that will help you to to become a bettertrader
thank you

BTCUSDT: Brewing a Bullish Breakout?BTCUSDT is setting the stage for a potential breakout with a classic rounding bottom pattern on the weekly timeframe. Since March, the pair has been consolidating and recently a significant sell-off is seen from the 70,000 level. This price action suggests the formation of a handle, which often precedes a bullish breakout.
Key Levels to Watch:
Immediate Support: 50,580
Immediate Resistance: 68,250
If BTCUSDT inches toward completing this pattern, traders should monitor for breakouts beyond these key support and resistance levels. This setup could lead to a significant surge in momentum, so stay alert for any sudden moves!
Disclaimer:
This analysis is for informational purposes only and should not be considered as financial advice. Trading cryptocurrencies involves significant risk and may not be suitable for all investors. Always do your own research and consult with a financial advisor before making any trading decisions.

BTC buy on pullback[Medium Term]BTC is still bearish in monthly chart, but it's bullish on medium term chart which is weekly time frame.
Now, plan will be buying on every pullback.
Waiting until not got desired price.

BTC HOVERING IN MAKE OR BREAK RANGEAfter the accumulation phase, there not much volume participation and distribution phase has begun.
Marked Range of ( 25 to 32 K) is make or break range.

BTCUSDT Today ForecastBTCUSDT Today Forecast
IMO
Give a Like and Feel free to share your opinions in the comment!
Happy Trading 😊

BTCUSDT Today ForecastBTCUSDT Today Forecast
IMO
Give a Like and Feel free to share your opinions in the comment!
Happy Trading 😊

BTCUSDT Today ForecastBTCUSDT Today Forecast
IMO
Give a Like and Feel free to share your opinions in the comment!
Happy Trading 😊

BTCUSDT Today ForecastBTCUSDT Today Forecast
IMO
Give a Like and Feel free to share your opinions in the comment!
Happy Trading 😊
