BTCUSDAs price has rejected from green dashed line, so we will take it as a resistance
So If any 15 min candle close above that green dashed line, then chances are high it could test above dashed line resistance at 91320 and even beyond that level.
Disclaimer :
It's a personal view not a financial advice and I assume no responsibility and liability whatever outcome arises.
Btcusdtrading

BTC 3H Market Structure Breakdown – Bearish Target at 85,300”BTCUSD 3H Chart Analysis
1. Structure & Trend
Price is moving inside a rising channel (blue trendlines).
But the upper zone contains a Bearish Order Block (OB) between 94,614 – 96,882, causing repeated rejections → bearish reaction zone.
✅ 2. Current Market Behavior
Price has formed a red consolidation box near the top of the channel → indicates distribution.
The market rejected strongly from the OB and is failing to break above the resistance.
This suggests downside momentum is building.
✅ 3. Key Levels
Bearish OB Resistance
94,614 – 96,882
Support Target
85,314.98 (marked as Target Point)
This matches a 9.7% drop projection shown on the chart.
✅ 4. Strategy Breakdown
A) Smart Money Concepts (SMC)
Price tapped into Bearish Order Block → expecting sell-side reaction.
Liquidity above recent highs has already been taken → likely move downward toward sell-side liquidity below.
B) Price Action
Series of lower highs forming inside the red box.
Weak bullish momentum after rejection.
Possible breaker structure forming.
C) Trendline & Channel Strategy
Price may retrace down to the bottom of the rising channel, which aligns with the 85,300 target.
D) Volume & Momentum
(Not shown visually, but interpretation)
Rejection candles show strong selling pressure near the OB zone.
✅ 5. Probable Move (Based on Chart Plan)
📉 Expected scenario:
A breakdown from the consolidation box → fall toward 85,314 support (channel bottom + target zone).
📈 Bullish invalidation:
A breakout above 96,882 would invalidate the bearish setup and open room for new highs.
📌 Conclusion
The chart shows a bearish setup from a high-timeframe order block with a clear downward projection. All strategies—SMC, price action, channel trading, and liquidity concepts—point toward a potential drop to 85.3k if the red box structure breaks down. BINANCE:ETHUSDT BINANCE:DOGEUSDT BINANCE:XRPUSDT BINANCE:XRPUSDT BINANCE:SUIUSDT BINANCE:LINKUSDT CRYPTOCAP:TOTAL BINANCE:BNBUSDT BINANCE:SOLUSDT BINANCE:FARTCOINUSDT.P BINANCE:ZECUSDT

BTCUSD SHOWING A GOOD UP MOVE WITH 1:10 RISK REWARD BTCUSD SHOWING A GOOD UP MOVE WITH 1:10 RISK REWARD
DUE TO THESE REASON
A. its following a rectangle pattern that stocked the market
which preventing the market to move any one direction now it trying to break the strong resistant lable
B. after the break of this rectangle it will boost the market potential for break
C. also its resisting from a strong neckline the neckline also got weeker ald the price is ready to break in the outer region
all of these reason are indicating the same thing its ready for breakout BREAKOUT trading are follws good risk reward
please dont use more than one percentage of your capitalfollow risk reward and tradeing rules
that will help you to to become a bettertrader
thank you

BTCUSD SHOWING A GOOD UP MOVE WITH 1:10 RISK REWARD BTCUSD SHOWING A GOOD
UP MOVE WITH 1:10 RISK REWARD
DUE TO THESE REASON
A. its following a rectangle pattern that stocked the market
which preventing the market to move any one direction now it trying to break the strong resistant lable
B. after the break of this rectangle it will boost the market potential for break
C. also its resisting from a strong neckline the neckline also got weeker ald the price is ready to break in the outer region
all of these reason are indicating the same thing its ready for breakout BREAKOUT trading are follws good risk reward
please dont use more than one percentage of your capitalfollow risk reward and tradeing rules
that will help you to to become a bettertrader
thank you

BTC/USD 15/09/2025: Bullish Potential Pre-Fed DecisionMarket Overview: Steady with Huge Potential
Bitcoin remains the king of crypto with a market cap of 2.31 trillion USD, dominating the space. The 24-hour trading volume is at 33.29 billion USD (+4.72%), showing decent buying interest but not enough for a massive rally yet. With only 19.92 million BTC circulating (94.86% of the 21 million total supply), there’s low inflationary pressure, which is great for long-term value. Can BTC keep its 92.27% yearly gain? Drop your thoughts in the comments below! 📊
Technical Analysis: Double Bottom and Bullish Channel Looking Hot
Support & Resistance: Strong support at 114,000 - 115,000 USD (holding since early September). Resistance is at 116,000 - 116,500 USD—break this, and we could see 120,000 USD next! If it fails, expect a retest of 114,000 USD. Watch for a breakout, traders! ⚠️
Trend: The chart shows a double bottom pattern from September’s low, with the bullish channel still intact. The Fear & Greed Index is at 53-55 (Neutral), meaning no one’s panicking or getting too excited. RSI is neutral, MACD is slightly soft, but the daily timeframe screams “Buy”! 📉
Macro News & Triggers: Fed Decision to Steal the Show?
The market is glued to the Fed’s expected 0.25% rate cut this week—if it happens, risk assets like Bitcoin could see a flood of cash! 🌊 On the bullish side: Billionaire Tim Draper is pushing for BTC adoption, predicting 250,000 USD by December 2025, and Capital Group turned a 1 billion USD investment into 6 billion USD profits. But watch out for whale selling and weak altcoins (like SHIB, down 3.22%)—they could drag BTC lower. Ready for some volatility? 🔥
Forecast & Trading Strategy: Your Game Plan
Short-Term (1-7 Days): BTC likely to trade between 114,000 - 117,000 USD, with the Fed as the big trigger. A rate cut could push it to test 120,000 USD; if not, it might dip to 114,000 USD. There’s a 60% chance of an upside if it holds above 115,000 USD—perfect for a long trade! 📈
Long-Term (2025-2030): Super bullish! Changelly predicts 116,220 USD today, rising to 117,978 USD tomorrow; Investing Haven sees stability around 116,087 USD. With the last halving and institutional buying, BTC could smash past 200,000 USD by year-end. But diversify your portfolio to stay safe! 💡
Fellow traders, it’s time to make your move! Keep the BTC/USD chart open on TradingView and share your predictions in the comments. Do your own research (DYOR) and trade smart! 🙌
#Bitcoin #BTCUSD #CryptoAnalysis #TradingView #FedRateCut #BullishBTC #Crypto2025 #Altcoins #WhaleWatch #FearAndGreed

BTC/USD Bullish Order Block Setup – Targeting 114,328BTC/USD (1H) Analysis
Trend & Structure: Price has been respecting a rising channel with clear support and rejection lines. After testing the support line, it rebounded and is now consolidating.
EMA Strategy: Price is fluctuating around the 70 EMA (111,081) and 200 EMA (110,902), showing short-term consolidation. A bullish crossover above 70 EMA may confirm further upside momentum.
Order Block (OB) Zone: The marked OB Buying Zone (109,261 – 110,252) is a strong demand area where buyers are expected to step in.
Support & Resistance: Support lies at 109,261, while the next resistance/target is 114,328.
Risk-Reward Strategy: A potential long entry from the OB zone offers a favorable R:R ratio toward the 114,328 target point. Stop loss ideally below 109,246.
Price Action: Recent wicks suggest rejection of lower levels, strengthening the bullish bias.
✅ Signal: Buy from OB Buying Zone (109,261 – 110,252)
🎯 Target: 114,328
🛑 Stop Loss: Below 109,246
Overall Bias: Bullish continuation if price respects the OB buying zone and EMA support.

BTC/USD – FVG Buy Zone Setup Targeting $113K🔎 Chart Overview (BTC/USD 30m)
Price is currently trading at $110,517.
EMA 70 (111,276) above price → short-term bearish.
EMA 200 (110,598) acting as immediate support zone.
📐 Trend & Channel Strategy
Market is moving inside an ascending channel (support & projection line).
Price recently retraced to the support line → potential bullish continuation.
🎯 Supply & Demand / FVG Strategy
FVG Buying Zone: $109,583 – $110,217 highlighted (strong demand zone).
Entry around this zone expected to trigger a bullish reaction.
📊 EMA Crossover Strategy
EMA70 > EMA200 previously → bullish structure.
Current retest of EMA200 is key → holding above signals continuation to upside.
💎 Price Action Strategy
After strong drop, price tapped into support + FVG zone.
Wick rejection suggests buyers stepping in.
🎯 Target & Risk Management
Target Point: $113,053 – $113,064.
Stop Loss: Below $109,583 (to protect against breakdown).
Risk/Reward ratio looks favorable (approx. 1:3).
✅ Conclusion:
BTC is in an uptrend channel. After retesting the FVG buying zone & EMA200, buyers are likely to push price back toward $113,000 target 🚀📈. A break below $109,583 would invalidate this bullish setup.

BTC/USD Supply Zone Rejection SetupThis BTC/USD 30-min chart shows price climbing within a rising channel toward a POI Supply Zone (114,201 – 114,940 USD). The market is respecting both the support line and rejection line while trading above the EMA 70 (111,733) and EMA 200 (112,102), indicating bullish momentum in the short term.
Key Analysis Using Strategies:
Trend/EMA Strategy: Price is above both EMAs, signaling bullish continuation until the supply zone.
Channel Strategy: Price is moving inside an ascending channel; upper channel resistance aligns with the supply zone, suggesting potential reversal.
Supply & Demand: Strong supply zone at 114,201–114,940 is the key resistance area to watch for rejection.
Price Action: After breakout from EMA and minor consolidation, price shows bullish structure with higher highs and lows.
Risk Management: Possible short entry at supply zone (114,201–114,940) with stop-loss above 114,940, and targets near 112,100 and 109,000.
📌 Summary: Short-term bullish toward supply zone, but a potential bearish reversal setup forms at 114,201–114,940 if rejection occurs, with downside targets around 112,100 → 109,000.

BTC/USD Bearish Retest Setup – Eye on 106.6K TargetTrend: BTC is in a downtrend channel (rejection line above, support line below).
EMA Signals: Price is trading below EMA 70 & EMA 200 → bearish bias remains strong.
Supply & Demand:
Support zone: around 112,000 – 112,500 (price just bounced).
RBR Supply zone: 114,300 – 116,000 where sellers are likely waiting.
📊 Strategies in play
Support–Resistance: Bounce at support, retest expected at supply zone.
EMA Strategy: Bearish since candles trade under 200 EMA.
Break & Retest: Price could retest supply before resuming drop.
Target Projection: If rejection at supply holds, target = 106,600 zone (chart target point).
⚖️ Risks
A clean break above 116,000 would invalidate bearish setup and open room for reversal.
Range trading possible between 112k–116k before breakout.
✅ Summary: BTC short-term bias remains bearish. Expect retest of 114.3k–116k supply before continuation lower toward 106.6k target. Only a strong breakout above 116k flips the trend bullish.

USD Index (DXY) Bullish Reversal & Breakout PotentialUSD Index (DXY) Bullish Reversal & Breakout Potential 🚀
The DXY chart displays a strong bullish reversal structure from the support zone near the 99,800–100,200 area. Here’s a professional breakdown of the technical setup:
🔍 Key Observations:
🟢 Bullish Reversal Formation
The price rebounded aggressively from a strong demand zone (support), marked by a green arrow and orange highlight.
Multiple historical reaction zones confirm this level's validity as a reliable support.
📉 Previous Decline & Correction
After reaching the resistance area near 110.400, the price corrected with a bearish channel.
This pullback formed a classic bull flag, a bullish continuation pattern, eventually leading to the current breakout.
🟦 Current Price Action
The market has broken out of the recent downtrend and is forming higher highs and higher lows.
A strong bullish impulse candle confirms renewed buying interest.
🧱 Support & Resistance Levels:
🔵 Resistance Zone (Target): 110.409 — a historically respected area and target for the bullish move.
🟣 Current Support Zone: 105.061 — previously resistance, now likely to act as support after the breakout.
🎯 Bullish Target Projection
If price retests and holds the support at 105.061, the next potential leg can extend towards 110.409, offering a strong risk-to-reward setup.
⚠️ Caution
Watch for a pullback and retest near the support level.
A failure to hold above 105.061 could invalidate the bullish structure.
🧠 Conclusion
The DXY is showing a bullish trend continuation after a breakout from a corrective structure. A successful retest of support could propel price towards the 110.400 target zone 📊.
Bias: ✅ Bullish above 105.061
Invalidation: ❌ Below 105.000

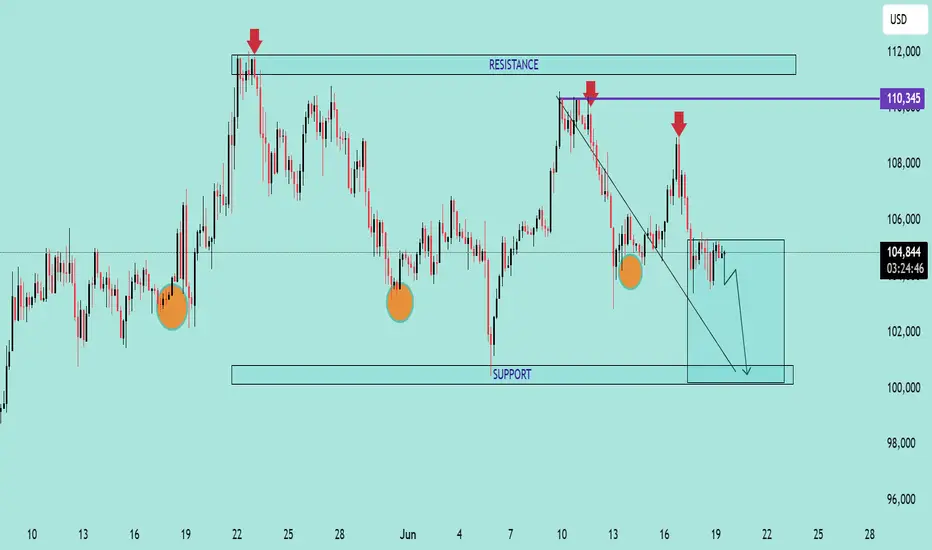
BTC/USD Bearish Outlook Analysis BTC/USD Bearish Outlook Analysis 📉🧠
📊 Technical Overview:
The BTC/USD chart is showing signs of a bearish structure formation, suggesting increased downside momentum in the short term.
🔻 Resistance Zone:
Clear resistance is identified near $110,345, marked by multiple price rejections (🔴 red arrows).
Price failed to break above this zone several times, indicating strong selling pressure.
🔸 Support Zone:
Strong support lies near the $100,000 psychological level.
Price has respected this zone multiple times (🟠 orange circles), indicating buyer interest.
📉 Current Price Action:
A descending trendline breakout attempt failed and price is now consolidating just below $105,000.
Price is forming a bearish flag/consolidation structure after recent rejection.
A breakdown from the current box range is likely to push BTC toward the support zone at $100,000.
📉 Bearish Scenario:
If BTC breaks below $104,000, expect continuation towards $100,000.
A daily candle close below support could signal further downside.
📈 Invalidation:
Bullish invalidation occurs if BTC reclaims and closes above $108,000, with volume, retesting resistance at $110,345.
🧭 Summary:
BTC/USD is exhibiting a lower highs structure within a descending channel. Unless it breaks above the resistance zone, the bias remains bearish with a high probability of retesting support.
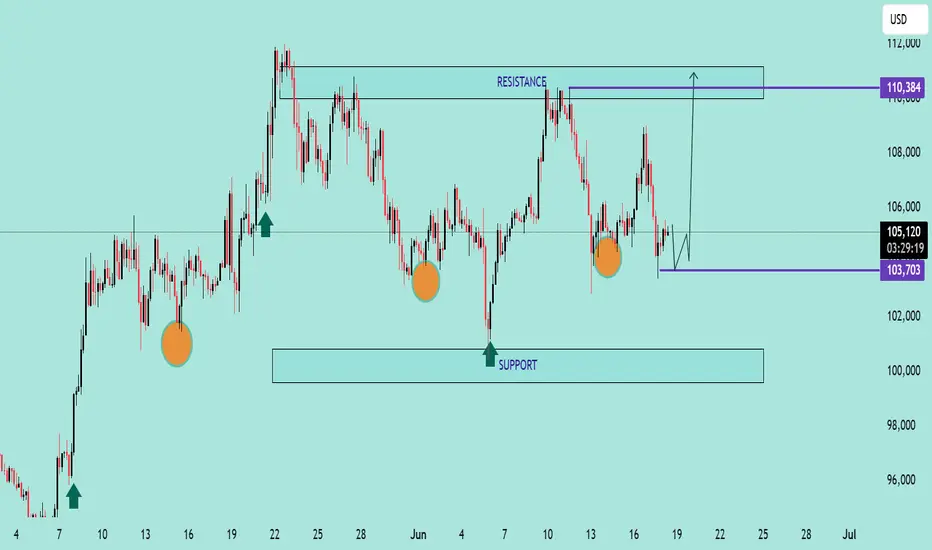
BTC/USD Potential Bullish ReversalBTC/USD Potential Bullish Reversal 🟢📈
🔍 Technical Overview:
The chart shows a potential bullish reversal pattern forming near a key support zone. Price action has consistently bounced from the support range between $100,000 – $103,700, marked by multiple higher lows (🟠 orange circles), suggesting strong buyer interest.
📌 Key Levels:
Support Zone: $100,000 – $103,700 🛡️
Immediate Resistance: $110,384 🔼
Current Price: $105,202 💰
📊 Pattern Observed:
The price structure shows a possible inverted head and shoulders pattern forming, with the right shoulder currently developing. If this structure completes and breaks the $106,000–$107,000 neckline region, we can expect a bullish breakout toward the resistance target of $110,384 or higher.
📈 Bullish Confirmation:
Bullish rejection from support area ✅
Clean structure with repeated higher lows 📈
Potential breakout arrow suggests move toward the top resistance zone
⚠️ Watch For:
Price must hold above $103,700 to maintain bullish bias
Break below this level may invalidate bullish setup and retest the broader support zone near $100,000
📌 Conclusion:
BTC/USD is setting up for a potential upside breakout if the neckline is broken. Traders should monitor for bullish confirmation before entering long positions.
🔔 Strategy Suggestion:
Buy Zone: $103,700 – $104,500 (on bullish confirmation) 🛒
Target Zone: $110,000 – $111,000 🎯
Stop-Loss: Below $103,000 🛑
Bitcoin (BTC/USD) 1H Chart Analysis – Double Top Signals BearishPattern Formed: DOUBLE TOP
⚠️ Bearish Reversal Pattern Spotted!
📍 Formed near 111,794.8
⬆️ Price tested the top twice and failed – strong resistance confirmed!
Key Zones:
🔶 SUPPLY ZONE (Resistance):
🟧 111,794.8 - 111,829.8
🔼 Expect selling pressure here!
🔷 SUPPORT Zone (Broken!):
🔻 Price fell below this level, confirming a bearish breakout
🟩 TARGET ZONE:
🎯 102,500.0
✅ This is the likely drop target based on the pattern
🧊 Other minor supports:
* 102,820.6
* 102,750.8
* 102,227.0.
Indicators:
📈 Trend Line
* Supported the price during the uptrend
* ❌ Now broken — indicates momentum shift
📉 EMA 70 (Red Line)
* Current Price (108,238.6) is below EMA 70 = 109,245.0
* Indicates bearish pressure.
Trade Setup:
🔽 Short Entry Idea: After support break
🛑 Stop Loss: 111,829.8
🎯 Take Profit: 102,500.0
⚖️ Risk-Reward looks attractive!
Summary:
📉 Bearish bias confirmed by:
* Double Top pattern
* Supply zone rejection
* Support break
* EMA crossover
🚨 Traders Watch Out: Bears are in control — next major stop likely at 102,500.0!

BTCUSD SHOWING A GOOD UP MOVE WITH 1:10 RISK REWARD BTCUSD SHOWING A GOOD
UP MOVE WITH 1:10 RISK REWARD
DUE TO THESE REASON
A. its following a rectangle pattern that stocked the market
which preventing the market to move any one direction now it trying to break the strong resistant lable
B. after the break of this rectangle it will boost the market potential for break
C. also its resisting from a strong neckline the neckline also got weeker ald the price is ready to break in the outer region
all of these reason are indicating the same thing its ready for breakout BREAKOUT trading are follws good risk reward
please dont use more than one percentage of your capitalfollow risk reward and tradeing rules
that will help you to to become a bettertrader
thank you
BITCOIN MAY DROP TO 74K - BEARISH STRUCTURE INTACTSymbol - BTCUSD
CMP - 84600
BTCUSD is undergoing a shift in market structure, transitioning into a bearish phase following the breakdown at 90K. A deeper correction is currently developing, which, in my view, represents a logical and technically sound progression for a healthy market. It is concerning when the market only experiences upward movement driven solely by buying pressure, such as in the case of large-scale injections of funds into high-yield investment programs (HYIPs).
A correction in Bitcoin’s price or even a trend reversal could inject vitality back into the market. From a fundamental perspective, traders have not seen the expected active support for cryptocurrencies from the US, which was previously suggested during Trump's election campaign. Additionally, issues such as crypto exchange hacks, fraudulent coins, and Bitcoin's dominance are exerting negative pressure on altcoins.
Bitcoin’s current downturn, with the possibility of a further drop to the 75K-73K range, could present an opportunity for fundamentally strong altcoins, assuming the declining Bitcoin dominance index also continues to trend downward. The simultaneous reallocation of funds from Bitcoin to altcoins, along with a rebound in Bitcoin from a strong support level, could rejuvenate the prospects for an altcoin season.
Resistance levels: 88150, 90700
Support levels: 75000, 73570, 66830
A modest retracement towards the 88100 to 90700 range is possible before the price begins its descent. While Bitcoin may attempt a deeper pullback, the current market imbalance, coupled with the absence of a clear driving force or supportive factors, suggests that the price may continue to fall in the medium term, potentially reaching the liquidity zone between 75K and 73K

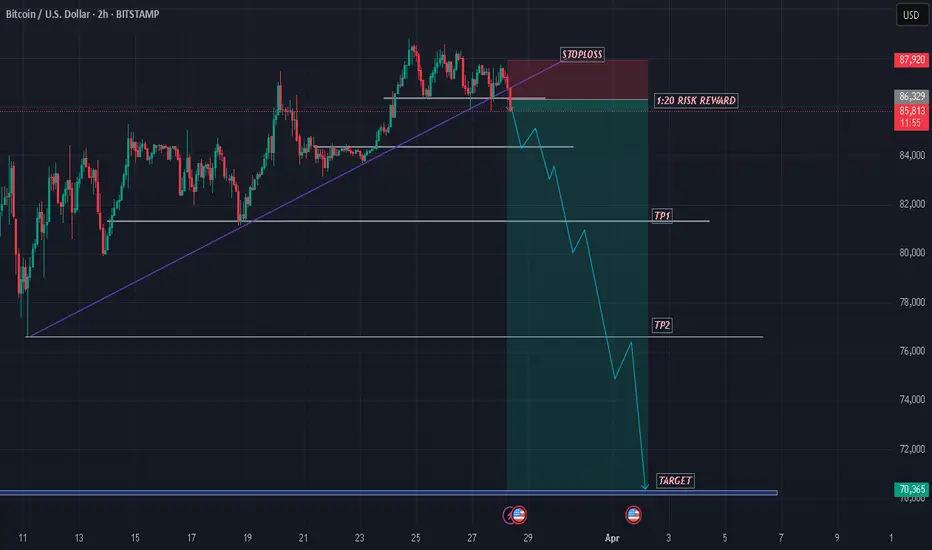
BTCUSD SHOWING A GOOD DOWN MOVE WITH 1:20 RISK REWARD BTCUSD SHOWING A GOOD DOWN MOVE WITH 1:20 RISK REWARD
DUE TO THESE REASON
A. its following a rectangle pattern that stocked the market
which preventing the market to move any one direction now it trying to break the strong resistant lable
B. after the break of this rectangle it will boost the market potential for break
C. also its resisting from a strong neckline the neckline also got weeker ald the price is ready to break in the outer region
all of these reason are indicating the same thing its ready for breakout BREAKOUT trading are follws good risk reward
please dont use more than one percentage of your capitalfollow risk reward and tradeing rules
that will help you to to become a bettertrader
thank you
BTCUSDT TRADING POINT UPDATE > READ THE CHAPTIANBuddy'S dear friend
SMC Trading Signals Update 🗾🗺️ crypto Traders SMC-Trading Point update you on New technical analysis setup for crypto BTC USDT. ) list time post signals 💯 reached target point ) 👉 New technical analysis setup BTC USDT looking for bullish trend 📈 FVG level support level. 83k 82k support level 87k 88k resistance level ). Guys 🤝 good luck 💯💯
Key Resistance level 87k + 88k
Key Support level 83k - 82kà
Mr SMC Trading point
Pales support boost 🚀 analysis follow)

BITCOIN - THE FALL CONTINUESSymbol - BTCUSDT
CMP - 86200
Bitcoin is currently in a sell zone. Despite Trump's comments on the Federal Reserve and the recent Crypto Summit, these events have not had a substantial impact on the cryptocurrency market, aside from triggering a global disruption and liquidation.
So far, the market has failed to exhibit a clear bullish catalyst. Trump's statements regarding the policies related to tariffs led to a global shakeup, resulting in market liquidation. Additionally, the Crypto Summit held yesterday was unable to reverse the negative momentum, preventing the market from entering a positive phase.
From a technical perspective, global growth has temporarily stalled, and Bitcoin is now entering a significant correction phase, with 73K remaining the primary target. The market is in dire need of liquidity, as sustainable growth cannot be achieved at the expense of buyers or solely through perpetual bullish leverage.
Currently, the price is moving within a range of 90K to 82K after exiting the global consolidation phase. A false break above the 91K resistance, which had served as support during the consolidation, has resulted in a decline, potentially continuing to the 82K and 73K levels.
Resistance Levels: 89400, 91000, 93000
Support Levels: 82000, 78000, 73000
The critical liquidity zone lies between 73K and 66K. The price action suggests a false break of resistance, with an imbalance of forces favoring the bears. As such, the first potential stop is likely to be around the 82K range, marking the lower boundary of the current range. Moving forward, it is essential to observe the market's reaction to this support level. Should the market consolidate, break down, and then consolidate further below 82K, this could signal a deeper decline toward lower targets.
Despite the favorable fundamental backdrop created by US politicians, who hold considerable influence over the cryptocurrency market, the price continues to fall.

BTCUSDT TRADING POINT UPDATE >READ THE CHPTAIN SMC Trading Signals Update 🗾🗺️ crypto Traders SMC-Trading Point update you on New technical analysis setup for crypto BTC USDT. ) crypto Traders BTC USD ) list time post signals 🚀 Hit sucksfully My target point ) Now update on New analysis setup. BTC USDT still drop 💧. Trend 📉. Technical patterns FVG) 85k. Back down trand target point 78k.
Key Resistance level 85k
Key Support level 81k- 78k
Mr SMC Trading point
Pales support boost 🚀 analysis follow)

BTCUSD SHOWING A GOOD DOWN MOVE WITH 1:10 RISK REWARD BTCUSD SHOWING A GOOD DOWN MOVE WITH 1:10 RISK REWARD
DUE TO THESE REASON
A. its following a rectangle pattern that stocked the market
which preventing the market to move any one direction now it trying to break the strong resistant lable
B. after the break of this rectangle it will boost the market potential for break
C. also its resisting from a strong neckline the neckline also got weeker ald the price is ready to break in the outer region
all of these reason are indicating the same thing its ready for breakout BREAKOUT trading are follws good risk reward
please dont use more than one percentage of your capitalfollow risk reward and tradeing rules
that will help you to to become a bettertrader
thank you

BITCOIN IS HEADED TO 90K?Symbol - BTCUSD
BTCUSD is reflecting a shift in market sentiment, with its current price action indicating a potential continuation of the ongoing correction. BTCUSD is currently trading within a falling channel pattern, with global market consolidation providing the broader context. There is a possibility of another retest of the 90,000 risk zone. On the medium-term timeframe, Bitcoin has failed to maintain its position near its all-time high, entering the local selling zone below the 99,800 level, and is now within the upper consolidation range. This shift is accompanied by a noticeable negative sentiment within the cryptocurrency market. Altcoins continue to experience persistent declines without any signs of recovery, further highlighting the lack of positive prospects. At this stage, Bitcoin appears to be reacting to the lack of fulfillment of promises from President Trump, as well as ongoing market manipulation and geopolitical tensions. These factors are contributing to the market’s protracted correction phase. New coins created ahead of the U.S. election have siphoned liquidity from the market, adding to the bearish sentiment. This situation, combined with a global trade conflict, has led to a significant market downturn.
Support levels: 95,800, - 91,300, - 90,000
Resistance levels: 1,00,300 - 1,02,670
Technically, Bitcoin may continue its downward movement, potentially testing the 90,000 support level again. As the price approaches this level, the risks surrounding it will increase. Currently, the asset is in a consolidation phase between 95,800 and 1,00,300 which could precede a breakdown and further decline towards 90,000. However, considering Bitcoin’s sensitivity to U.S. political actions, there may be a temporary rise towards the 1,00,300 level before the asset resumes its decline. The likelihood of the price testing the 95,800 level for a breakdown and subsequent fall remains high. However, on a broader scale, the asset still maintains a bullish outlook, with strong support placed in the 90K-91K zone.

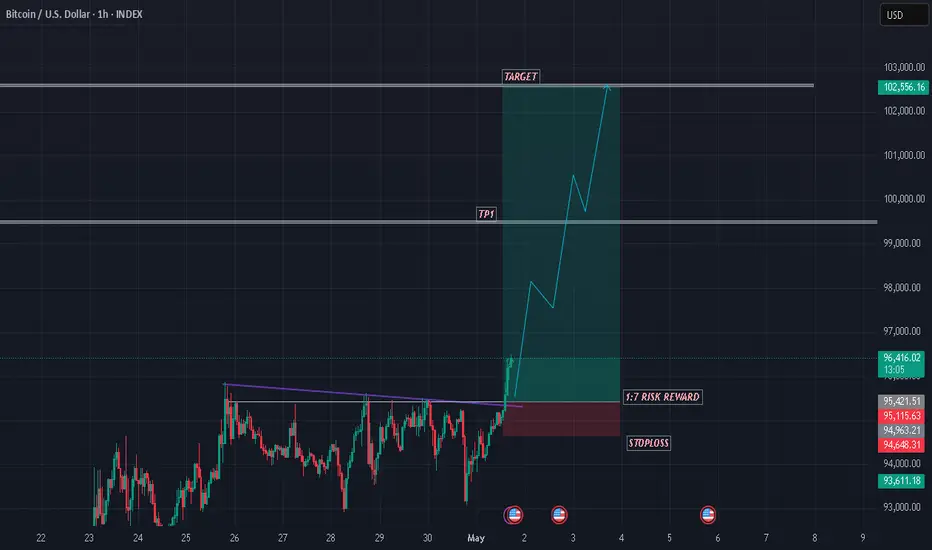
BTCUSD SHOWING A GOOD UP MOVE WITH 1:7 RISK REWARD BTCUSD SHOWING A GOOD UP MOVE WITH 1:7 RISK REWARD
DUE TO THESE REASON
A. its following a rectangle pattern that stocked the market
which preventing the market to move any one direction now it trying to break the strong resistant lable
B. after the break of this rectangle it will boost the market potential for break
C. also its resisting from a strong neckline the neckline also got weeker ald the price is ready to break in the outer region
all of these reason are indicating the same thing its ready for breakout BREAKOUT trading are follws good risk reward
please dont use more than one percentage of your capitalfollow risk reward and tradeing rules
that will help you to to become a bettertrader
thank you

BTCUSDENTRY TARGET SL Mention in the chart.
ALWAYS TAKE TRADE WITH CONFIRMATION
Note : Trading in any financial market is very risky. I post ideas for educational purpose only. It is not financial advice. Do not hold us responsible for any potential loss you may incur. Please consult your financial adviser before trading.
