BTC 3H Market Structure Breakdown – Bearish Target at 85,300”BTCUSD 3H Chart Analysis
1. Structure & Trend
Price is moving inside a rising channel (blue trendlines).
But the upper zone contains a Bearish Order Block (OB) between 94,614 – 96,882, causing repeated rejections → bearish reaction zone.
✅ 2. Current Market Behavior
Price has formed a red consolidation box near the top of the channel → indicates distribution.
The market rejected strongly from the OB and is failing to break above the resistance.
This suggests downside momentum is building.
✅ 3. Key Levels
Bearish OB Resistance
94,614 – 96,882
Support Target
85,314.98 (marked as Target Point)
This matches a 9.7% drop projection shown on the chart.
✅ 4. Strategy Breakdown
A) Smart Money Concepts (SMC)
Price tapped into Bearish Order Block → expecting sell-side reaction.
Liquidity above recent highs has already been taken → likely move downward toward sell-side liquidity below.
B) Price Action
Series of lower highs forming inside the red box.
Weak bullish momentum after rejection.
Possible breaker structure forming.
C) Trendline & Channel Strategy
Price may retrace down to the bottom of the rising channel, which aligns with the 85,300 target.
D) Volume & Momentum
(Not shown visually, but interpretation)
Rejection candles show strong selling pressure near the OB zone.
✅ 5. Probable Move (Based on Chart Plan)
📉 Expected scenario:
A breakdown from the consolidation box → fall toward 85,314 support (channel bottom + target zone).
📈 Bullish invalidation:
A breakout above 96,882 would invalidate the bearish setup and open room for new highs.
📌 Conclusion
The chart shows a bearish setup from a high-timeframe order block with a clear downward projection. All strategies—SMC, price action, channel trading, and liquidity concepts—point toward a potential drop to 85.3k if the red box structure breaks down. BINANCE:ETHUSDT BINANCE:DOGEUSDT BINANCE:XRPUSDT BINANCE:XRPUSDT BINANCE:SUIUSDT BINANCE:LINKUSDT CRYPTOCAP:TOTAL BINANCE:BNBUSDT BINANCE:SOLUSDT BINANCE:FARTCOINUSDT.P BINANCE:ZECUSDT
Btcusdupdate

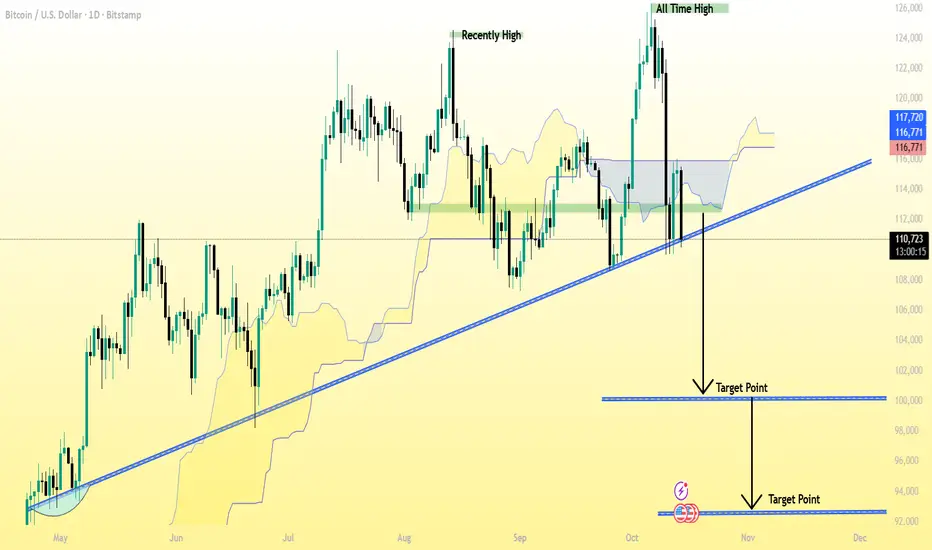
BTC/USD (Bitcoin) 1D (Daily) chart Pattern.BTC/USD (Bitcoin) 1D (Daily) chart 👇
✅ Current Price: around $110,685
✅ Trend: Bearish breakdown — price has clearly broken below the long-term ascending trendline.
✅ Market structure: After rejecting near $117,000, BTC dropped below both the Ichimoku cloud and the trendline — confirming downside pressure.
---
🎯 Target Levels (Downside)
1. Primary Target: $100,000 – $98,000
This matches my first marked “Target Point”.
It’s a strong historical support zone and aligns with previous price consolidation.
2. Extended / Final Target: $94,000 – $92,000
This is the second target point shown on my chart.
It would be the next major support if BTC continues falling after $98,000 breaks.
---
🛡 Resistance / Stop-Loss
Immediate resistance: $113,000 – $114,000 (broken trendline retest zone).
Stop-loss for short trades: above $115,000 – $116,000 (invalidates bearish setup).
---
🔍 Summary
Trend bias: Bearish (break of trendline + below cloud)
Sell zone: $111,000 – $113,000
Target 1: $100,000 – $98,000
Target 2: $94,000 – $93,000
Stop-loss: above $115,000
BTC/USD Bullish Order Block Setup – Targeting 114,328BTC/USD (1H) Analysis
Trend & Structure: Price has been respecting a rising channel with clear support and rejection lines. After testing the support line, it rebounded and is now consolidating.
EMA Strategy: Price is fluctuating around the 70 EMA (111,081) and 200 EMA (110,902), showing short-term consolidation. A bullish crossover above 70 EMA may confirm further upside momentum.
Order Block (OB) Zone: The marked OB Buying Zone (109,261 – 110,252) is a strong demand area where buyers are expected to step in.
Support & Resistance: Support lies at 109,261, while the next resistance/target is 114,328.
Risk-Reward Strategy: A potential long entry from the OB zone offers a favorable R:R ratio toward the 114,328 target point. Stop loss ideally below 109,246.
Price Action: Recent wicks suggest rejection of lower levels, strengthening the bullish bias.
✅ Signal: Buy from OB Buying Zone (109,261 – 110,252)
🎯 Target: 114,328
🛑 Stop Loss: Below 109,246
Overall Bias: Bullish continuation if price respects the OB buying zone and EMA support.
