MCX NSE/BSE(STOCK) EQUITY, GREAT BUYING OPPROTUNITY."a great dip occurred, and i have been waiting eagerly to buy at this price following the stock split. this is an excellent opportunity to purchase and target a sale price between 3,000 and 3,110. if you are a long-term buyer, you can hold for three to four years and potentially see your investment double, triple, or even quadruple in value. keep an eye on gold, silver, and other metal trading trends."
Budget

Take Liquidity or Become Liquidity In this video I am talking about a Solid concept / strategy know as Liquidity .
General trends of the markets in terms of index are discussed in this videos and no bias or directions are given

Budget 2026 Highlights: Nifty - 400 Points During Budget 2026🇮🇳 Union Budget 2026 Highlights – Key Takeaways for India’s Growth Story
The Union Budget 2026 sets the tone for India’s next phase of growth, balancing infrastructure push, manufacturing, healthcare, and fiscal discipline. Here are the top highlights you should know 👇
🏥 Healthcare Gets a Historic Boost
✨ ₹1.05 lakh crore allocated to healthcare — crossing ₹1 lakh crore for the first time ever!
🌍 Plan to develop 5 medical tourism hubs with major private hospital chains like Apollo, Fortis, Max, Dr Lal Pathlabs, and Metropolis.
👉 Signals India’s ambition to become a global medical hub.
💰 Income Tax – No Changes
📌 No change in income tax slabs
📌 Existing structure continues for AY 2026–27
📌 Tax-free income up to ₹12 lakh (via rebates) remains
👉 Stable tax regime = predictability for taxpayers.
📈 Capital Expenditure Push
🚧 Capex increased 9% to ₹12.2 lakh crore
⚙️ Focus on heavy machinery, mining, and manufacturing equipment
📦 Goal: Reduce import dependence
👉 Strong long-term growth signal.
🛡️ Defence Allocation
💣 ₹5.95 lakh crore for defence
🔬 Focus on research, land, and equipment
👉 Boost for defence manufacturing & technology.
☀️ Renewable Energy Focus
🌞 ₹1,775 crore for solar power (grid)
📈 Up from ₹1,500 crore last year
👉 Reinforces India’s green energy transition.
💻 IT Sector Relief
🧾 Safe Harbour threshold raised from ₹300 crore to ₹2,000 crore
📉 Lower tax disputes & simplified compliance
👉 Big positive for mid-to-large IT firms.
🧪 Biopharma Push
💊 ₹10,000 crore under Biopharma Shakti (5 years)
🧬 Focus on biologics & biosimilars
👉 Boost for pharma innovation and domestic production.
🏭 Manufacturing & Semiconductors
🔌 Semiconductor Mission 2.0 announced
📦 Electronics component scheme scaled to ₹40,000 crore
🧠 Focus on R&D, IP, and skilled workforce
👉 Strengthening India’s tech ecosystem.
🧵 Textile & Rural Industry Boost
👕 Mega Textile Parks announced
🧶 Gram Swaraj Initiative for khadi, handloom & handicrafts
🌍 Push for exports and branding
👉 Support for rural employment and MSMEs.
🚢 Logistics & Infrastructure
🚂 Dankuni–Surat freight corridor proposed
🚤 20 new national waterways in 5 years
👉 Cheaper, eco-friendly cargo movement.
🪨 Rare Earth Strategy
🌍 Rare earth corridors in Odisha, Kerala, AP, Tamil Nadu
🔋 Reducing dependence on China
👉 Strategic for EVs & electronics.
📊 Fiscal Health
📉 Fiscal deficit target: 4.3% of GDP
🏦 Debt-to-GDP: 55.6% (improving)
👉 Shows fiscal discipline.
💵 Market Borrowing
📈 Record ₹17.2 lakh crore gross borrowing in FY27
👉 Important for bond markets & liquidity watchers.
📉 Stock Market Impact
📌 STT on Futures increased from 0.02% → 0.05%
📌 STT on Options increased from 0.1% → 0.15%
📌 Higher cost for derivatives traders
👉 Active traders should factor this in.
🌎 Foreign Investment Relaxation
📊 PROI investment limit raised:
• Individual: 5% → 10%
• Overall cap: 10% → 24%
👉 Encourages foreign participation.
🔎 Overall Budget Mood
✅ Strong on healthcare, manufacturing, defence & infrastructure
✅ Focus on self-reliance & supply chains
⚖️ Balanced fiscal discipline
⚠️ Slight pressure on traders due to STT hike
Nifty – Technical Outlook before Budget.Nifty – Technical Outlook
As per the current Nifty weekly and monthly chart analysis, the index is trading within a broad consolidation range between its all-time high zone of 26,300 and the key support area near 25,160. The price structure indicates a flat correction formation as per Elliott Wave theory.
Based on the wave structure and momentum indicators, the ongoing flat correction appears to be in its final stage. Once completed, the market is expected to witness a five-wave downside move, which would mark the next corrective leg in the broader trend.
As per the chart structure, the potential correction from current levels could extend in the range of approximately 6–10%.
On the monthly timeframe, Nifty has formed an Evening Star candlestick pattern, which is a bearish reversal signal and indicates underlying weakness in the market structure.
Budget Session Outlook
During the budget session, Nifty may witness a pullback or bounce toward the 25,650 – 26,063 zone However, this upside is likely to be corrective in nature and may represent Wave 2 of the anticipated five-wave downside structure.
⚠️ Buying should be avoided in this resistance zone, as risk-reward does not favour fresh long positions at these levels.
Shorting Opportunities
Primary short opportunity:
If the index shows rejection or reversal signals in the 25,650 – 26,060 resistance zone , it may provide a favourable setup for short positions.
Confirmation-based short opportunity:
A decisive close below 25,160 (which also coincides with the 200 EMA) would confirm downside strength and offer another high-probability shorting opportunity.
Invalidation Level
This bearish outlook will be invalidated if Nifty closes above 26,350 and sustains above this level, which would negate the current Elliott Wave and corrective structure.

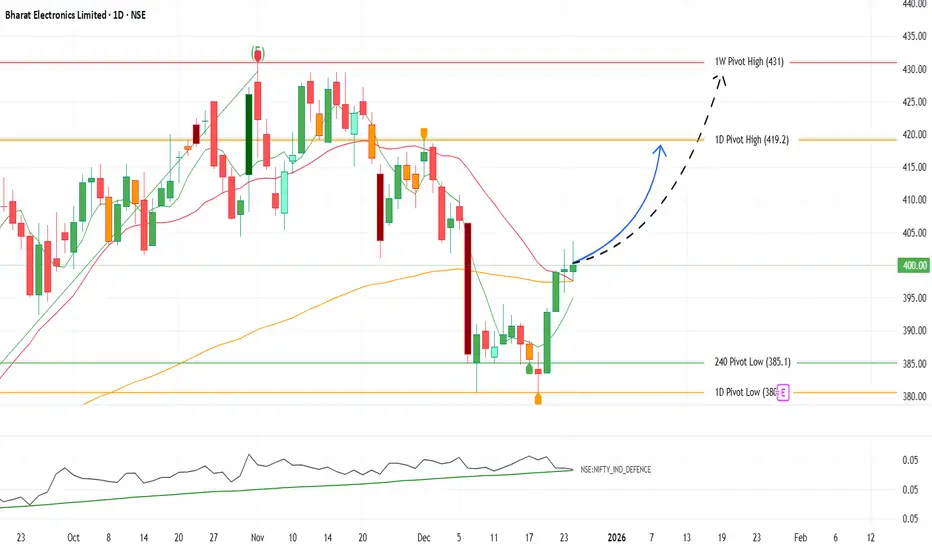
BEL – Setting Up for a 5% Move-Swing TradeBEL – Setting Up for a 5% Upside Move 🚀
BEL has taken strong support near ₹385–388 and is now reclaiming key moving averages with improving momentum. With the upcoming Union Budget expected to favor Defence spending, sentiment & flows remain supportive.
📌 Trade View
CMP: ~₹400
Targets: ₹420 (near-term), ₹431 (extendable)
Support: ₹388
Stoploss: ₹382 (strict)
💡 Why?
Strong bounce from key demand zone
Reclaiming trend levels + improving structure
Budget tailwinds + Defence sector strength
Trend intact. Dips buying. Ride the move! 🐊🔥
Market Outlook & Trade Setup – Friday, 30th January 2025Major indices showed a sharp recovery yesterday and even crossed the opening day high. Silver and Gold has corrected by more than 6% overnight so some selling pressure could be seen.
We have the Budget on Sunday, 1st Feb, 2026, so heavy positions might not be build in the market today.
🔹 NIFTY
* Previous Close: 25,418
* Expected Range: 25,000 – 25,500
🔹 SENSEX
* Previous Close: 82,566
* Expected Range: 82,500 - 82,600
🌍 Global & Market Sentiment
* DJIA: +55 | S&P: -9
💰 Institutional Activity (Cash Market)
* FII: Net Sellers: - ₹ 394 Cr
* DII: Net Buyers: + ₹ 2639 Cr
🔥 Events this Week: US --- Trump Speech & FED Rate announcement
📌 Sectoral Focus
Metal, Energy
👉 Commodities in Focus: Gold, Silver, Copper, Crude, Natural Gas
💯 Important Quarterly Results: Cupid, GHCL, HUDCO, IEX, ITC,REC, Voltas
📈 Trade smart. Manage risk. Stay disciplined.

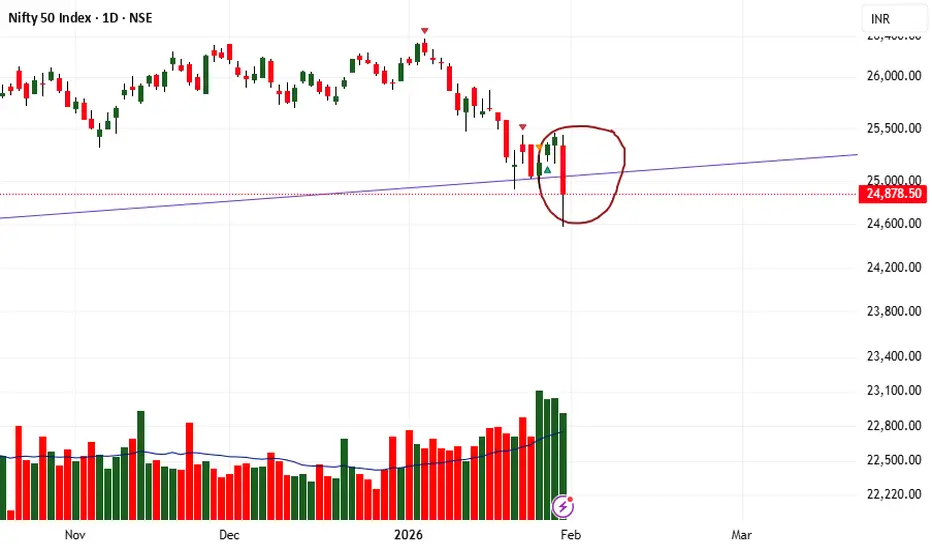
NIFTY 50 / TRIPLE TOP IN D TF - DOWNSIDE RISK AHEADNIFTY50 appears to be forming a triple top on the daily timeframe.
Momentum indicators are weakening, suggesting further downside.
Budget day could act as a volatility trigger and potential turning point.
Levels to watch on the downside.

The Budget Effect- Key ObservationsThe market often reacts to major political or economic events, with people setting high expectations. These expectations, whether positive or negative, lead to wild market swings and hence higher volatility. However, when you take a look at the Nifty’s long-term chart, you’ll see that the impact of such events tends to be pretty small within the overall market structure. During a strong bull market, the market usually absorbs a big negative news. There might be a short-term dip, but within a few weeks or months, things typically stabilize, and the market resumes its upward trend.
With the budget announcement coming up tomorrow, here are some key observations based on the budget’s impact on the market over the last five years, both in the short-term and long-term perspective:
🔘 Budget Week Trend: The market has generally closed higher in the budget week (meaning the close was above the open), except in 2020 when it ended in the red. Based on this, there are good chances that the market could close green this week as well.
🔘 Post-Budget Market Behavior: After the budget news, the market has mostly resumed its prior short-term trend, except in 2020. Here’s a quick note of what happened in previous years:
2021: The market consolidated for 11 weeks before bouncing back and resuming into its strong bull trend.
2022: The market was in a bearish phase from late 2021 and continued that trend for 19 weeks after the budget, despite some strong rallies in between.
2023: The short-term downtrend continued for another 7 weeks after the budget.
2024: The market consolidated for 15 weeks before picking up the bullish trend again.
2025: Since September 2024, we’ve been in a downtrend, so based on the last four years observations, it seems likely this short-term downtrend could continue for a few more weeks.
🔘 Breaking the Budget week Low: If the market is already in a correction before the budget, there's a chance it could dip further if the budget week low is breached.
🔘 Breaking the Budget Week High: Just because the market breaks above the budget week high doesn’t necessarily means we are going for a big rally. It could also lead to consolidation or a continuation of a short-term downtrend until a higher high is established. In 2025, any bullish move below 24858 would not confirm a change in short term trend.
🔘 Long-Term Bullish Trend: In all of the past years, after the short-term effects of the news is over, the market has resumed its longer-term bullish trend.
Now this is up to a trader how he interprets these observations. A short-term trader might be looking for short term moves and short the rallies, whereas a long-term trader will focus on the long-term bullish trend and buy the pullbacks.
So, what’s your approach? Feel free to drop a comment below, and don’t forget to like or share if you want more educational content in the future.

BANKNIFTY IMPORTANT LEVELS FOR TOMORROW, 23TH JULY | BUDGET DAYNSE:BANKNIFTY
❇️ IMPORTANT LEVELS 🚀
❇️ Support: 52400-52000-51700-51400-51000
❇️ Resistance : 52400-52600-52800-53000-53200-53500-53800
👉🏻 Purple line is a key level, above buying, Below selling.

BUDGET 2024: Technical Outlook & Money Flow in Different SectorsNSE IT SECTORS NSE:CNXIT
TREND: POSITIVE
India IT sector is currently on an upward trend.
After a bullish Pole & Flag pattern was spotted on the chart, a breakout occurred leading to a surge in index and the formation of a bullish Pennant pattern.
Encountering resistance at the 38,600 level, the IT index underwent a correction and consolidation phase.
During this consolidation, a Rounding Bottom pattern emerged, suggesting a potential continuation of the trend.
Since the breakout, the index has successfully maintained levels above the breakout point and is steadily climbing higher.
NSE FMCG SECTORS NSE:CNXFMCG
TREND: POSITIVE
The chart shows a strong uptrend.
In the past, there was a bullish Pole & Flag pattern formation, resulting in a surge after the breakout.
The index faced significant resistance at 58,000, causing a correction and consolidation.
A Cup & Handle pattern appeared emerged in the chart, suggesting a potential continuation of the trend.
The recent breakout in the cup & handle pattern suggests that the FMCG index has managed to stay above the breakout level and is gradually moving higher.
NSE METAL SECTORS NSE:CNXMETAL
TREND: NEGATIVE
The metal industry underwent a period of consolidation time and again in the past.
Reaching a peak near the 10,200 level, the metal index consolidated again, and a recent breakdown suggests a potential downward movement.
Looking at the downside, the 8,800 level could serve as a solid support, leading to a possible rebound in the index.
NSE MEDIA SECTOR NSE:CNXMEDIA
TREND: NEGATIVE
A bullish Ascending Triangle pattern was visible in the chart earlier.
Instead of breaking upwards, the index experienced a breakdown, marked by a powerful bearish marubozu candle.
Furthermore, the support level was breached, leading to a notable decline.
The index eventually found support and traded within a box pattern.
Following the breakout, the index rallied but encountered resistance at the former support level, now acting as a resistance post-breakdown.
It is anticipated that the Media index will continue to decline and potentially find support around the 1,750 level.

How To Read Budget (ii) - Government Debt and its implicationsThe Government is running a revenue deficit budget and hence it has to resort to borrowing. But apart from borrowing for revenue expenditure, it also needs to borrow for capex. Thus year after year the Government keeps borrowing and this keeps increasing the debt burden.
This video explains Government debt and how it is used and what can be the implications of debt, if used correctly or is used otherwise.

BIRLACABLE - DAY CHART TURNAROUND SOON...NSE:BIRLACABLE CHART ANALYSIS 🧐
Time frame - Day chart
🔹Trend: Correction Downtrend is in effect with low volume fall.
🔹 The last swing low made is insignificant and formed a double bottom structure, with a small RSI divergence.
🔹View: Breakout of a trendline and horizontal range around 263+ can trigger a change in trend, from down to fresh up trend.
Promoter holding is increasing cause it had a slow correction phase for a while now and it hit the major trendline support zone so that will be a high probability setup for a potential up move.
🟢Entry: 30 min close above 263+
♦️Risk:- 230 on weekly candle closing below.
🎯Targets :- 290,350+
Use position sizing and follow your money management rules too.
Detailed analysis on chart, Study it and mark levels on your chart.

#BudgetUnion Kothari Sugars And Chemicals Ltd. MULTIBAGGER StockThis Company should be next Multibagger Stock in 2024-2025. This stocks has potential to gave a unpredictable growth. This Company is engaged in manufacturing of Sugar, Alcohol and Power.
It also caters to the demand of both domestic and International markets. And the most important thing is that it manufactures ETHANOL.
The company has shown a good profit growth of 29.25% for the Past 3 years.
The company has shown a good revenue growth of 20.02% for the Past 3 years.
The company has significantly decreased its debt by 18.35 Cr.
Company has a healthy Interest coverage ratio of 15.09.
Company’s PEG ratio is 0.74.
The company has an efficient Cash Conversion Cycle of 24.35 days.
The company has a good cash flow management; CFO/PAT stands at 1.39.
The company has a high promoter holding of 73.53%.
The company has a strong degree of Operating leverage, Average Operating leverage stands at 18.70.

A silent sector for budget.Amidst of all the buzz around Infra, Railway, Defense etc, Tourism sector has always received something from the budget. Not a massive rally but NSE:LEMONTREE hotels is all set for a inverted head and shoulders breakout and march towards 165+ levels.

No to 30% Tax on F&O Trading!Recently, there have been reports that the government is considering imposing a 30% tax on trading in Futures and Options (F&O). This move will be devastating for many retail traders who earn a living from trading.
F&O trading is not gambling!
Traders invest time, effort, and money to make informed decisions based on market trends and analysis. It's not a game of chance like lottery or cryptocurrency. F&O trading requires skill, strategy, and dedication.
Taxing F&O will crush small traders
If this tax is implemented, it will be a significant burden on small traders who are already struggling to make ends meet. This will lead to:
Reduced participation in the market
Increased risk-taking (traders may take unnecessary risks to recover losses)
Flight of talent (traders may leave India for countries with more favorable tax regimes)
Don't punish responsible trading
We urge the government to reconsider this proposal and instead focus on creating a more favorable environment for responsible trading. This includes:
Simplifying tax regulations
Providing education and awareness programs
Encouraging innovation and growth in the trading ecosystem
Join us in opposing this proposal!
Let's protect the interests of responsible traders and ensure that India remains a hub for trading and financial growth.
#SaveTradingInIndia #NoTo30PercentTaxOnFandO #ResponsibleTrading

Maharashtra Budget 24 - 25 (small slip of tongue once - sorry)Maharashtra Government announced the interim Budget today for 2024 - 25. The effort is laudable as it has tried to rein the revenue deficit and also reduce borrowing.

Karnataka State Budget Analysis Karnataka has increased its expenses and has not provided for any income increase of the same magnitude. Due to this the state is facing fiscal problems. It is simply resorting to borrowing more to fund its populist programmes. This is a sure receipe for disaster.

Pre-budget Nifty chartImmediate resistance 21896.15 (along with 21813 recent pivot)
Upside targets 22022 and 22306.60
Downside supports 21500 and 21206
While trading for new entry or existing positions, these levels will act as major support and resistance.

Market Bullish NIFTY 50 Ready to Set New Record High.Greetings everyone,
I think that either the NIFTY50 or the entire market is entering a Bullish trend. Starting from today or possibly in the upcoming week, it seems likely that the market will commence a UP ward direction. This projection is based on two potential factors:
-> Today Imp Resistance level 21517 Crossed.
-> We have strong Support in 21250 and it was our reversal trend.
-> Today Bullish Marubozu Candle
Key Levels:
Entry Range: 21700-800
Stop Loss: 21517
Target 1: 21900 ( Probably achieved tomorrow)
Target 2: 22000
Target 3: 22378 & 22654
Strategies to Consider:
For those involved in options trading: Consider a small hedging strategy.
For those engaged in futures trading: Implement a strict stop-loss strategy.
Important Note: Make risk decisions in line with your available capital. It is strongly advised to refrain from trading with borrowed funds or your entire savings, drawing from personal experiences.

Next Week Market Strategy | SIDEWAYS TO UPWARD DirectionNext Week Market Strategy | SIDEWAYS TO UPWARD Direction:
-> Black TrendLine is the Seller Zone and Blue TrendLine is Buyer Zone.
-? You can do Scalping from these points.
A big Opportunity will come after the breakout of BLUE/BLACK Trendlines.
Request: Do not Trade without Setup, because Your Money is hard hard-earned money do not waste this.

25 Jan ’24 — BankNifty looks, walks & talks like a BEAR, is it?BankNifty Analysis - Stance Bearish ⬇️
The unusualness of the last 30mts was more obvious in the Banks - HDFC, ICICI, AXIS and Kotak. Seems a news/event is brewing and we may get some clarity in the coming days. The good thing is that it broke out pretty late in the day, which meant the expiry was not totally screwed.
4mts chart
How many Analysts you know are bearish on the banks, most of them we follow are Permabulls. Seems like the criticism we are getting is obvious in the price action today. Except for the last 30mts - every other minute belonged to the bears today. When news/event breaks out - the best thing a technical analyst could do is close the position and wrap the day.
63mts chart
BN got support from our marked SR level of 44542. The next level below is 44068 which is the strongest SR level in the proximity. The history of 44068 levels goes back to Dec 2022 (quite a long way back). Our stance of bearishness continues and hope Monday belongs to the bears.

25 Jan ’24 — Unusual last 30mts of price action, could be a NEWSNifty Analysis - Stance Neutral ➡️
Recap from yesterday: ”The issue for the bears from the 63mts chart is the W formation (double bottom). To prove they are still in the game, the Bears must create a big fall and ensure an M pattern supersedes the W. Due to the momentum the bulls got today, we are changing the stance from bearish to neutral. The first target would be to take out the 214991 resistance and nullify the 5 RED candles formed on 23rd. If we were to move downwards, the swing low of 21372 has to be taken out tomorrow itself.”
4mts chart
The main objective of the morning session was spent undoing the bullish surge yesterday. The selling pressure got arrested by 11.00, by then we had already fallen 214pts ~ 1.00%. We then had a quick surge till 11.39 followed by a gradual coo off. The LOD remained at 21247 proving that the BEARS are still in the game. What surprised all of us is the price action in the last 30mts. It did not look like a technical action, most likely it could be a news/event that broke out to a select group of people or insiders. Hope we get some clarity on that by Monday when we reopen.
63mts chart
Yesterday’s W pattern is no longer valid as today’s action has nullified it. Our stance continues to be neutral with a slight inclination to the bearish side. Seems like FIIs are not done unwinding their positions - the run-up to the Budget 2024 looks interesting.

budget 2023 with technicalsi just explain how market take resistance @privious breakdown point and what next view for tomorrow.
