BEL Triangle & Flag BreakoutBEL is attempting breakout from Triangle and Bull Flag Pattern on 1D timeframe. Watch for closing at End of the Day. Watch for Earnings because this stock carries earnings risk.
Bullflagpattern

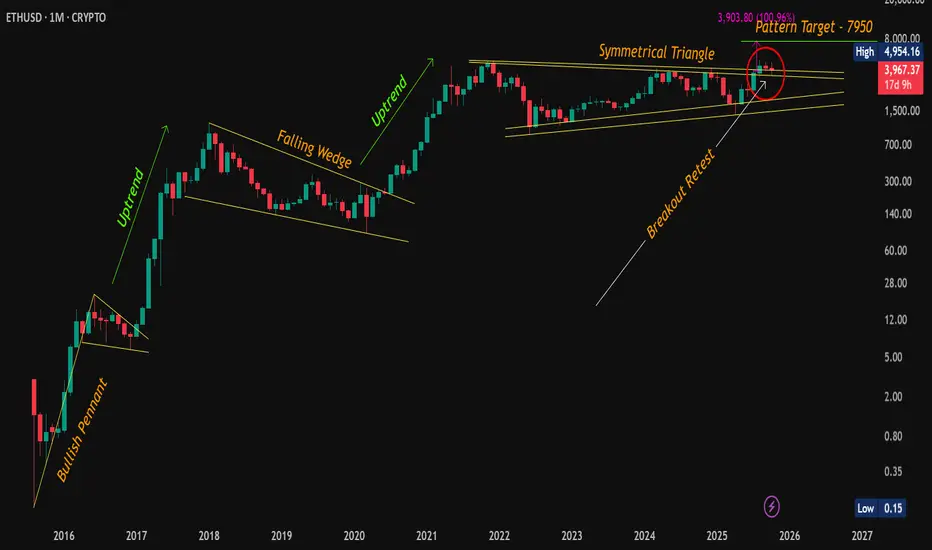
ETH Retest Confirmed – Bullish Momentum Intact!CMP: $3,968
Ethereum is holding strong above the symmetrical triangle breakout zone after a textbook breakout + retest . Despite the recent consolidation, the structure remains bullish , and the bigger pattern is still in play.
🔶 Technical Highlights:
✅ Symmetrical Triangle Breakout: ETH successfully broke out and retested the upper trendline (see red circle). This retest confirms the breakout validity.
✅ Consolidation Above Resistance: ETH is consolidating in a tight range above previous resistance , forming a potential bull flag .
✅ Pattern Targets Remain Active:
📍 Symmetrical Triangle Target: ~$7,950
📍 Bull Flag Target (if breakout confirms): ~$7,365+
📈 Market Structure:
📍 Previous breakouts (Bullish Pennant in 2016, Falling Wedge in 2019) led to strong uptrends .
📍 Current consolidation mirrors historical patterns that preceded major rallies.
🟢 Key Level to Watch:
📍 A monthly close above $4,954.16 (previous ATH) would mark the next major confirmation, likely attracting breakout traders and institutions.
💡 ETH is showing maturity in structure – breakouts, retests, and consolidations are happening on higher timeframes with clear technical precision. The longer this base holds, the stronger the eventual move could be.
📌 Disclaimer: This analysis is shared for educational purposes only. It is not a buy/sell recommendation. Please do your own research before making any trading decisions.
#ETH | #Ethereum | #Crypto | #Breakout | #ChartPatterns | #SymmetricalTriangle | #BullFlag | #PriceAction
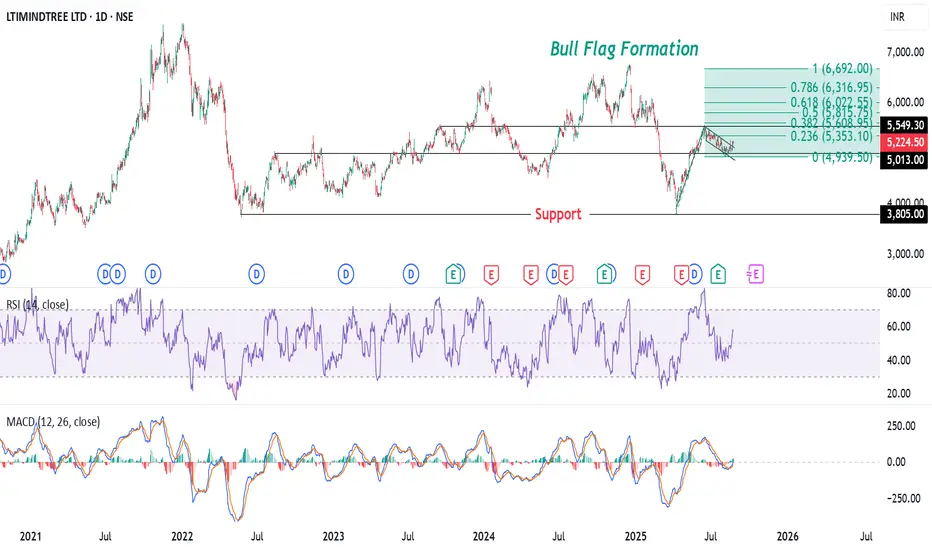
LTIMINDTREE Forms Bull Flag: Signs of a Potential Upside Move?The chart of LTIMINDTREE LTD shows a Bull Flag formation, a bullish continuation pattern that typically appears after a strong upward move. The flagpole is represented by the sharp price rally, from 3,800, followed by a downward-sloping consolidation channel forming the flag.
This pattern suggests a potential breakout to the upside, supported by the Fibonacci extension levels projecting targets up to the .618 fib ext. level at ₹6,022. The RSI is near 56.89, indicating moderate strength, while the MACD shows a possible bullish crossover, further reinforcing the bullish outlook. The key support level is around ₹5,000, and a breakout above the flag could signal a resumption of the uptrend.
Disclaimer: The information provided in this analysis is for educational and informational purposes only and should not be considered as financial or investment advice.
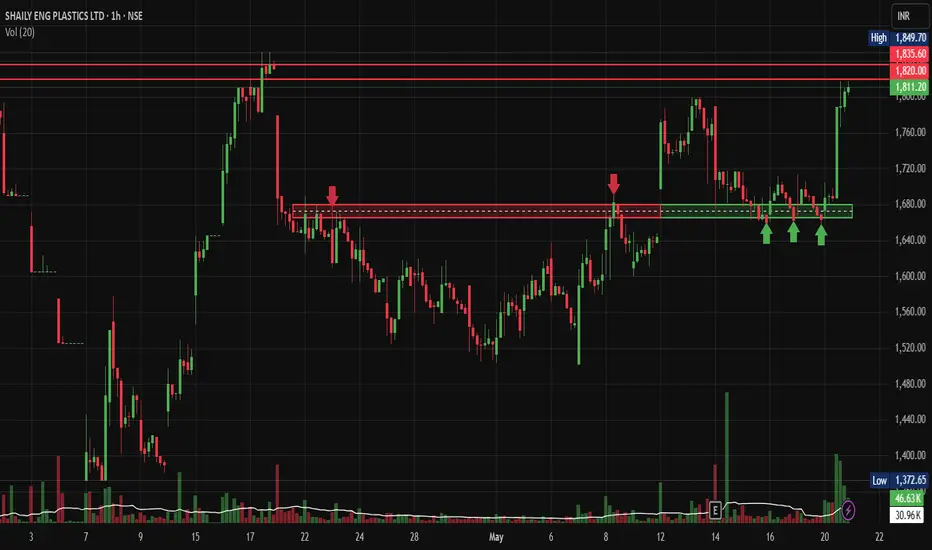
Shaily Eng Plastics Makes a Power MoveNSE:SHAILY Makes a Power Move on Hourly Charts after Q4 Results.
Price Action Analysis:
The stock is currently trading at ₹1,811.20. After consolidating near the ₹1,650-1,680 support zone for several days, SHAILY has broken out strongly to the upside, reclaiming previous highs near ₹1,820. The price action shows a series of higher lows since the early May bottom, indicating increasing bullish momentum.
Volume Analysis:
Volume has been healthy at 46.63K shares, significantly above the 30.96K average volume. This confirms genuine buying interest supporting the recent breakout. The volume spikes align with key price movements, particularly during the recent bullish moves, which validates the strength of the current uptrend.
Support & Resistance Levels:
- Key Resistance: ₹1,835-1,850 zone (previous high)
- Immediate Breakout Level: ₹1,820 (now acting as support)
- Major Support: ₹1,650-1,680 zone (multiple tests with green arrows)
- Base Formation: A solid base was formed between ₹1,650-1,680 after the pullback from April highs
Technical Patterns:
1. Rectangle Pattern: The stock formed a rectangular consolidation pattern between mid-April and mid-May (₹1,650-1,680 range)
2. Triple Bottom: Three distinct touches at the ₹1,650-1,680 support zone (marked with green arrows)
3. Bull Flag: The recent consolidation after the strong upward move from early May represents a bull flag pattern that has now resolved to the upside
Trade Setup:
- Entry Point: ₹1,815-1,820 on a pullback to the breakout level
- Stop Loss: ₹1,765 (below the recent swing low)
- First Target: ₹1,850 (previous resistance)
- Second Target: ₹1,920 (measured move from the rectangle pattern)
- Final Target: ₹2,000 (psychological level and potential measured move target)
Risk Management:
- Position sizing: Limit exposure to 2-3% of trading capital
- Risk-Reward Ratio: Approximately 1:1.5 based on the stop loss and the second target
- Trailing stop: Move stop loss to breakeven after the price reaches the first target
NSE:SHAILY showed exceptional technical strength with the recent breakout above resistance after forming a solid base. The increased volume confirms buyer interest, and the prior triple bottom pattern adds confidence to the bullish outlook. Traders should watch for the continuation of the breakout with the mentioned targets, while protecting capital with the defined stop loss.
Keep in the Watchlist.
NO RECO. For Buy/Sell.
📌Thank you for exploring my idea! I hope you found it valuable.
🙏FOLLOW for more
👍BOOST if you found it useful.
✍️COMMENT below with your views.
Meanwhile, check out my other stock ideas on the right side until this trade is activated. I would love your feedback.
Disclaimer: "I am not a SEBI REGISTERED RESEARCH ANALYST AND INVESTMENT ADVISER."
This analysis is intended solely for informational and educational purposes and should not be interpreted as financial advice. It is advisable to consult a qualified financial advisor or conduct thorough research before making investment decisions.
TATA ELXSI Triangle BreakoutTata Elxsi has given a Triangle Breakout on 1D timeframe yesterday with a high volumes. It is apparently retesting its resistance.
It has also formed a Flag pattern on 1W timeframe and attempting to give a breakout on 1W chart.

THANGAMAYL - 10 Months Consolidation Breakout / All Time HighThangamayil Jewellery Ltd
1) Time Frame - Weekly.
2) The Stock has been Consolidating since (July, 2023). Now It has given a Consolidation breakout & Closed at it's Life Time High with good volume & good bullish momentum candle in weekly Time Frame.
3) The stock may find it's next resistance around the price (2050 - 24.50% from the price 1646.10) .
4) Recommendation - Strong Buy.

INOXGREEN - 6 Months Consolidation Breakout / All Time HighInox Green Energy Services Ltd
1) Time Frame - Weekly.
2) The Stock has been Consolidating since (January, 2024). Now It has given a Consolidation breakout & Closed at it's Life Time High with good volume & good bullish momentum candle in weekly Time Frame.
3) The stock may find it's next resistance around the price (210 - 22.90% from the price 170.82).
4) Recommendation - Strong Buy.

RVNL BULL FLAG BREAKOUTNSE:RVNL has given a Bull Flag Breakout.
The stock seems to be resumin it's uptrend.
Likely to head to new highs.

TEJASNET - Bull Flag - Monthly Breakout with volumeThe analysis is done on monthly TF hence price may take few weeks to few months in order to reach the targets.
Trade setup is explained in image itself.
The above analysis is purely for educational purpose. Traders must do their own study & follow risk management before entering into any trade
Checkout my other ideas to understand how one can earn from stock markets with simple trade setups. Feel Free to comment below this or connect with me for any query or suggestion regarding this stock or Price Action Analysis.

M_M - Bull Flag Breakout - Swing TradeThe analysis is done on daily TF hence price may take few days to few weeks in order to reach the targets.
Trade setup is explained in image itself.
The above analysis is purely for educational purpose. Traders must do their own study & follow risk management before entering into any trade
Checkout my other ideas to understand how one can earn from stock markets with simple trade setups. Feel Free to comment below this or connect with me for any query or suggestion regarding this stock or Price Action Analysis.

TATA MOTORS DVR - Long term Bullish1. Bull Flag Pattern formed...
2. Long-term Bullish trend
3. When it breaches the resistance will go upward direction... waiting for the market correction.
Note:
1. I’m not a SEBI Registered advisor, my views are personal and for educational purposes only.
2. Always check with your financial advisor and take the trade as per your risk/reward ratio.
3. Follow me for more patterns and like, and share so that we feel it is helpful to many and share more patterns...

LTI - Bull Flag Breakout - Swing TradeThe analysis is done on daily TF hence price may take few days to few weeks in order to reach the targets.
Trade setup is explained in image itself.
The above analysis is purely for educational purpose. Traders must do their own study & follow risk management before entering into any trade
Checkout my other ideas to understand how one can earn from stock markets with simple trade setups. Feel Free to comment below this or connect with me for any query or suggestion regarding this stock or Price Action Analysis.

SRF - Cup & Handle + Bull Flag BreakoutThe analysis is done on daily TF hence price may take few days to few weeks in order to reach the targets.
Trade setup is explained in image itself.
The above analysis is purely for educational purpose. Traders must do their own study & follow risk management before entering into any trade
Checkout my other ideas to understand how one can earn from stock markets with simple trade setups. Feel Free to comment below this or connect with me for any query or suggestion regarding this stock or Price Action Analysis.

PI INDUSTRIES - Bull Flag + Descending Channel Breakout - Swing The analysis is done on daily TF hence price may take few days to few weeks in order to reach the targets.
Trade setup is explained in image itself.
The above analysis is purely for educational purpose. Traders must do their own study & follow risk management before entering into any trade
Checkout my other ideas to understand how one can earn from stock markets with simple trade setups. Feel Free to comment below this or connect with me for any query or suggestion regarding this stock or Price Action Analysis.

TATASTEEL - Triangle Pattern + Bull Flag Breakout - Swing TradeThe analysis is done on daily TF hence price may take few days to few weeks in order to reach the targets.
Trade setup is explained in image itself.
The above analysis is purely for educational purpose. Traders must do their own study & follow risk management before entering into any trade
Checkout my other ideas to understand how one can earn from stock markets with simple trade setups. Feel Free to comment below this or connect with me for any query or suggestion regarding this stock or Price Action Analysis.

BLUESTAR - Swing Trade - ATH breakoutThe analysis is done on daily TF hence price may take few days to few weeks in order to reach the targets.
Trade setup is explained in image itself.
The above analysis is purely for educational purpose. Traders must do their own study & follow risk management before entering into any trade
Checkout my other ideas to understand how one can earn from stock markets with simple trade setups. Feel Free to comment below this or connect with me for any query or suggestion regarding this stock or Price Action Analysis.

LINDEINDIA - Bull Flag Breakout - Swing TradeThe analysis is done on weekly TF hence price may take few weeks to few months in order to reach the targets.
Trade setup is explained in image itself.
The above analysis is purely for educational purpose. Traders must do their own study & follow risk management before entering into any trade
Checkout my other ideas to understand how one can earn from stock markets with simple trade setups. Feel Free to comment below this or connect with me for any query or suggestion regarding this stock or Price Action Analysis.

POWERGRID - Triangle + Bull Flag pattern breakout - Swing TradeThe analysis is done on daily TF hence price may take few days to few weeks in order to reach the targets.
Trade setup is explained in image itself.
The above analysis is purely for educational purpose. Traders must do their own study & follow risk management before entering into any trade
Checkout my other ideas to understand how one can earn from stock markets with simple trade setups. Feel Free to comment below this or connect with me for any query or suggestion regarding this stock or Price Action Analysis.

CAPLINPOINT BULLISH FLAG #caplinpoint looking super on weekly chart
any close above 890 levels will open gates for 950 then 1050
keep close watch
sl closing below 800 weekly basis

RADICO - Bull Flag breakout after consolidation - Swing TradeThe analysis is done on daily TF hence price may take few days to few weeks in order to reach the targets.
Trade setup is explained in image itself.
The above analysis is purely for educational purpose. Traders must do their own study & follow risk management before entering into any trade
Checkout my other ideas to understand how one can earn from stock markets with simple trade setups. Feel Free to comment below this or connect with me for any query or suggestion regarding this stock or Price Action Analysis.


SBICard up for a breakoutSBICard has been actively taking support at 200 EMA and bouncing back and hitting 1140-1160 levels, but this time it seems it isn't headed towards 200-EMA and rather it is forming a Bull Flag , one can go long once breakout done and expect an Immediate Target of 1300.
Short Term Target: 1500

Bajaj Finance Bullish Flag Pattern Breakout Target 20%Flag Pattern breakout
Stop Loss ~7260s Levels
Target ~8300s Levels
