Kross cmp 176.22 by Daily Chart view since listedKross cmp 176.22 by Daily Chart view since listed
- Support Zone 156 to 166 Price Band
- Resistance Zone 180 to 192 Price Band
- Volume attempting sync with avg traded qty
- Bullish Double Bottom "W" with Support Zone base
- Falling Resistance Trendline Breakout has well sustained
- Resistance Zone neckline acting as good hurdle for Breakout
- Majority of the Technical Indicators seen trending fairly positive
Bullishchartpattern

IRIS Clothing cmp 35.66 by Weekly Chart viewIRIS Clothing cmp 35.66 by Weekly Chart view
- Support Zone 28 to 31 Price Band
- Resistance Zone 36.50 to ATH 40.71 Price Band
- Volumes above average traded quantity over past 2 weeks
- Darvas Box - Price trending between 30 to 35.50 since June 2025
- Long Bullish Rounding Bottom followed by small one's made within Darvas Box

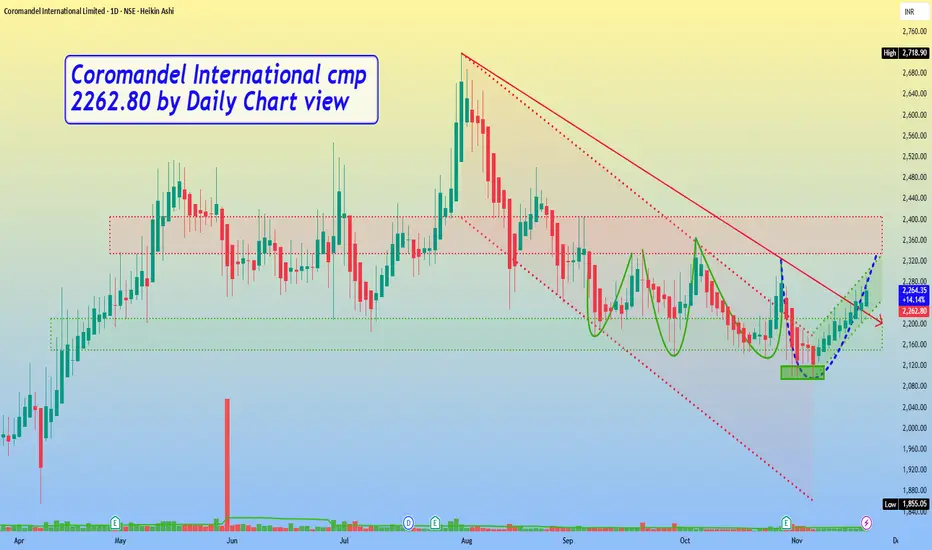
Coromandel International cmp 2262.80 by Daily Chart viewCoromandel International cmp 2262.80 by Daily Chart view
- Support Zone 2150 to 2210 Price Band
- Resistance Zone 2335 to 2405 Price Band
- Falling Resistance Trendline Breakout has well sustained
- Bullish Triple Bottom made around 2095 to 2120 Price Band
- Repeated Bullish Rounding Bottoms by Resistance Zone neckline
- Volumes seem steady and need to increase for Resistance Zone Breakout
Onmobile Global cmp 73.96 by Weekly Chart viewOnmobile Global cmp 73.96 by Weekly Chart view
- Support Zone 62 to 68 Price Band
- Resistance Zone 78 to 85 Price Band
- Bullish Rounding Bottom under Resistance Zone
- 1st Falling Resistance Trendline seems well sustained
- Next hurdles are Dotted Falling Resistance Trendline and Resistance Zone
- Volumes needed to provide fresh upside to give breakout above the Resistance
- Stock price trending well with positive technical indicators EMA, MACD, RSI, SAR, SuperTrend

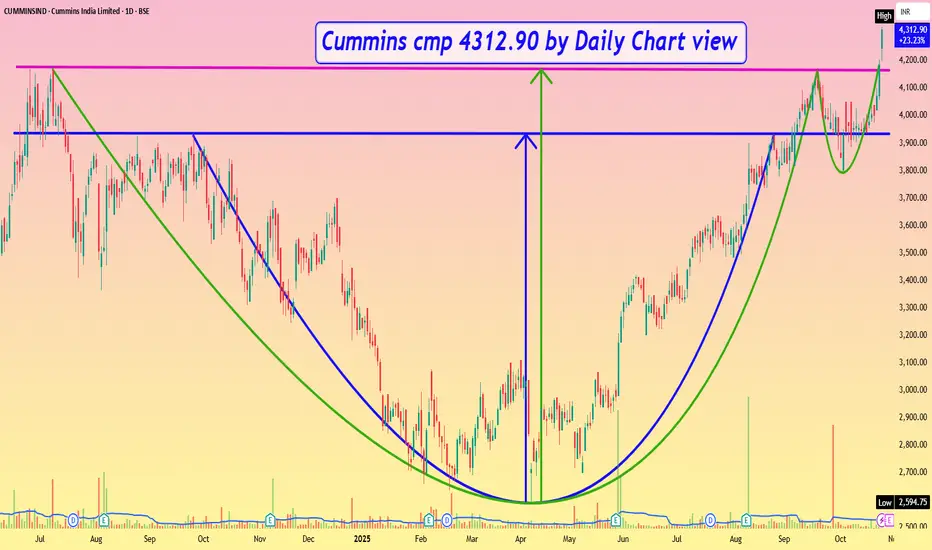
Cummins cmp 4312.90 by Daily Chart viewCummins cmp 4312.90 by Daily Chart view
- Support Zone 3900 to 4100 Price Band
- Only Resistance at ATH 4323.85 done today
- Very Strong Bullish Chart setup and Technical patterns made
- 1st Logical Target price level +/- 5250 by inner Rounding Bottom
- 2nd Logical Target price level +/- 5735 by broader Cup & Handle pattern
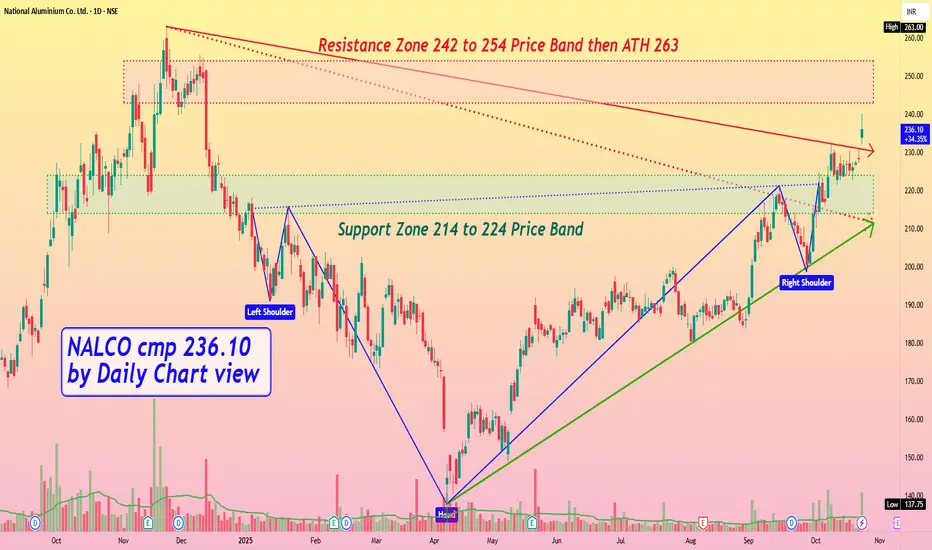
NALCO cmp 236.10 by Daily Chart viewNALCO cmp 236.10 by Daily Chart view
- Support Zone 214 to 224 Price Band
- Resistance Zone 242 to 254 Price Band then ATH 263
- Bullish Head & Shoulders completed by Support Zone neckline
- Dotted Falling Resistance Trendline Breakout has well sustained
- Falling Resistance Trendline Breakout attempted and work in progress
- Volumes spiking intermittently over past few days by close sync with avg traded qty
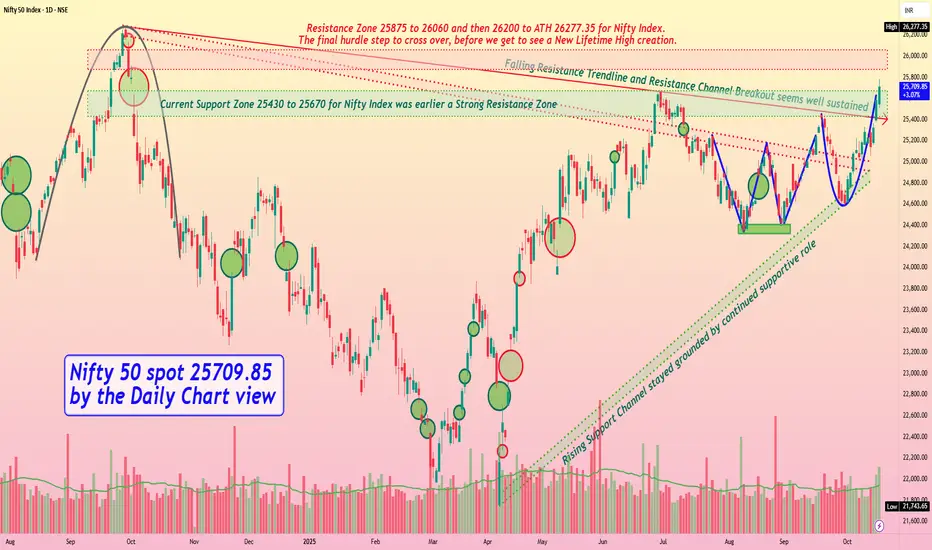
Nifty 50 spot 25709.85 by the Daily Chart view - Weekly updateNifty 50 spot 25709.85 by the Daily Chart view - Weekly update
- [ b]Nifty Index now just 567.50 points away from ATH 26277.35 for creating a New Lifetime High Milestone
- Resistance Zone 25875 to 26060 and then 26200 to ATH 26277.35 for Nifty Index
- The final hurdle step to cross over before we get to see a New Lifetime High creation
- Both Falling Resistance Trendline and Resistance Channel Breakout seem well sustained
- Current Support Zone 25430 to 25670 for Nifty Index was earlier a Strong Resistance Zone
- Rising Support Channel has stayed firmly grounded by providing the continued supportive role
- Bullish Technical patterns Double Bottom "W" followed by Rounding Bottom formed by Support Zone neckline
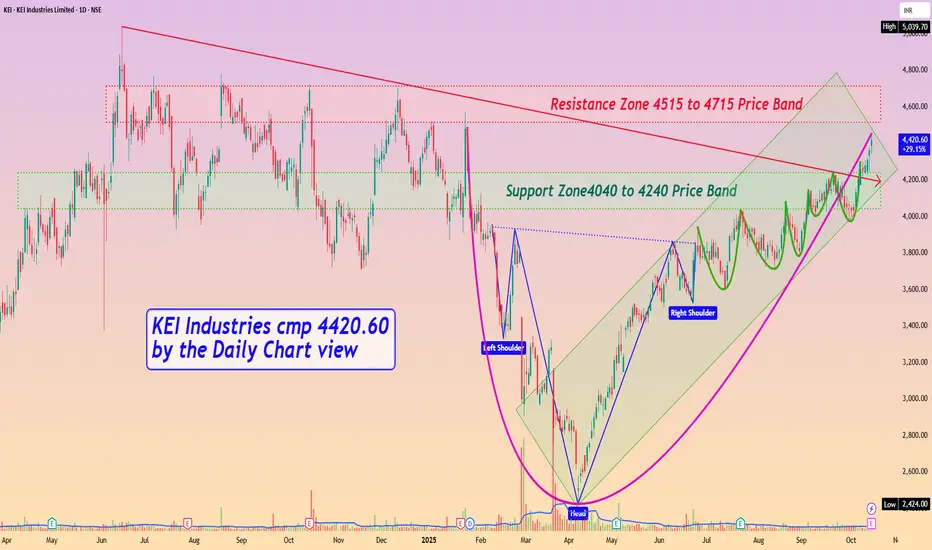
KEI Industries cmp 4420.60 by Daily Chart viewKEI Industries cmp 4420.60 by Daily Chart view
- Support Zone4040 to 4240 Price Band
- Resistance Zone 4515 to 4715 Price Band
- Falling Resistance Trendline Breakout seems sustained
- Support Zone under test retest phase over the past few days
- Price seen is traversing inside Rising Parallel Parallel Price Channel
- Volumes are seen to be in close sync with the average traded quantity
- Multiple Bullish Patterns formed of Rounding Bottom, Head & Shoulder and a tight VCP too
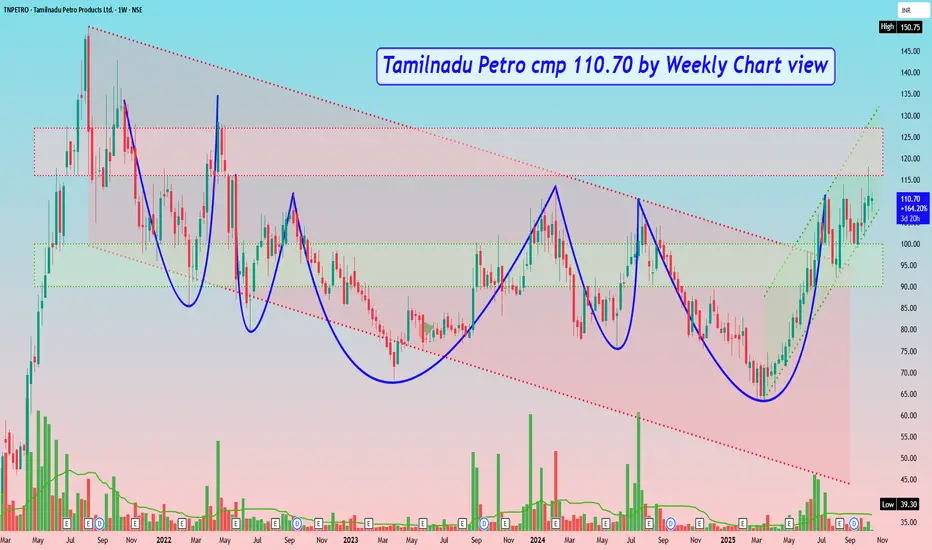
Tamilnadu Petro cmp 110.70 by Weekly Chart viewTamilnadu Petro cmp 110.70 by Weekly Chart view
- Weekly basis : Support Zone 90 to 100 Price Band
- Weekly basis : Resistance Zone 116 to 127 Price Band
- Multiple Bullish Rounding Bottoms around Support Zone and by Resistance Zone neckline
- Price was traversing in Falling Parallel Price Channel then took Breakout moving in Rising Parallel Price Channel
- Subject to the Resistance Zone Breakout and closure sustained above it for few days, may anticipate for fresh upside probability
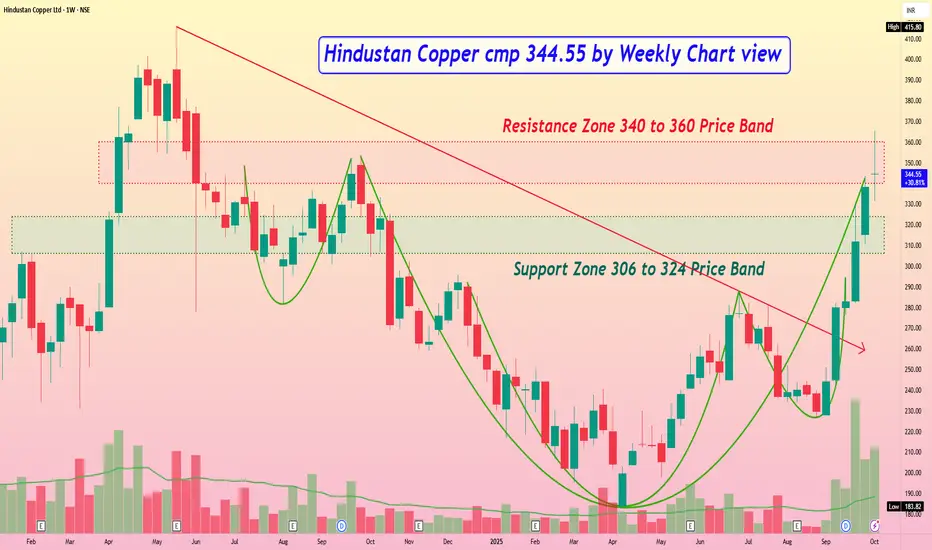
Hindustan Copper cmp 344.55 by Weekly Chart viewHindustan Copper cmp 344.55 by Weekly Chart view
- Support Zone 306 to 324 Price Band
- Resistance Zone 325 to 337 Price Band
- Falling Resistance Trendline Breakout is well sustained
- Bullish Rounding Bottom formed by Resistance Zone neckline
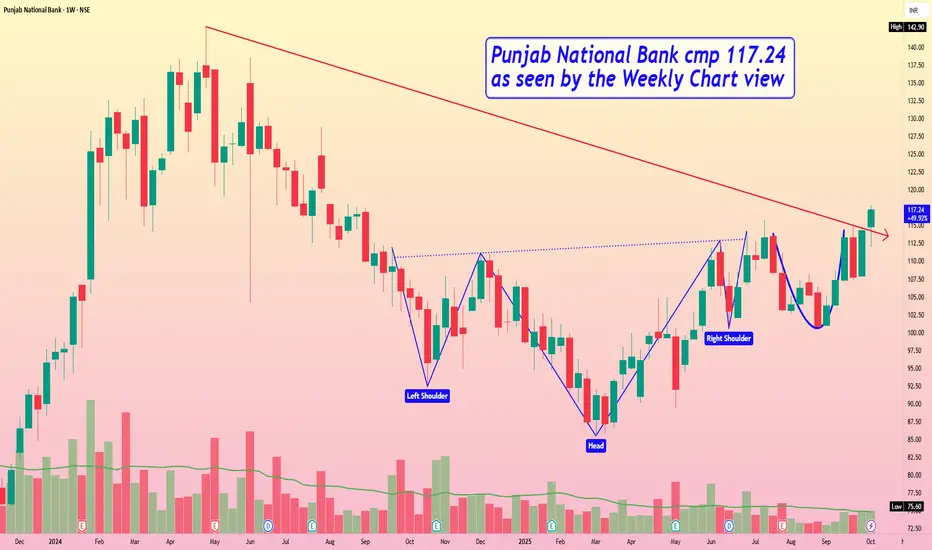
Punjab National Bank cmp 117.24 by Weekly Chart viewPunjab National Bank cmp 117.24 by Weekly Chart view
- Weekly basis Support levels seen at 107 > 98 > 87
- Weekly basis Resistance levels at 124 > 133 > ATH 142.90
- Bullish Head & Shoulders followed by Rounding Bottoms formed
- Volumes seen getting in close sync with the average traded quantity
JK Paper cmp 426.25 by Weekly Chart viewJK Paper cmp 426.25 by Weekly Chart view
- Weekly basis Support Zone 345 to 380 Price Band
- Weekly basis Resistance Zone 445 to 480 Price Band
- Bullish Cup & Handle pattern made surrounding Support Zone
- Volumes spiked heavily last week by close sync with avg traded qty
- Majority of the Technical Indicators BB, EMA, MACD, RSI, SAR on positive trend
- Falling Resistance Trendline Breakout well sustained by price and volumes momentum

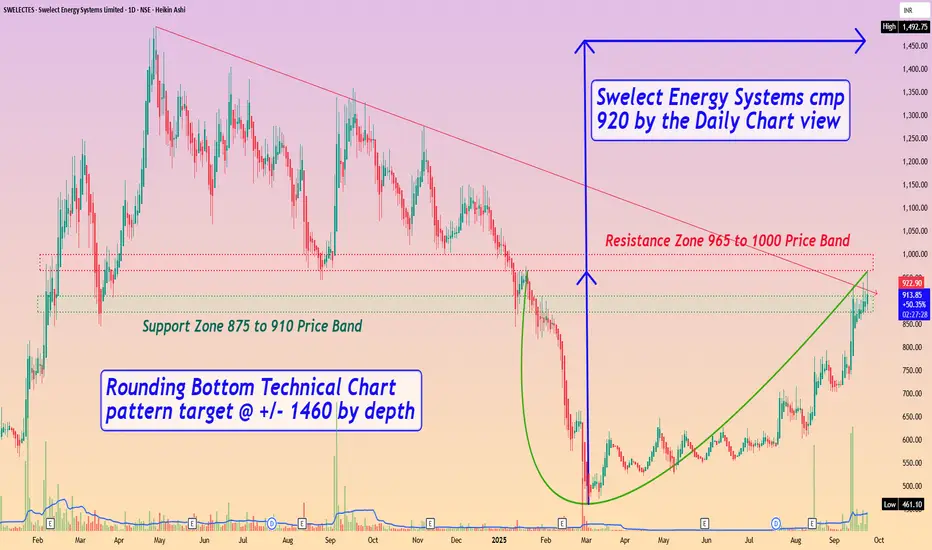
Swelect Energy Systems cmp 920 by the Daily Chart viewSwelect Energy Systems cmp 920 by the Daily Chart view
- Support Zone 875 to 910 Price Band
- Resistance Zone 965 to 1000 Price Band
- Rounding Bottom Technical Chart pattern target @ +/- 1460 by depth
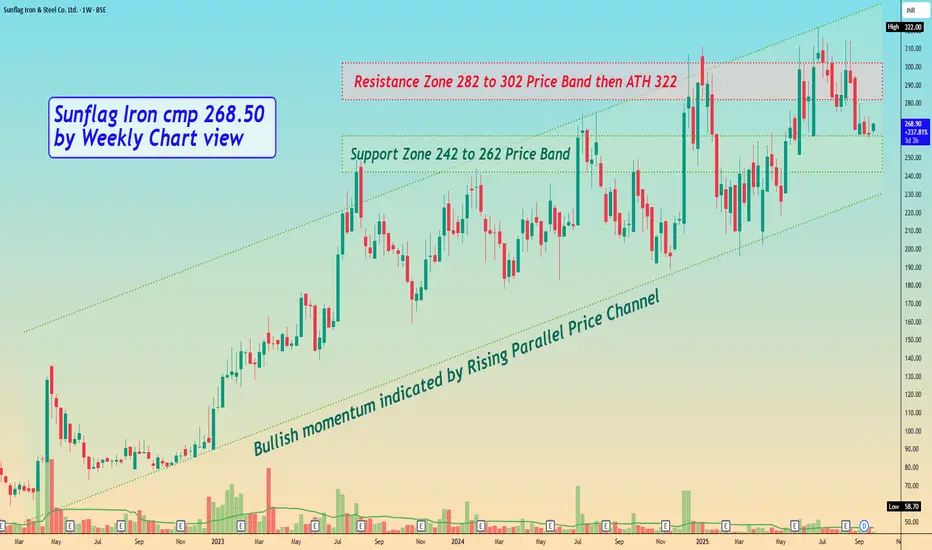
Sunflag Iron cmp 268.50 by Weekly Chart viewSunflag Iron cmp 268.50 by Weekly Chart view
- Support Zone 242 to 262 Price Band
- Resistance Zone 282 to 302 Price Band then ATH 322
- Bullish momentum indicated by Rising Parallel Price Channel
- Volumes are seen getting in close sync with average traded quantity
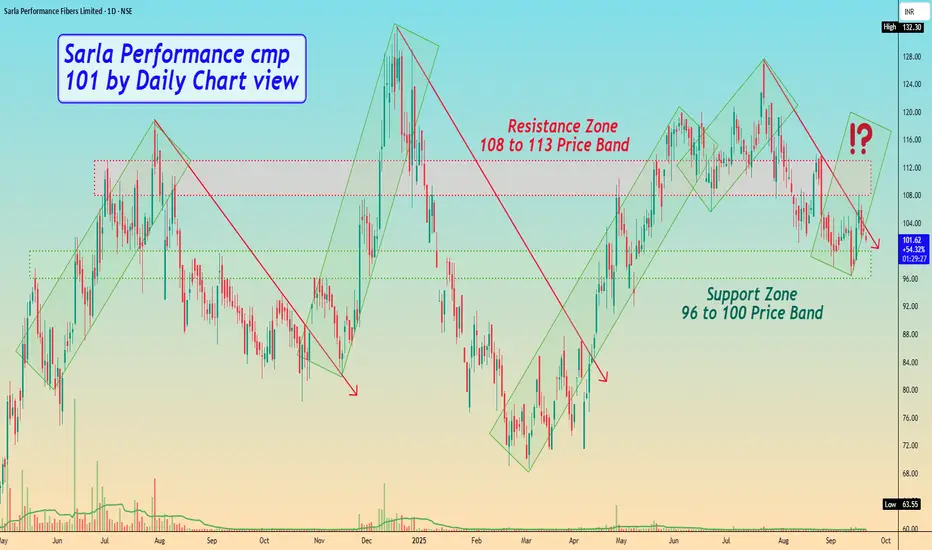
Sarla Performance cmp 101 by Daily Chart viewSarla Performance cmp 101 by Daily Chart view
- Support Zone 96 to 100 Price Band
- Resistance Zone 108 to 113 Price Band
- Rising Falling Price pattern repeated for over a year now
- Will the Price Rising pattern repeat from Support Zone ground ???
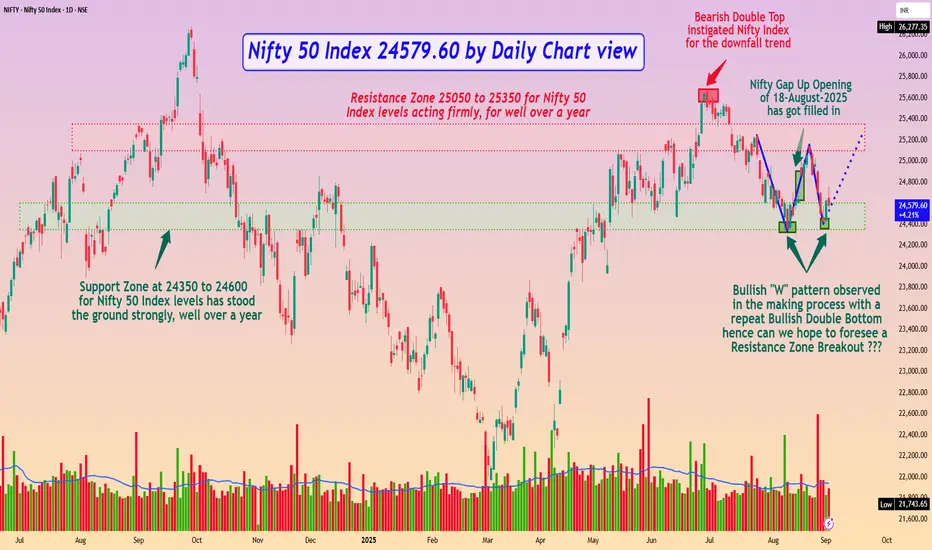
Nifty 50 Index 24579.60 by Daily Chart viewNifty 50 Index 24579.60 by Daily Chart view
- Nifty Gap Up Opening of 18-August-2025 has got filled in
- Bearish Double Top instigated Nifty Index for the downfall trend
- Resistance Zone 25050 to 25350 for Nifty 50 Index levels acting firmly, for well over a year
- Support Zone at 24350 to 24600 for Nifty 50 Index levels has stood the ground strongly, well over a year
- Bullish "W" pattern observed in the making process with a repeat Bullish Double Bottom hence can we hope to foresee a Resistance Zone Breakout ???
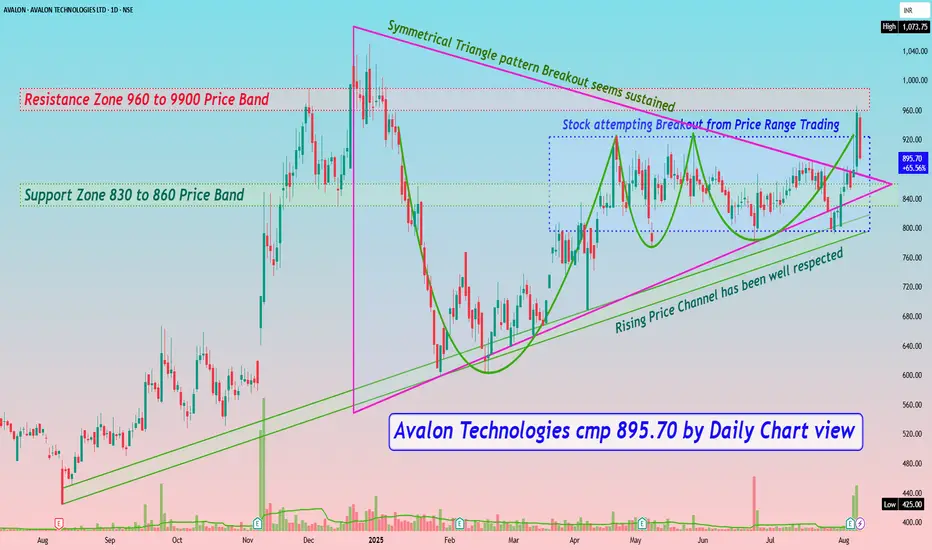
Avalon Technologies cmp 895.70 by Daily Chart viewAvalon Technologies cmp 895.70 by Daily Chart view
- Support Zone 830 to 860 Price Band
- Resistance Zone 960 to 9900 Price Band
- Rising Price Channel has been well respected
- Stock attempting Breakout from Price Range Trading
- Symmetrical Triangle pattern Breakout seems sustained
- Repeated Bullish Rounding Bottoms under Resistance Zone neckline
- Volumes spiked heavily at end of week and above average traded quantity
- Positively trending Technical Indicators BB, EMA, MACD, RSI,SAR, SuperTrend
Cup and Handle chart patternThis chart pattern is shaped like and resembles like a cup and handle that's why its named the same as cup and handle chart pattern.
Shape:
A “U” shaped bottom is preferred over a “V” shaped bottom as it indicates more consolidation. Ideally, the highs on either side of the cup should be equal.
Duration of formation:
The cup can take anywhere from 1 to 6 months to form, while the handle should take 1-4 weeks.
Confirmation:
The pattern is confirmed as bullish when the price breaks above the previous highs (the neckline) with strong volume. A buying opportunity arises when the price moves above the old resistance level (right side of the cup).
Volume:
Volume should decrease as prices fall to form the base of the cup and remain below average. As the price begins to rise again, volume should increase.
Target:
The profit target is calculated based on the depth of the cup. Measure the distance from the bottom of the cup to the neckline and extend that distance upward from the breakout level.
Also it can give sometimes three times of depth of the cup.
Risk Management:
A stop-loss can be placed at the bottom of the handle or below a swing low within the handle if there were multiple price oscillations.
I am not sebi registered analyst. My studies are for educational purpose only. Please Consult your financial advisor before trading or investing. I am not responsible for any kinds of your profits and your losses.
Thanks
RK💕
Most investors treat trading as a hobby because they have a full-time job doing something else.
However, If you treat trading like a business, it will pay you like a business.
If you treat like a hobby, hobbies don't pay, they cost you...!
Disclaimer and Risk Warning.
The analysis and discussion provided on in.tradingview.com is intended for educational purposes only and should not be relied upon for trading decisions. RK_Charts is not an investment adviser and the information provided here should not be taken as professional investment advice. Before buying or selling any investments, securities, or precious metals, it is recommended that you conduct your own due diligence. RK_Charts does not share in your profits and will not take responsibility for any losses you may incur. So Please Consult your financial advisor before trading or investing.

Shalby Bullish Inverted Head & Shoulder Breakout on weekly chartShalby NSE:SHALBY has given a Bullish Inverted Head & Shouldwe Brekout. Breakout Level already tested.
So one can look into it to make bullish postion. Entry@128, Target@141 and StopLoss@123. Stop should be followed on weekly closing basis NSE:SHALBY
