Canara Bank cmp 154.87 seen by the Monthly Chart view since listCanara Bank cmp 154.87 seen by the Monthly Chart view since listed
- Support Zone 129 to 142 Price Band
- Resistance Zone 155 to ATH 164.22 Price Band
- Bullish Cup and Handle Breakout done above Support Zone
- Stock Price ready for New ATH beyond current ATH 164.22 level
- Double Bullish patterns of Rounding Bottom inclusive of Cup and Handle
- Basis both Technical Chart patterns, the logical target price comes to +/- 300
Bullishchartpatterns

Sai Life Sciences cmp 921.70 by the Daily Chart view since listeSai Life Sciences cmp 921.70 by the Daily Chart view since listed
- Support Zone 865 to 895 Price Band
- Resistance Zone 923 to ATH 943 Price Band
- Volumes are regularly spiking well above the average traded quantity
- Darvas Bos Setup seems like repeated basis the current technical chart setup
- Rising Price Channels are in good sync to each other at ending and fresh new start
- Considerate Bullish Rounding Bottoms and/or Rising VCP pattern, as one may interpret
- Darvas Box Setup : Stock trending within 845 to ATH 943 price band since ATH on 25-Aug-2025

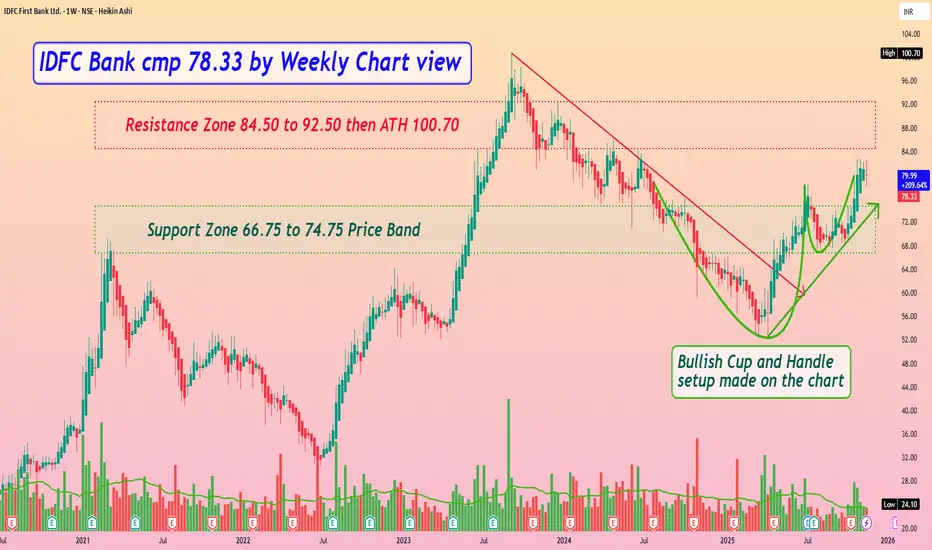
IDFC Bank cmp 78.33 by Weekly Chart viewIDFC Bank cmp 78.33 by Weekly Chart view
- Support Zone 66.75 to 74.75 Price Band
- Resistance Zone 84.50 to 92.50 then ATH 100.70
- Bullish Cup and Handle setup made on the stock chart
- Volumes are in good sync with the average traded quantity
- Rising Support Trendline well sustained and trending positively
- Resistance Zone Breakout by increased volumes to pave way for New ATH
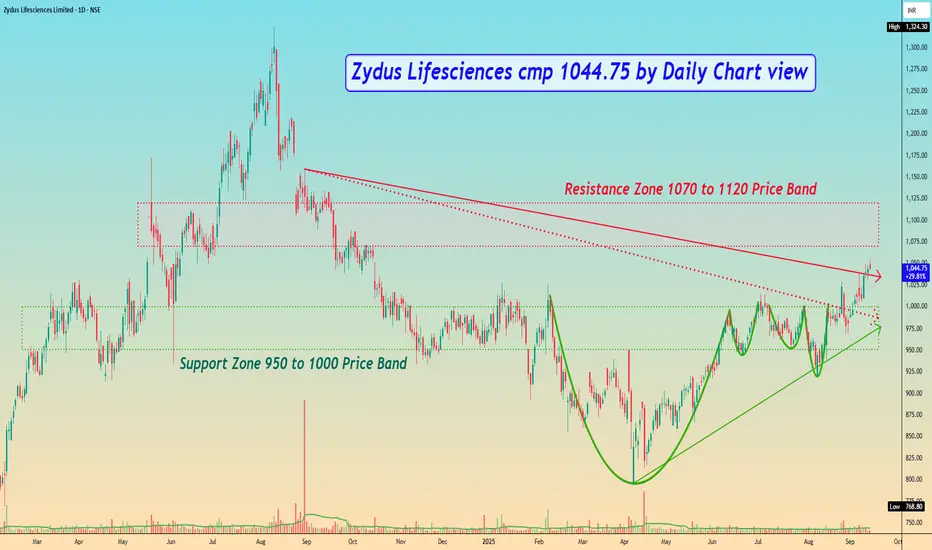
Zydus Lifesciences cmp 1044.75 by Daily Chart viewZydus Lifesciences cmp 1044.75 by Daily Chart view
- Support Zone 950 to 1000 Price Band
- Resistance Zone 1070 to 1120 Price Band
- Falling Resistance Trendline Breakout seems sustained
- Bullish Cup and Handle done by Support Zone neckline
- Bullish Rounding Bottoms made by Support Zone neckline
- Volumes seem getting in close sync with average traded quantity
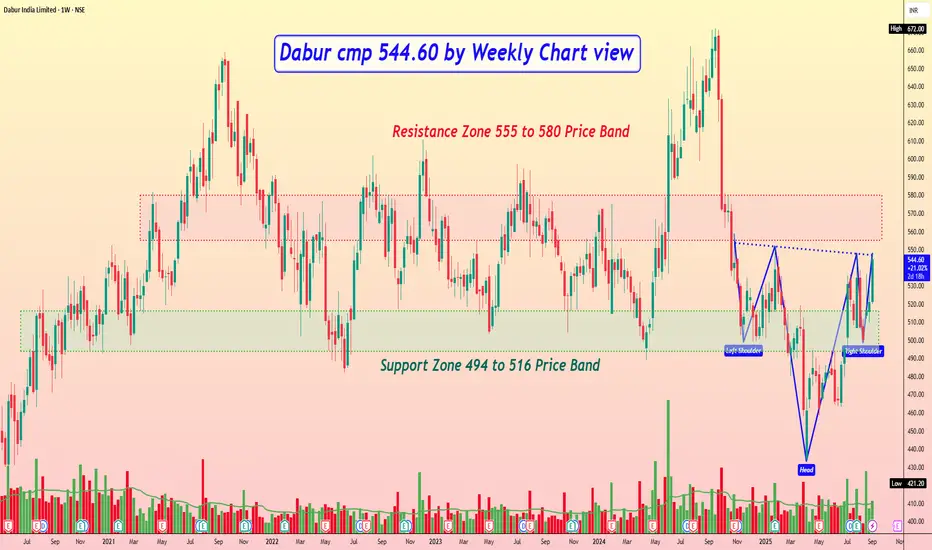
Dabur cmp 544.60 by Weekly Chart viewDabur cmp 544.60 by Weekly Chart view
- Support Zone 494 to 516 Price Band
- Resistance Zone 494 to 516 Price Band
- Breakout probable basis ongoing Support Zone test retest
- Closely considerate Bullish Head & Shoulders with Resistance Zone neckline
- Volumes are seen spiking well above average traded quantity over the past few weeks
- Favorably trending Technical Indicator signals shown by BB, EMA, MACD, RSI, SuperTrend
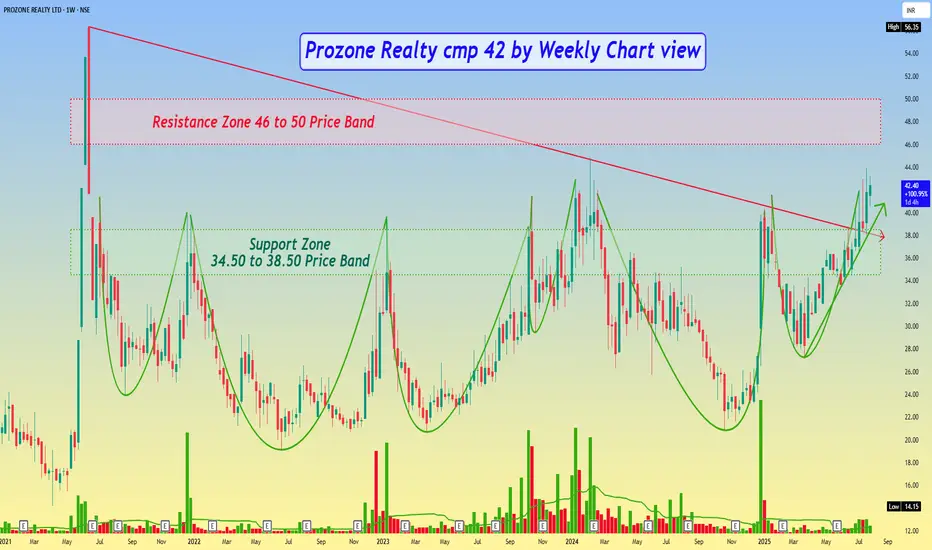
Prozone Realty cmp 42 by Weekly Chart viewProzone Realty cmp 42 by Weekly Chart view
- Support Zone 34.50 to 38.50 Price Band
- Resistance Zone seen at 46 to 50 Price Band
- Falling Resistance Trendline Breakout has well sustained
- Support Zone got tested retested over the past few weeks
- Multiple Bullish Rounding Bottoms made around Support Zone
- Volumes are well above average traded quantity over past few weeks