CDSL | Bullish Marubozu + RSI Breakout + Volume Expansion📈 CDSL | Bullish Marubozu + RSI Breakout + Volume Expansion 🚀
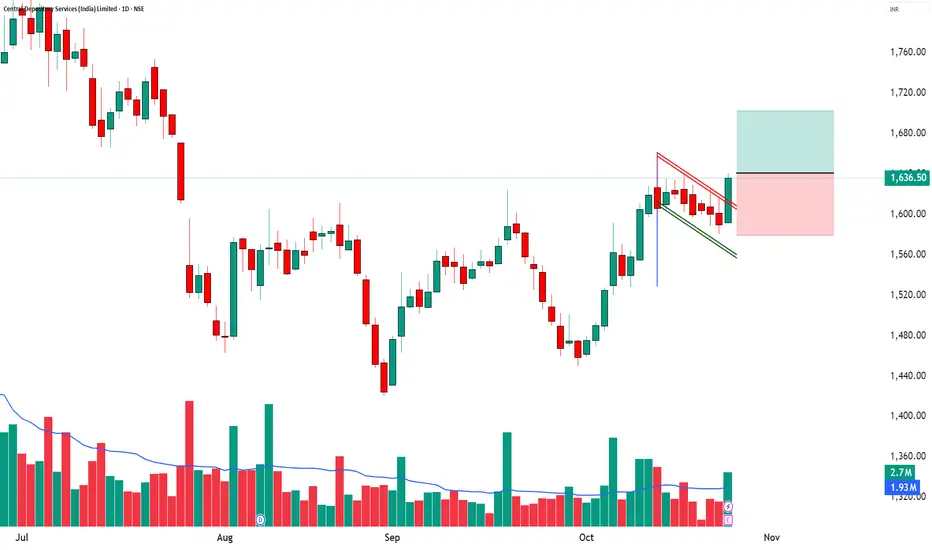
🔹 Entry Zone: ₹1,636.50 – ₹1,641.00
🔹 Stop Loss: ₹1,579.25 (Risk ~61 pts)
🔹 Supports: 1,605.33 / 1,574.17 / 1,556.33
🔹 Resistances: 1,654.33 / 1,672.17 / 1,703.33
🔹 Swing Demand Zone: ₹1,593.40 – ₹1,581.00
🔹 Intraday Demand Zone: ₹1,593.40 – ₹1,588.00
🔑 Key Highlights
✅ Bullish Marubozu Candle – clear sign of buyer dominance
✅ RSI Breakout – momentum strength confirmation
✅ Volume Surge (1.4x avg) – strong institutional participation
✅ Bollinger Squeeze-Off – breakout + volatility expansion expected
✅ VWAP Alignment – price sustaining above average buyer level
🎯 STWP Trade View
📊 Momentum supports a short-term bullish continuation. A decisive close above ₹1,654 may open the path toward ₹1,672–₹1,703.
⚠️ The ₹1,605–₹1,574 zone offers positional strength, while ₹1,593–₹1,588 acts as an intraday demand pocket for re-entry or dip-buying opportunities.
💡 Learning Note
This setup shows how combining price action (Marubozu) with RSI breakout and volume confirmation enhances conviction. Identifying multi-timeframe demand zones allows traders to plan entries with better precision and controlled risk.
Final Outlook: Momentum: Strong, Trend: Bullish, Risk: Low, Volume: High
________________________________________
________________________________________
⚠️ Disclosure & Disclaimer – Please Read Carefully
The information shared here is meant purely for learning and awareness. It is not a buy or sell recommendation and should not be taken as investment advice. I am not a SEBI-registered investment adviser, and all views expressed are based on personal study, chart patterns, and publicly available market data.
Trading—whether in stocks or options—carries risk. Markets can move unexpectedly, and losses can sometimes exceed the money you have invested. Past performance or past setups do not guarantee future results.
If you are a beginner, treat this as a guide to understand how the market works and practice on paper trades before risking real money. If you are experienced, always assess your own risk, position sizing, and strategy suitability before entering trades.
Consult a SEBI-registered financial adviser before making any real trading decision. By engaging with this content, you acknowledge full responsibility for your trades and investments.
Position Status: No active position in CDSL at the time of analysis.
Data Source: TradingView & NSE India (Past Chart Reference) (Historical levels)
💬 Found this useful?
🔼 Give this post a Boost to help more traders discover clean, structured learning.
✍️ Drop your thoughts, questions, or setups in the comments — let’s grow together!
🔁 Share with fellow traders and beginners to spread awareness.
👉 “If you liked this breakdown, follow for more clean, structured setups with discipline at the core.”
🚀 Stay Calm. Stay Clean. Trade With Patience.
Trade Smart | Learn Zones | Be Self-Reliant 📊
Bullishmarubozu
Tata Elxsi | Volume Breakout with Key Supports & Resistances📌 Tata Elxsi Ltd. – Closing Price: ₹5,843.50
📊 Technical Indicators Explained
Tata Elxsi is showing strong technical signals. A 20-day volume breakout 🚀 suggests big participation from traders, while a Bullish Marubozu candle 🔥 confirms strong buying momentum. The stock is clearly building momentum 💹, with possible target zones 🎯 based on Fibonacci levels. A short-term setup 📈 is visible as momentum indicators turn positive. The RSI breakout ⚡ shows renewed strength, and both SuperTrend and VWAP 🟢 are aligned on the bullish side, further adding confidence to the current breakout.
________________________________________
📈 Bullish Case – Why the stock could go up
Strong Bullish Marubozu Candle indicates momentum revival.
Breakout supported by high volumes – sign of institutional interest.
RSI & VWAP trending positive, confirming strength.
Fibonacci levels indicate potential upside zones towards ₹6,300 – ₹7,250+.
📉 Bearish Case – Potential downside risks
Any failure to sustain above ₹5,770 could trigger profit booking.
Broader market weakness or sector sentiment may weigh.
A break below ₹5,500 would weaken the bullish structure.
⚡ Momentum Case – Short-term Trading Edge
20-Day Volume Breakout highlights strong trader participation.
RSI breakout + SuperTrend signal indicate momentum strength.
Sustaining above ₹5,900–₹6,000 may lead to further positive movement towards higher levels.
📊 Support & Resistance Levels
Resistance Zones: ₹5,939 | ₹6,034.5 | ₹6,209
Support Zones: ₹5,399 | ₹5,494.5 | ₹5,669
📅 Short-term vs. Long-term Perspective
Short-term: Key resistance zones to watch are around ₹6,200 – ₹6,735, while support lies near ₹5,500.
Long-term: The stock remains in a structural uptrend. Any dip towards ₹5,200–₹5,400 may act as accumulation zones for investors with a longer horizon.
✅ Conclusion: Tata Elxsi has shown a strong breakout backed by volume & momentum.
👉 The stock is at an important juncture — while short-term traders may track key momentum levels, long-term investors can view dips as opportunities within the broader uptrend.
⚠️ Disclaimer – Please Read Carefully
The information shared here is meant purely for learning and awareness. It is not a buy or sell recommendation and should not be taken as investment advice. I am not a SEBI-registered investment advisor, and all views expressed are based on personal study, chart patterns, and publicly available market data.
Trading — whether in stocks or options — carries risk. Markets can move unexpectedly, and losses can sometimes exceed the money you have invested. Past performance or past setups do not guarantee future results.
If you are a beginner, treat this as a guide to understand how the market works — practice on paper trades before risking real money. If you are experienced, always assess your own risk, position sizing, and strategy suitability before entering trades.
Consult a SEBI-registered financial advisor before making any real trading decision. By engaging with this content, you acknowledge full responsibility for your trades and investments.
💬 Found this useful?
🔼 Give this post a Boost to help more traders discover clean, structured learning.
✍️ Drop your thoughts, questions, or setups in the comments — let’s grow together!
🔁 Share with fellow traders and beginners to spread awareness.
👉 “If you liked this breakdown, follow for more clean, structured setups with discipline at the core.”
🚀 Stay Calm. Stay Clean. Trade With Patience.
Trade Smart | Learn Zones | Be Self-Reliant 📊

Radico Khaitan, Buying Opportunity..!!As of 20/5/21
Current Trend: Sideways
Resistance levels: Around 566 price levels (Broken today with volume)
Patterns formed: Flag pattern
Single candlestick pattern: Bullish marubozu
RSI: 66
MACD: Short line over Long line
Analysis: Flag pattern's upper resistance level, as well as horizontal resistance level, is broken on 20/5/21 with very high volume and a bullish marubozu candlestick pattern is also formed. Moreover, RSI is above 60 and MACD is also giving a positive signal. 5 Day MAE is also above 13 days and 26 days Exponential moving average.
All such indications suggest going for a long position (Buy).
**A slight correction can be seen in the stock price in the coming days up to 578-580 levels before moving in the upward direction.
Stoploss should be around horizontal resistance level.. ie. 565-567 price levels.
The initial Target can be up to 10%.
NOTE: Buy the stock only when the overall market is positive. If the market tomorrow opens negative, then chances are that the stock will correct up to the mentioned level.
Feel free to comment below your ideas..
