STAR Price Action1. Set up - Breakout
2. Trend - Bullish
3. Entry is late by a day, but missed this chart yesterday, so RR is reduced with todays gain
4. Probable rounding pattern formation
Bullishpattern

BANKINDIA Pattern trade set up1. Trend - Bullish
2. Set up - Cup & Handle
3. weekly & daily both time frame has cup & handle
4. Pattern target profit levels are 207+ but there could be further upside.
5. This is pyramid set up 123.65 first entry levels

JINDALSTEL Cup & Handle pattern trading set up1. Set up - Cup & Handle breakout
2. Trend - Bullish
3. Price Trading at 52 weeks high
4. Over all structure bullish

UNIONBANK Price Action1. Set up - Breakout
2. Trend - Bullish
3. Strength - strong, as pull back
4. Rounding pattern TP is reached too

Silver - Trendline Longs Silver retested the Trendline bulls - on 75m chart.
Strong Support - $74
R1 $75.50-$76.50
R2 $77.5-$78.0
Close above $79 Bulls r in full control
10-12% up move from there should be overnight.
Buy at CMP $76
SL $74 on daily close.
If can’t wait for daily close System SL $73.50 for not getting out in SL hunt.

about to break📈 Hindustan Copper | Strong Rally → Resistance Zone
Hindustan Copper has delivered a sharp multi-week rally and is now facing resistance near the ₹560–575 zone, which aligns with a major historical supply area.
🔍 Technical Summary:
* Massive breakout from long-term base (Weekly)
* Vertical up-move → momentum exhaustion signals
* Intraday & daily charts show selling pressure near resistance
* Healthy consolidation / pullback expected after sharp run
📊 Current View:
* Zone ₹560–575 = Major resistance
* Fresh breakout only on strong close above ₹580
* Support to watch on pullbacks: ₹520–500
📌 Status: Rally Extended | Caution Advised
⚠️ Disclaimer: Educational purpose only. Not financial advice.
#HindustanCopper #ProfitBookingZone #StockMarketIndia #RallyStock #TechnicalAnalysis #SwingTrading #PriceAction #IndianStocks

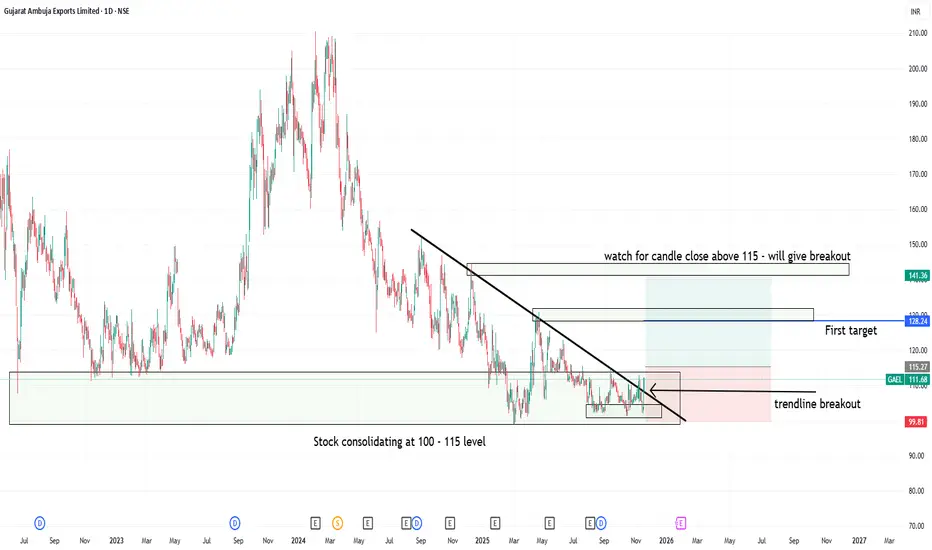
Trendline breakout at support level in GAEL1. Gujrat ambuja export lt- showing consolidation at 100 to 115 levels
2. Candle close above 115 can trigger consolidation breakout at strong support zone
3. Trendline breakout has already happend but above 115 close will be safe and logical
4. Good Risk:Reward one can watch for upside movement with strict sl level
JNJ Price Action set up1. Set up breakout
2. Trend - Bullish
3. Strength strong
4. pull back entry would be more logical here, to have small SL
5. Protected lows are intect shows the strength of a trend

GS Pure price action set up1. Set up - reversal from support
2. Trend Bullish
3. Strength - strong, price is close to its high
4. False breakout hunted the SL's and sharp momentum came

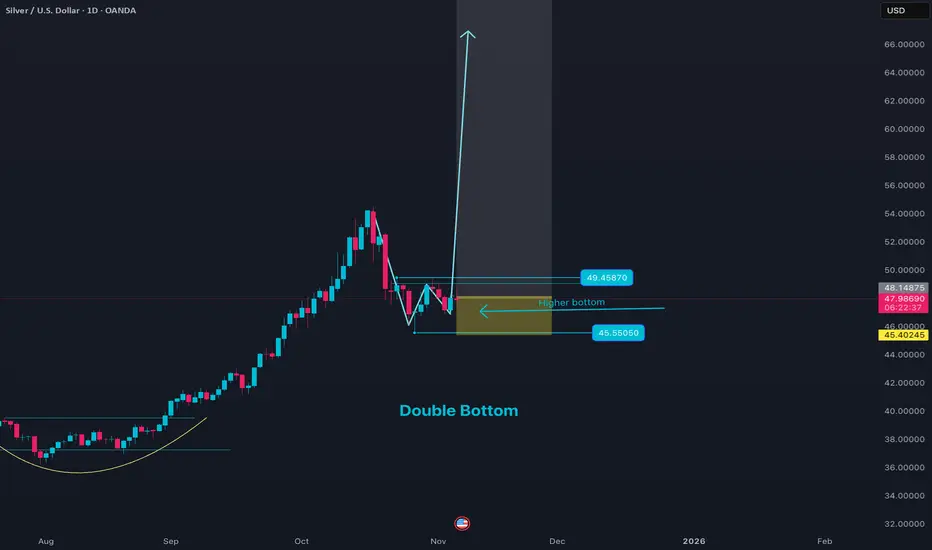
Silver Price Action set up with double bottomThe current price analysis for XAGUSD (Silver against US Dollar) in early November 2025 reveals a mixed but cautious outlook. Silver prices are moving within a corrective phase after exiting a bullish channel, trading approximately in the $47.50 range. Technical indicators such as moving averages currently suggest a bearish to neutral trend, with the price testing key resistance levels around $48.45.
Price momentum shows attempts to push higher, but resistance near $48.45 may lead to a price pullback or consolidation. If silver breaks above the critical resistance at $50.45, it could signal a renewed upward trend targeting levels around $52.35. Conversely, a failure to hold support near $46.75-47.00 may accelerate declines towards below $41.45, indicating a bearish phase.
Fundamentally, silver is influenced by the strength of the US dollar, industrial demand recovery (notably from solar energy and electronics sectors), and safe-haven buying amid global market uncertainty. The metal’s sensitivity to Federal Reserve policy and economic indicators continues to drive short-term volatility.
Traders should watch for sustained moves beyond the $48-$49 resistance or breakdown below $46.75 to gauge next directional trends. Overall, silver price dynamics suggest potential for both short-term rallies and corrections, dependent on macroeconomic cues and technical breakouts.
RBL pyramid entry set up1. Set up: Reversal with double bottom
2. continuation trend
3. Price showing reversal from equilbrium
4. Formation of rounding pattern

DREDGECORP Price Action1. Trend Bullish
2 Set up - Breakout
3. Pattern - roudning patterns
4. Trend & Breakouts supported with the Volume

RAJRATAN Price Action1. Set Up - Breakout
2. After false breakout price recovered veruy sharply,
3. Similar structure is being formed in Index as well
4. Price is showing turn around strength

Madras Fertilizers cmp 80.25 by Daily Chart viewMadras Fertilizers cmp 80.25 by Daily Chart view
- Support Zone 76.25 to 79.25 Price Band
- Resistance Zone 83.50 to 87.50 Price Band
- Bullish *W* upwards inclined by the Resistance Zone neckline
- Falling Resistance Trendlines, 1st Breakout done, next coming soon
- Volumes spiked heavily last week Thursday by demand based buying

Silver price action1. Silver is consolidating after the last profit booking
2. Some kind of strength is being noticed
3. Big trend can be caught with entries in smaller time frame, few SL may hit, but RR will be extraoridinarily rewarding.

Inox Wind | Potential Reversal from 200 EMA Support (Study)Inox Wind is currently trading near its 200 EMA, which is acting as a strong long-term support zone on the weekly chart.
Key observations:
Price is respecting 200 EMA support
Formation of a falling trendline — breakout above it can change structure
Selling pressure looks exhausted near support
Risk–reward looks favorable at current levels
If price holds above the 200 EMA and shows confirmation, this could lead to a trend reversal with opportunities for short-term to long-term upside.
Levels to Watch
📍 Support: 200 EMA zone
📈 Immediate Resistance: Trendline breakout area
🎯 Upside Targets (if breakout sustains):
₹158
₹199
₹257 (long-term view)
Note / Disclaimer
⚠️ This is only a technical study, not a buy or sell recommendation.
Please do your own research and manage risk properly.

HINDALCO Price Action ## HINDALCO Price Analysis (August 2025)
### Price & Market Metrics
- **Current share price:** ₹700.50 (NSE, as of August 13, 2025).
- **Market capitalization:** Approximately ₹1,574 billion (₹1.57 lakh crore).
- **52-week price range:** ₹546.45 (low) to ₹772.65 (high).
- **Day's trading range:** ₹670.95 to ₹704.95 on the latest session.
- **Price change:** Up about 5.01% from previous close.
### Returns & Volatility
- **1-week price change:** Approximate gain of 2.29%.
- **3-month price change:** About 10.36% gain.
- **6-month price change:** Around 16.27% gain.
- The stock shows moderate volatility consistent with general metals sector trends.
### Valuation Metrics
- **Price/Earnings (P/E) ratio:** Approximately 9.2, which is relatively attractive for the sector.
- **Earnings Per Share (EPS):** ₹76.11.
- **Price/Book (P/B) ratio:** Around 1.2.
- **Dividend yield:** Low, close to 0.7%.
### Financial & Business Highlights
- Hindalco has exhibited a strong revenue growth, with a recent annual revenue growth rate beating its past three-year CAGR.
- The company maintains control over its interest and employee expenses relative to operating revenues, with interest cost at about 1.43% of revenue.
- It operates in the metals and non-ferrous sector with a broadly positive market sentiment.
- The company recently held a board meeting focused on quarterly results, indicating active management and transparency.
### Technical & Sentiment Overview
- The recent price momentum is upward, with the stock closing near its higher range for the year.
- Volume traded is robust, reflecting active interest among investors.
- Technical charts indicate some bullish candle formations recently.
***
### Summary
Hindalco Industries is trading near ₹700, well within its 52-week range and showing resilient upward momentum backed by solid earnings and reasonable valuation multiples. The P/E ratio near 9.2 suggests the stock is relatively undervalued compared to many peers in the sector, supported by stable profitability and manageable expenses. Dividend yield is modest, reflecting a growth-oriented capital allocation approach.
The company’s strong operational performance, with revenue outpacing historical averages, combines with positive technical signals to offer confidence for investors. Moderate volatility and sector conditions should be considered, but overall the valuation appears attractive given Hindalco's bulk steel and aluminum markets exposure and growth trajectory.
Investors should watch for quarterly financial updates and sector dynamics for ongoing assessment.

WELSPUNLIV | Weekly chart study | OpportunityWelspun Living in very well pinned as a short-term technical highlights, backed by a strong breakout structure on higher timeframes.
🔹 Key Points
📈 Buy Zone: ₹142 – ₹145
🎯 Targets: ₹162 – ₹170
🚨 Stop-Loss: ₹134
⏳ Expected Duration: 3–4 weeks
📈 Why This Setup Looks Bullish
✔️ Trendline Breakout:
The stock has broken above a long-term downward trendline on the weekly chart, signalling the end of a corrective phase and the beginning of a fresh upward move.
✔️ Volume Confirmation:
The breakout is supported by rising volumes, indicating strong buyer participation and institutional interest.
✔️ Momentum Turnaround:
RSI has broken out of its own downtrend, confirming improving momentum and increasing bullish strength.
📌 What This Means for Traders
The structure favours short-term momentum continuation rather than a long-term investment.
If the setup plays out, the stock offers a potential upside of ~13%–18% from the this zone.
Strict adherence to the stop-loss is essential to manage downside risk.
⚠️ Note
This is a technical study only, based on price action and indicators.
Not a long-term recommendation.

NIFTY Buy-on-Dips | 26,000 CE Opportunity for Jan 6NIFTY continues to show bullish strength, and the broader structure favors a buy-on-dips approach for today, 2nd January 2026.
📌 Trade Setup (Options):
Instrument: NIFTY 26,000 CE (6th Jan Expiry)
Buy Zone: ₹180 – ₹170
Target: ₹240
Risk Level: ₹140 (must hold on closing basis)
As long as ₹140 remains intact, the bullish momentum stays valid. A dip into the mentioned buy zone could offer a low-risk, high-reward opportunity aligned with the current trend.
⚠️ Trade with strict risk management and adjust position sizing accordingly.
📌 Disclaimer:
This analysis is for educational purposes only and is not financial advice. Always manage risk and follow your trading plan.
Your feedback drives our content and keeps everyone trading smarter. Let’s make those pips together! 🚀
Happy Trading,
– The InvestPro Team

FEDFINA Price ActionFEDFINA is in a steady uptrend with price holding above key moving averages and momentum indicators in the positive zone, but it is close to near-term resistance so risk‑reward for fresh entries is moderate rather than aggressive

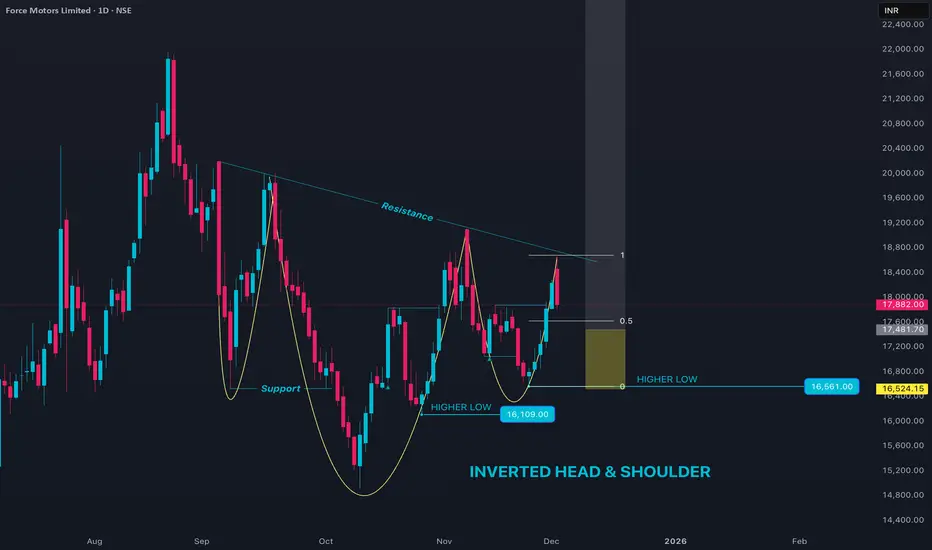
FORCEMOT Reentry set up1. Trend Bullish
2. High low protected
3. Set up: Inverted H&S
4. Price retracing from resistance
5. RR: 10+RR
CRAFTSMAN Cup & Handle Price Action1. Trend Bullish
2. Set up: Cup & Handle
3. Strength - Strong with tight consolidation
4. RR is 49% TP potential

Hindustan Copper BullishNovember quarter report revenue reported- 7.18B
After a long down trend now stock is break all time high on 26 dec 2025.
Technical Analysis: after breakout stock take retracement at 225 and make a sustain up move tillrange 325-365.
support range 285-400
You can enter here 464 with a stoploss of range 285-400,
Buying Zone range : 285-400
