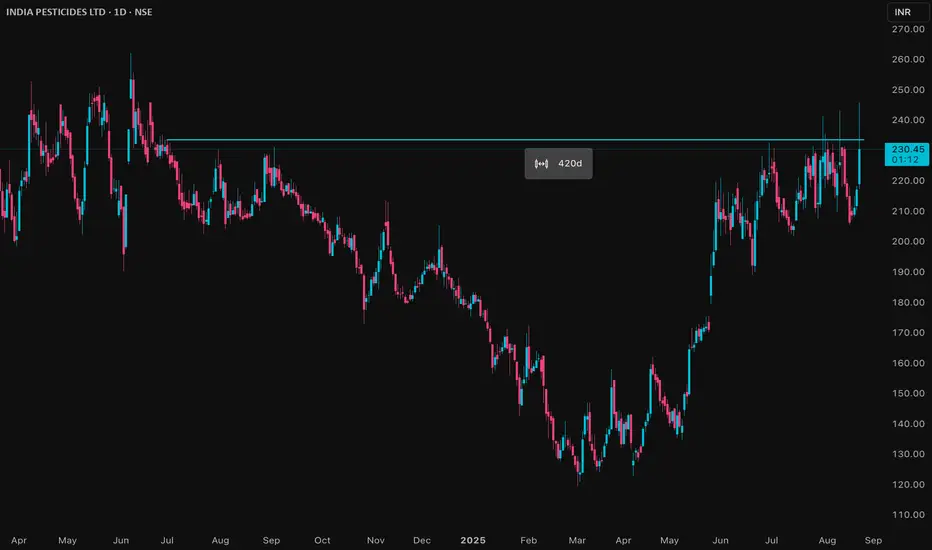
IPL Price ActionIndia Pesticides Ltd (IPL) is trading at ₹217.3 as of August 21, 2025. The stock has shown impressive strength recently, with a gain of 9% today and an intraday high of ₹238.5. It is just 3% below its 52-week high of ₹244.25, reflecting its robust upward momentum.
Over the last six months, IPL has surged by nearly 65% and is up 4% for the past year, outperforming major indices. The company's valuation stands at a PE ratio of 25 and a price-to-book (PB) ratio of 0.36, which is moderate for the agro-chem sector.
Operationally, IPL remains almost debt free and has recently expanded its manufacturing capacity, which could support further growth. The company’s return on capital employed (ROCE) is about 13%, with a return on equity (ROE) of around 9.5%. Key strengths include solid financials, improved sales, and sector-wide optimism.
Trading volumes are strong, and IPL is above all major moving averages, signaling bullish sentiment. Support is seen near ₹206–₹208, while resistance is close to ₹244 (recent high).
In summary, IPL continues to display strength, buoyed by expansion efforts and solid financial metrics. Momentum and technical indicators favor further upside if broader market conditions remain supportive.
Bullishpattern
NAVA Price Analysis
## Current Price and Trend
NAVA Limited is trading near ₹610, showing resilience after a period of strong rally. The price action exhibits momentum and relative strength compared to industry peers and the overall market. Despite some weekly volatility, the trend over the past year has been decisively upward, with gains of around 50%.
## Volatility and Performance
- **Volatility:** NAVA is moderately volatile, with typical weekly movements near 6%. This is in line with industrial sector averages, making it a relatively stable performer among mid-cap stocks.
- **Performance:** Over the last year, NAVA's price has surged over 57%, vastly outperforming the broader Indian industrial sector and market averages.
- **Long-Term Growth:** The stock has delivered impressive multi-year returns, far exceeding the sector, and momentum remains positive as of the most recent quarter.
## Valuation
- NAVA's price-to-earnings (P/E) and price-to-book (P/B) ratios are moderate. The P/E is around 16, and the P/B is close to 2, suggesting it is at a fair premium relative to book value but not excessively overvalued compared to growth stocks.
- The dividend yield stands at about 1.6%, offering modest income for investors.
## Financial Strength and Prospects
- The company recently reported record consolidated revenues, reflecting strong operational performance and expansion initiatives.
- Notably, profitability has eased in recent quarters due to operational inefficiencies and investment allocations, yet the financial position remains robust.
- Ongoing diversification into renewable energy and international projects, particularly in Africa, point toward sustained revenue streams and future growth opportunities.
## Risk Factors
- The stock is about 3.7 times as volatile as the Nifty index, which may be significant for risk-averse investors.
- Pending collections and recent dips in profitability highlight operational risks that warrant monitoring.
- While market optimism remains, questions persist regarding the efficiency of some recent investments and expansion plans.
## Summary
NAVA Limited demonstrates strong long-term growth, a solid market presence, and an optimistic outlook, tempered by recent profitability concerns and operational challenges. The stock's upward trajectory and moderate valuation could appeal to both growth-oriented and value-conscious investors, provided they are comfortable with its inherent volatility and sector-specific risks.

OPTIEMUS Price ActionOptiemus Infracom Limited (OPTIEMUS) is currently trading around ₹608 as of August 2025. The stock has shown a strong recent performance, gaining approximately 4% in the latest trading sessions, with daily price ranges between ₹585 and ₹625.
Over the past year, the stock price has fluctuated substantially, with a 52-week low near ₹378 and a high nearing ₹874. The current price sits closer to the mid-to-upper end of this range, indicating a recovery from lows but still beneath recent highs.
Financially, Optiemus Infracom has an earnings per share (EPS) of about ₹7.58. The price-to-earnings (PE) ratio stands elevated, above 80, which highlights strong market expectations for future growth or reflects a premium valuation often seen in technology or telecom-related firms.
The price trades above its 50-day average (~₹609) and 200-day average (~₹595), indicating a positive medium-term trend. Volume levels are moderate, consistent with stable investor interest.
While the stock has seen volatility, the trajectory suggests a gradual uptrend supported by its core business segments in electronics and telecommunications infrastructure. Key support is seen around ₹580, while resistance near ₹630 could test the strength of the ongoing rally.
In summary, Optiemus Infracom is positioned in an upward trading range with strong growth expectations, but valuation is relatively high, which should be monitored alongside company earnings and sector dynamics for future moves.

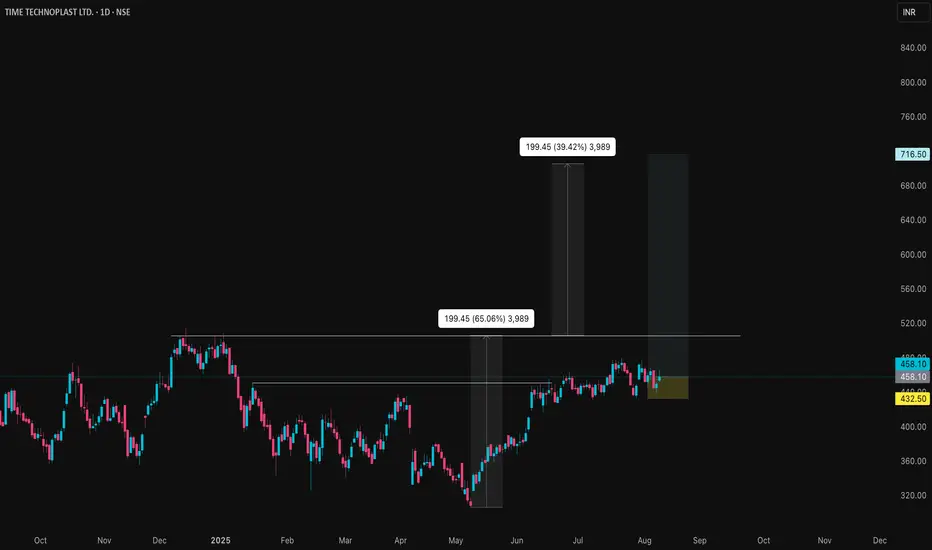
TIMETECHNO Price ction
### Market Metrics
- **Current share price:** ₹458.10.
- **Market capitalization:** ₹10,396crore.
- **52-week price range:** ₹306.60 (low) to ₹513.55 (high).
- **All-time low:** ₹17.55 (Feb 19, 2009).
- **All-time high:** ₹513.55 (Dec 13, 2024).
### Returns & Volatility
- **1-week change:** Down 1.98%.
- **1-month change:** Up 4.83%.
- **1-year return:** Up 43.18%.
- **Recent volatility:** Daily moves between ₹451.70 and ₹466.10 common.
- **Beta:** Not specified, but price swings indicate moderate volatility for sector.
### Valuation
- **Price/Earnings Ratio:** 26.79, above sector average.
- **Price/Book Ratio:** 3.88, also higher than sector average.
- **Dividend yield:** 0.55%.
### Company Fundamentals
- **Revenue (Trailing 12 months):** Approximately ₹54,570million.
- **Net profit margin:** 7.1%, improved over last year.
- **EPS (Trailing 12 months):** ₹17.10 (16.29% YoY growth).
- **Book value per share:** ₹118.21.
- **Return on Equity:** 13.3%.
### Growth & Profitability
- **Annual earnings growth:** 25% (past year), average 25.4% over 5 years.
- **Net profit for Q1 2025:** ₹10,952lakhs, up 18.6% YoY.
- **Free cash flow remains positive; margin improvement noted over 5 years.**
- **Return on assets:** 9.04%.
### Valuation Analysis
- **High PE and PB ratios indicate the stock is priced above sector averages.**
- **Recent buy recommendations from analysts; fair value status varies by source.**
### Qualitative Notes
- **Strong earnings and steady sales growth, but trading above intrinsic metrics.**
- **Growth momentum has slowed versus earlier years, though above industry norm.**
- **Stable dividend payout policy, but yield remains modest.**
- **Technical signals ranged from neutral to bullish in July and August 2025.**
**Summary:** The stock is trading at a high valuation given its growth history and sector performance. Investors should consider recent price corrections, volatility, and elevated PE/PB ratios before entering at current levels. The company maintains strong growth and profitability but is subject to valuation risk if sector trends reverse.
GOKULAGRO Price ActionGokul Agro Resources Ltd is currently trading around ₹333. The stock has recently gained close to 6% in a single session, reflecting strong bullish sentiment. The year-to-date performance is solid, with the price up substantially from its 52-week low of ₹193, and not far below the 52-week high of ₹377.
The company’s latest quarterly results showed significant sales growth, with March 2025 net sales up nearly 23% year-over-year and profit after tax also improving. The earnings per share (EPS) is about ₹17.9, and its price-to-earnings (PE) ratio stands near 18, which is reasonable for the sector. Book value per share is approximately ₹61.9, making the price-to-book ratio above 5, on the higher side for an agro-commodity company.
Gokul Agro’s upward momentum is backed by positive business results and optimism about the edible oils and agri-processing sector in India. The stock trades well above its 50-day and 200-day moving averages, confirming the uptrend. High trading volumes and active participation indicate continued interest from both institutional and retail investors.
Overall, Gokul Agro Resources is showing robust growth, supported by improved profitability and strong sector dynamics. The key levels to watch are support near ₹310 and resistance around ₹350–₹377. The outlook remains positive as momentum and earnings trends are both favorable.

GODFRYPHLP Price Action## Trend Overview
Godfrey Phillips India (GODFRYPHLP) is showing a volatile but overall bullish structure on the daily chart. The stock recently hit an all-time high near ₹9,645 and is currently trading around ₹8,687. After a strong rally over the past year, the price has entered a consolidation phase, with short-term corrections and profit booking visible.
## Price Action & Momentum
- The stock has gained over 100% in the last year, reflecting strong long-term momentum.
- In the short term, the price has pulled back from its peak and is trading below key resistance levels, indicating some selling pressure.
- Despite the pullback, the broader uptrend remains intact as the price is still above major moving averages.
## Technical Indicators
- **Moving Averages:** The daily price is above its 50-day and 200-day simple moving averages, supporting a positive long-term bias. Shorter-term averages (20-day and 50-day) are converging, suggesting consolidation.
- **Relative Strength Index (RSI):** The RSI is in the neutral zone, indicating neither overbought nor oversold conditions. This points to a potential pause or sideways movement before the next trend.
- **MACD:** The MACD indicator has shown a weak sell signal, but the overall momentum loss is mild, not confirming a strong reversal.
- **Bollinger Bands:** The price is in the lower half of the bands, suggesting a cooling-off period after a sharp rally. Volatility remains high.
## Support and Resistance
- **Immediate Support:** Around ₹8,500, where the stock has found buying interest in recent sessions.
- **Major Support:** Near ₹8,000, which coincides with the 50-day moving average and a previous breakout zone.
- **Immediate Resistance:** Near ₹8,900 to ₹9,000, which aligns with recent swing highs.
- **Major Resistance:** The all-time high at ₹9,645.
## Volume and Sentiment
- Recent sessions have seen higher volumes on down days, indicating profit booking.
- Long-term sentiment remains positive, but short-term traders are cautious due to the recent correction and volatility.
## Summary
GODFRYPHLP remains in a strong uptrend on the daily timeframe, but the current phase is marked by consolidation and profit-taking after hitting record highs. The price is holding above key supports, and as long as it stays above the 50-day moving average, the broader bullish structure is intact. Short-term movements may remain range-bound with a slight downward bias until a clear breakout above resistance or breakdown below support occurs. Risk management is advised due to elevated volatility.

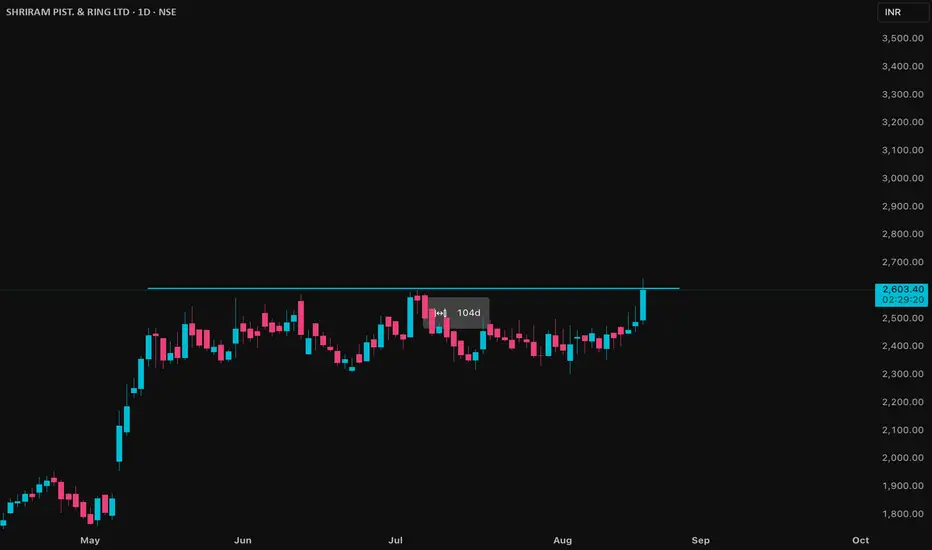
SHRIPISTON Price ActionHere are more detailed insights on Shriram Pistons & Rings Ltd (SHRIPISTON):
**Financial Performance:**
- For FY2025, revenue stood at ₹35.5 billion, up 15% year-on-year.
- Net income reached ₹5.07 billion, a growth of 14%, with a stable profit margin of 14%.
- Latest quarterly (Q1 FY26) income was ₹991.7 crore, up 12.8% sequentially and 14.9% year-over-year; profit after tax was ₹134.9 crore, up 15.8% QoQ and 15.1% YoY.
- EPS for Q1 FY26 was ₹30.40, up from ₹27.10 in the previous quarter.
**Growth & Forecasts:**
- The company’s earnings and revenue are expected to grow at roughly 13-14% per annum in the next few years.
- Return on equity is forecast to be about 21% in three years, signalling strong capital efficiency.
- Price target estimates from analysts suggest a potential move toward ₹3,050 in the medium term.
**Business Fundamentals:**
- Shriram Pistons is a leading manufacturer of pistons, piston rings, and engine components for the automotive industry, serving both domestic and export markets.
- Its customer base covers passenger, commercial, and industrial vehicle sectors.
- The company is consistently improving technology and manufacturing processes, supporting quality and competitive positioning.
**Recent Operational Trends:**
- The company reported 21.45% profit growth for the June 2025 quarter, though its debtors turnover ratio has declined, indicating comparatively slower collection of receivables.
- Operational efficiency is strong, but management is actively working on improving the receivables cycle.
- Dividend payout is regular, with a recent interim dividend of ₹5 per share declared.
**Sentiment & Outlook:**
- Investor and analyst sentiment remains positive, with strong fundamental and earnings performance backing the share price.
- Shares are currently trading near all-time highs following quarterly results and forward guidance; some volatility can be expected as profit booking takes place and the company works through receivables issues.
- The company is viewed favorably for its ability to outperform sector average growth rates and maintain robust profit margins.
**Technical Overview:**
- The stock is in a strong uptrend and trading above its major moving averages.
- Key support can be found around ₹2,000; a break above ₹2,600 could target the analyst consensus price of ₹3,050.
Shriram Pistons continues to show solid performance, sector leadership, and growth, though investors may watch for further improvements in cash flow and receivables management for sustained momentum.
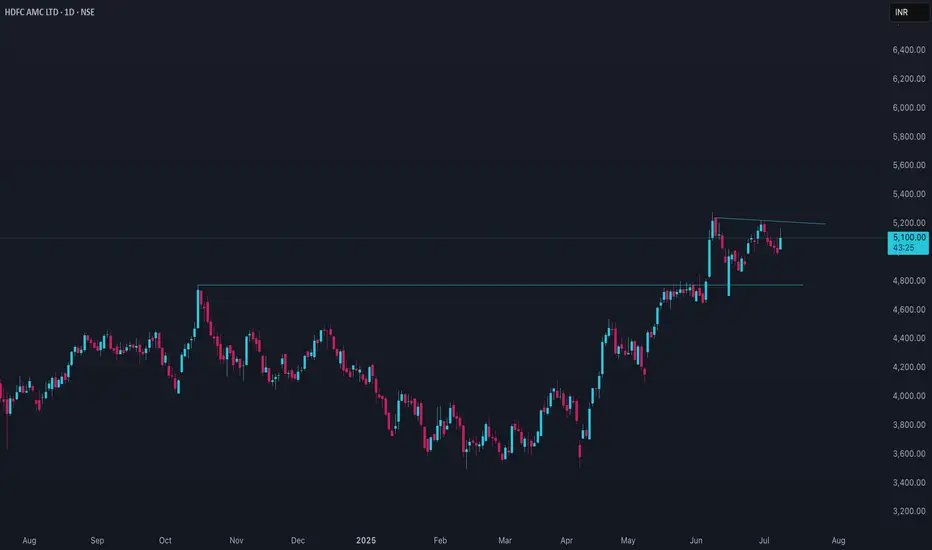
HDFC AMC price action### HDFCAMC Price Analysis
#### Current Price and Performance
- HDFC Asset Management Company (HDFCAMC) is trading near the ₹5,100–₹5,200 range as of early July 2025.
- The stock has shown notable volatility, with a 52-week high of around ₹5,279 and a low near ₹3,563.
- Over the past year, the stock has delivered a return of about 20%, with a strong rally in the last three months, rising over 30%.
- Short-term momentum has cooled, with the past week and month showing minor declines or sideways movement.
#### Trend and Technical Overview
- The price trend has been positive over the medium term, supported by strong quarterly results and robust assets under management growth.
- Recent technical signals indicate some consolidation, with analysts suggesting caution for new long positions unless the stock sustains above key resistance levels.
- The stock remains moderately volatile, with a beta above 1, indicating higher sensitivity to market movements.
#### Valuation and Financial Metrics
- HDFCAMC trades at a high price-to-earnings (P/E) ratio above 43 and a price-to-book (P/B) ratio above 13, reflecting premium valuations compared to sector averages.
- The dividend yield is around 1.8%, which is attractive for investors seeking regular income.
- The company has a strong balance sheet with zero debt and consistent revenue growth.
#### Market Sentiment and Outlook
- Analyst sentiment is cautiously optimistic, with most recommending holding or buying on dips.
- The company’s fundamentals remain strong, but the stock is considered overvalued by some metrics, suggesting limited immediate upside unless earnings growth accelerates.
- Upcoming earnings reports and market conditions will likely influence the next major price move.
#### Summary
HDFCAMC has demonstrated strong medium-term growth and profitability, but current valuations are high. The stock is consolidating after a sharp rally, and investors may consider waiting for a clearer trend or a better entry point. The long-term outlook remains positive, supported by the company’s market position and financial health.
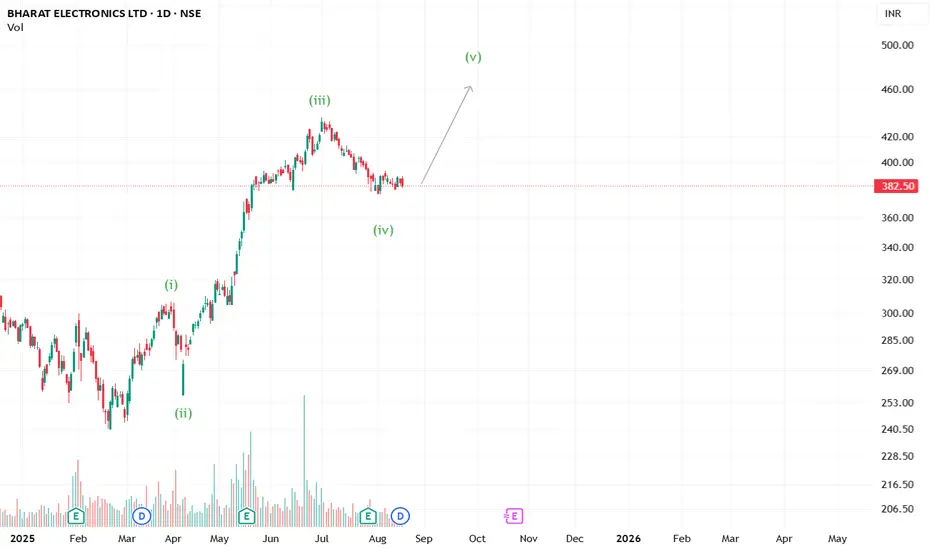
BEL Poised for Final Wave Up Surge after Forming a BaseElliott Wave structure suggests Bharat Electronics has completed its Wave (iv) correction, forming a base for a potential Wave (v) upside move toward fresh highs.
WABAG Price Action## VA Tech Wabag Ltd – Price Analysis (August 2025, without references)
### Price & Market Metrics
- Current share price is around ₹1,580 to ₹1,585.
- Market capitalization is close to ₹9,850 crore.
- The stock's 52-week price range is roughly ₹1,110 (low) to ₹1,944 (high).
- Daily trading range recently has been between ₹1,510 and ₹1,595.
- The stock is trading above both its 50-day (~₹1,525) and 200-day (~₹1,515) moving averages, indicating solid recent momentum.
### Returns & Volatility
- The stock has rebounded strongly from its lows near ₹1,110 over the past year.
- Price movements show moderate volatility typical for the infrastructure sector.
- Recent sessions saw gains around 3-4%, with intraday swings in the 2-5% range.
### Financial Performance & Growth
- Recent quarterly revenue growth stands around 17% year-on-year.
- EBITDA margin is stable at about 13%.
- Net profit increased by approximately 20% year-on-year in the latest quarter.
- Earnings per share (EPS) is near ₹10.5 for the latest quarter, up from about ₹8.8 a year ago.
- The company has a healthy order book valued around ₹15,800 crore, more than four times its annual revenue.
- Large ongoing projects in desalination and wastewater treatment support steady future revenue visibility.
### Valuation Metrics
- Price-to-Earnings (P/E) ratio is about 32.7, which is moderately above typical sector averages.
- Dividend yield is low, around 0.25%, typical for growth-focused infrastructure firms.
- The stock trades at a premium relative to intrinsic value estimates based on growth prospects and margin stability.
### Qualitative Notes
- The focus on engineering, procurement, construction (EPC), and operations & maintenance (O&M) in high-margin segments bodes well for margin improvements.
- Expansion into emerging markets in India, the Middle East, Africa, and CIS regions supports diversified growth.
- The company's net-cash position and free cash flow generation underpin financial stability.
- Analysts see a 15-20% revenue CAGR for the next several years, with steady EBITDA margin expansion.
### Technical & Sentiment Overview
- The stock has positive momentum and has recently sustained levels near multimonth highs.
- Trading volumes have been healthy, reflecting strong investor interest.
- Some historical negative return tendencies in August exist but current momentum seems intact.
***
### Summary
VA Tech Wabag Ltd is currently trading near ₹1,580, supported by solid financial growth, a robust order book, and stable margins. The valuation is moderately elevated with a P/E around 33, reflecting investor confidence in future growth. Profitability improvements and expansion into new markets enhance the outlook. While the dividend yield remains low, the company's focus on reinvestment and cash flow generation is positive. Investors should consider the stock's growth potential balanced against typical sector volatility and a premium valuation.
Overall, VA Tech Wabag presents a growth-oriented investment case with a strong revenue backlog, supportive operational fundamentals, and reasonable technical strength. Caution is warranted due to valuation premiums and historical seasonal volatility, but the outlook remains bullish.

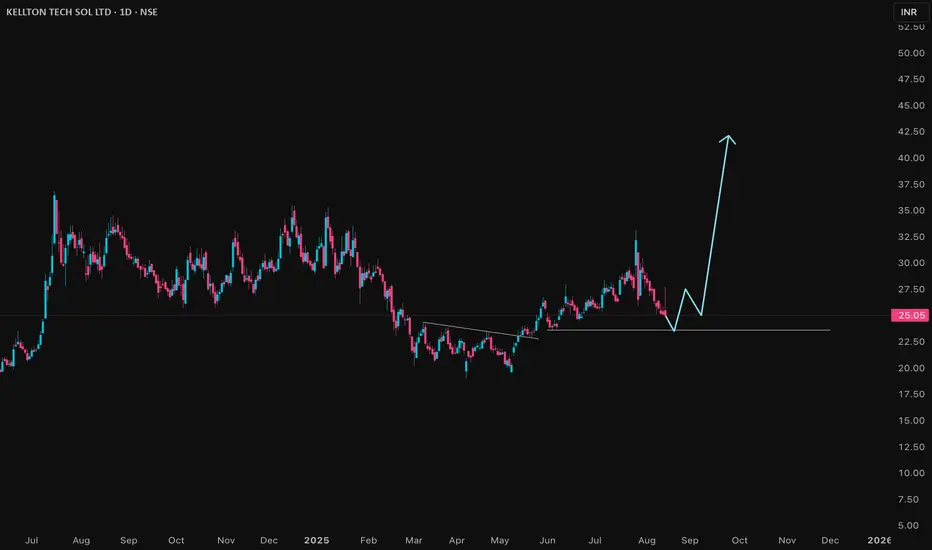
KELLTONTEC Price Action## Kellton Tech Solutions Price Analysis (August 2025)
### Price & Market Metrics
- Current share price: ₹25.01 (NSE).
- Market capitalization: Approximately ₹1,233 crore.
- 52-week price range: ₹19.00 (low) to ₹35.50 (high).
- Day's trading range recently: ₹24.80 to ₹27.70.
- Recent price change: Slight decline of about 0.48% on the latest trading day.
### Returns & Volatility
- The stock is down over 17% in the past year.
- Year-to-date in 2025, it is down about 8%.
- Despite a recent uptrend with a notable rally after Q1 FY26 results, the price remains approximately 22% below its 52-week peak.
- Daily price swings show moderate volatility.
### Financial Performance (Q1 FY26 Highlights)
- Revenue: ₹296.1 crore, up 12.8% year-on-year and 3.1% quarter-on-quarter.
- EBITDA: ₹35.8 crore, with a margin of 12.1%.
- Net profit: ₹22.7 crore, up 13.6% year-on-year and nearly 18% quarter-on-quarter.
- EPS: 1.63.
- Price/Earnings ratio: 15.34.
### Business & Growth Notes
- Kellton Tech is focusing on an AI-first strategy, enhancing capabilities in product engineering, data engineering, and cloud engineering.
- Major AI-related project wins in Q1 with global clients in beverages, health insurance, and travel technology.
- Operational milestones include launching an AI platform for intelligent automation and a zero-downtime migration project for large clients.
- The company participates in global conferences and has received recognition for AI tool performance improvements.
### Valuation & Sentiment
- The current P/E ratio of 15.34 indicates moderate valuation relative to earnings.
- The stock recently jumped nearly 10% after the strong Q1 FY26 results announcement.
- Analysts see Kellton Tech as positioning itself competitively within AI-powered IT solutions.
- Investor sentiment has improved due to earnings growth and strategic execution despite the stock being below its 52-week high.
### Summary
Kellton Tech Solutions is showing steady financial growth supported by a clear focus on AI-driven projects and strong client engagement. The stock trades at a moderate valuation with a P/E around 15 and has shown resilience with notable earnings growth. Though its price is below the yearly highs, recent operational achievements and project wins provide a positive outlook. Investors should watch for continued execution on AI strategies and monitor overall IT sector trends for sustained momentum.
JMFINANCIL Price Action ## JM Financial Limited – Price Analysis (August 2025)
### Price & Market Metrics
- Current share price: ₹186.95.
- Market capitalization: Approximately ₹17,875 crore.
- 52-week price range: ₹78.00 (low) to ₹189.90 (high).
- Day's trading range recently: ₹163.60 to ₹189.90.
- Significant price increase noted recently, with a 14.87% rise on the day observed.
### Returns & Volatility
- The stock has gained about 69% over the last 3 months.
- 12-month return is roughly 97%, showing strong growth.
- 3-year return stands near 182%.
- Recent intraday volatility with daily price swings within a wide range.
### Valuation Metrics
- Price/Earnings (P/E) ratio: Around 16.23.
- Earnings per share (EPS): ₹11.52.
- Price/Book (P/B) ratio: Approximately 1.52.
- Dividend yield: Around 1.46%.
### Financial & Business Notes
- The company has posted moderate sales growth (around 5% year-over-year as per last known data).
- Profitability remains solid with steady net income growth.
- Market sentiment has been strongly positive, driving recent price appreciation.
- Technical indicators show the stock trading well above its 50-day and 200-day moving averages, signaling bullish momentum.
### Summary
JM Financial is currently trading near its 52-week high with strong recent price performance and solid returns over multiple timeframes. The valuation metrics like P/E around 16 and P/B near 1.5 suggest relatively reasonable valuation for a financial services firm with stable profitability. The significant price gains recently reflect positive market sentiment and business fundamentals, though some volatility is present. Investors should consider the solid growth and moderate valuation in the context of overall sector and market conditions when evaluating the stock.

ITDCEM Price Action## ITD Cementation India Limited (ITDCEM) Price Analysis (August 2025)
### Price & Market Metrics
- **Current share price:** Around ₹793 (NSE, August 13, 2025).
- **Market capitalization:** Approximately ₹13,622 crore.
- **52-week range:** ₹467 (low) to ₹944 (high).
- **Day's trading range:** ₹762–₹804.
- **Recent price change:** Up about 4.5% on the day.
- **Average volumes:** About 762,000 shares traded daily in recent periods.
### Returns & Volatility
- The stock has seen a strong rebound from lows around ₹467 in the past year to near ₹793 currently.
- Price movements recently show moderate volatility within a range of about 5% intraday.
- The 52-week high near ₹944 was achieved recently in July 2025.
### Valuation Metrics
- Price/Earnings (P/E) ratio: Approximately 33.3, which is moderately high.
- Earnings per share (EPS): ₹23.83.
- Dividend yield is low at around 0.25%.
- The stock currently trades above its 50-day average price (~₹812) and significantly above its 200-day average (~₹612), indicating recent bullish momentum.
### Financial & Business Highlights
- ITD Cementation is in the infrastructure sector, focusing on construction and civil engineering.
- The company is supported by a solid order book and infrastructure demand growth.
- Market sentiment has been positive with institutional investor meetings scheduled mid-August 2025.
### Technical Sentiment
- The stock price has recently pulled back slightly from highs but remains strong overall.
- Moving averages suggest upward momentum.
- Volume patterns indicate active trading and buyer interest.
***
### Summary
ITDCEM is trading near its upper range for the year, with a current price around ₹793 and a strong market capitalization above ₹13,000 crore. The valuation is moderately high with a P/E above 30 and EPS near ₹24. Recent price momentum is positive supported by infrastructure sector tailwinds and investor interest. While the stock has experienced some volatility, the technical indicators point to sustained buying at current levels. Dividend yield remains low, consistent with growth-oriented infrastructure companies. Investors should consider valuation moderately stretched but justified by growth prospects and market position. Caution is advised for short-term price swings given past volatility.

SKIPPER Price Action## SKIPPER Price Analysis (August 2025)
### Price & Market Metrics
- Latest share price is approximately ₹538.75.
- Market capitalization stands around ₹6,074–6,085crore.
- The 52-week low is ₹341.55 (April 2025) and the high is ₹665.00 (December 2024).
- Recent price trend: Strong rebound from April lows, with current price near the top of the recent trading range.
- Day range on August 13: ₹505.10 – ₹538.20.
### Returns & Volatility
- 1-month gain: About 12%.
- 1-year return: Roughly 33–35%, outperforming broader indices and sector averages.
- 3-year return: Over 880%.
- Skipper often sees daily volatility in the 2–6% range, especially during August. Historically, Augusts show flat average returns but are characterized by abrupt price changes both upward and downward.
### Financial Performance
- Trailing 12-month EPS: ₹14.37.
- TTM net profit: About ₹158.9crore.
- Net sales for the last reported quarter (June 2025): ₹1,253.86crore, up 14.85% YoY.
- Consolidated net sales (March 2025): ₹1,287.75crore, up 11.64% YoY.
- Profit margin is moderate—company has low interest coverage and return on equity relative to valuation.
### Valuation
- P/E ratio: 35–37, well above sector average.
- P/B ratio: About 5.1.
- Dividend yield is very low, with most earnings retained.
- Book value per share: ₹105.69.
### Qualitative & Technical Notes
- The company’s growth is supported by solid export and infrastructure orders, but margins and returns remain modest compared to peers.
- Promoter holding is robust (around two-thirds of shares).
- Technical trend is positive, with outperformance versus sector and key moving averages, but sharp swings are common and corrections have occurred previously after strong rallies.
- Stock currently trades above estimated fair value and sector multiples.
***
### Summary
SKIPPER has rebounded powerfully from earlier lows and is now trading near multi-month highs, supported by strong sales growth and consistent profitability. However, the valuation has become elevated with respect to sector and intrinsic value metrics, while dividend yield remains nominal. Daily volatility and historical instability in August should be considered alongside strong long-term returns and positive business momentum—investors should be alert to potential price corrections or swings at these levels.

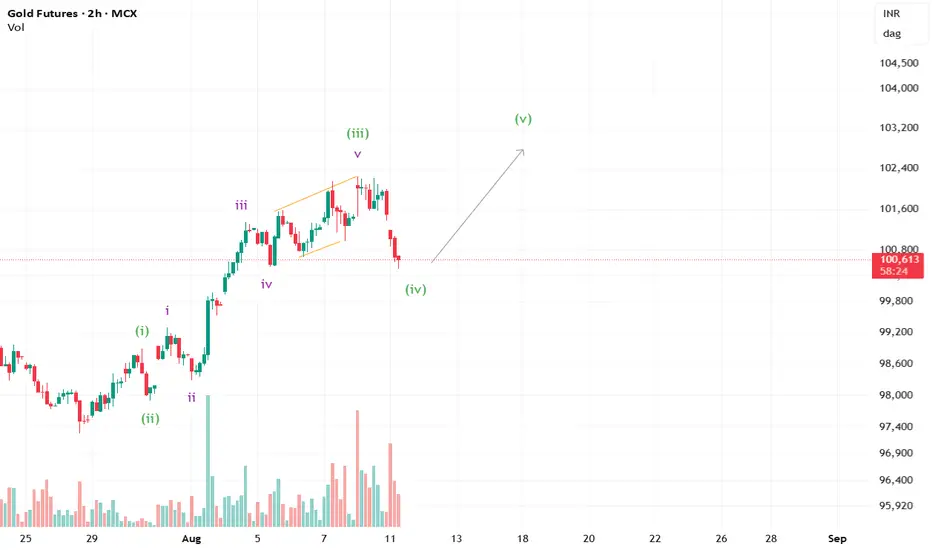
Bullish signs for Gold?Gold seems to have made a good corrective move for wave iv. We may see a new high in the coming sessions.
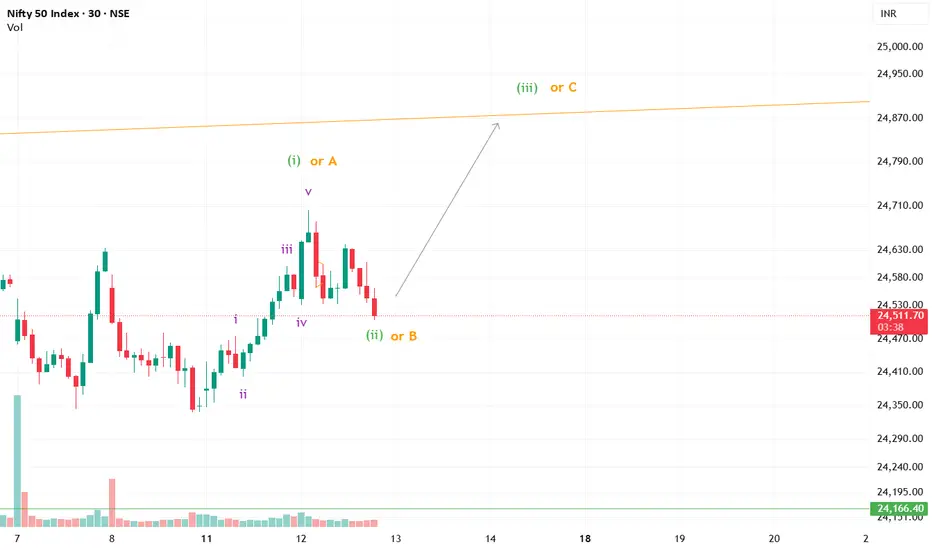
Nifty Elliott Wave Setup Points to Next Bullish LegNifty may be completing Wave (ii) or B, with a strong Wave (iii) or C rally likely ahead.
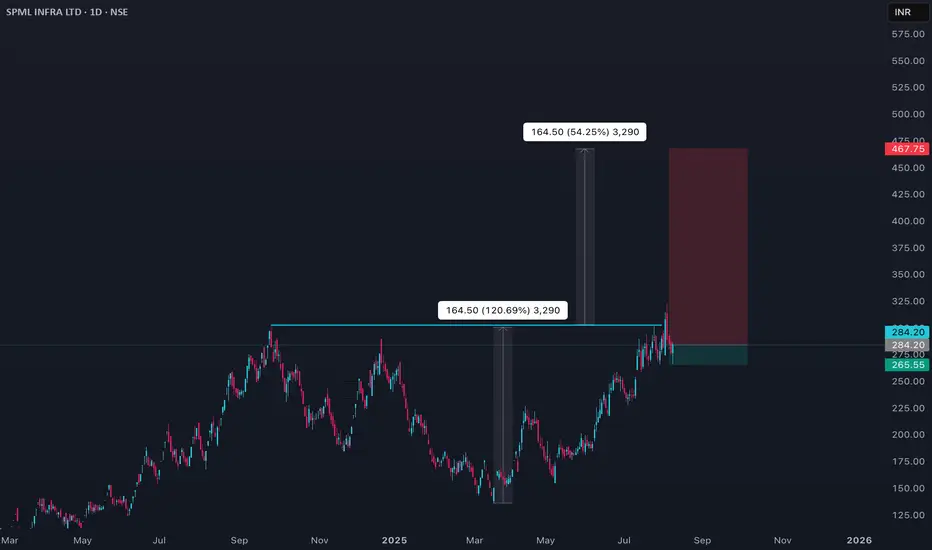
SPMLINFRA Price ActionSPML Infra Ltd (SPMLINFRA) is exhibiting notable momentum and price appreciation in 2025:
- **Current Price**: Around ₹289–₹308 as of August 2025.
- **Performance**:
- 1-year return is strong at about 45.5%, with a **21% increase in the past month** and **3.6% in the past week**.
- Recent volatility: The price has fluctuated from lows around ₹136 up to a high of ₹323 in the last year.
- **Valuation**:
- **P/E Ratio**: Approximately 42, indicating aggressive pricing compared to earnings.
- **P/B (Price to Book)**: Around 2.6, reflecting the market’s willingness to pay a premium over the company’s asset value.
- **Market Cap**: About ₹2,038 crore.
- **Profitability**:
- **ROE** (Return on Equity): ~8% for the last year, but 3.7% over the past three years, which is modest.
- **EBITDA Margin**: About 5.5%.
- **Strong Profit Growth**: 49% CAGR over 5 years; sharp turnaround recently, although past sales growth has been negative.
- **Concerns**:
- **Sales Growth**: Negative (-15% CAGR over 5 years).
- **High Promoter Pledge**: About 27% of promoter shares are pledged, which may be a risk.
- High debt and debtor days remain elevated.
- **Dividend**: No dividend payout.
- **Momentum Rank**: Among the top 21% companies showing bullish momentum currently.
**Conclusion**: SPML Infra’s stock price reflects recent bullish momentum, despite muted sales growth and some balance sheet risks. Profit growth and operational improvements have buoyed sentiment, but the high valuation metrics and promoter pledging warrant caution. The stock is considered volatile, and investors should monitor fundamentals alongside price trends.
Every Chart Speaks — Learn to Hear It like a PROFrom bearish flags to bullish trendlines and triangles — discover how one stock can tell multiple stories. Start reading charts like a trader, not just a viewer. This video will take you on the journey to love price action and charting .

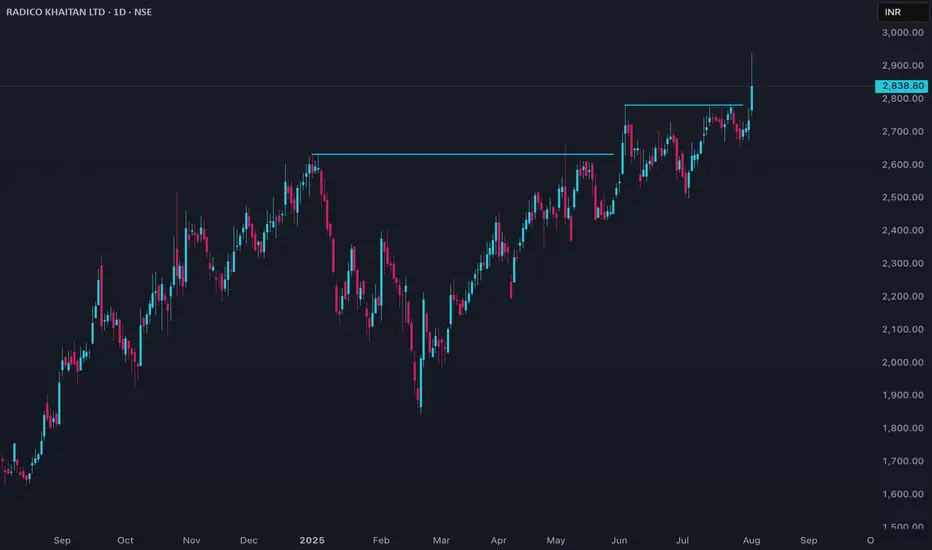
Radico Price ActionRadico Khaitan’s stock is trading around ₹2,840 as of early August 2025, having climbed sharply from about ₹2,700 in July and near ₹2,050 back in February. The share price hit an all-time high at the start of August and has more than doubled over the past 12 months, outperforming its peers in the spirit and beverages sector.
Recent price momentum has been driven by strong financial results: for the quarter ending June 2025, Radico reported net sales of over ₹1,500 crore, a year-on-year increase of more than 32%. Market capitalization is robust and the stock is actively traded, with volumes surging during rally periods. However, valuation is elevated: the price-to-book ratio is around 14 and price-to-earnings is at the high end for its segment, reflecting rich investor expectations.
Operationally, Radico maintains steady margins and has shown above-average revenue growth, consistently launching new premium products and expanding distribution. The company’s return on equity averages about 11–12% over three years, slightly below top FMCG performers but stable.
Technically, the stock is in a strong uptrend, trading well above major moving averages, but may be considered overbought in the very short term after recent rapid gains. Liquidity remains healthy, supporting continued volatility and trading opportunities.
In summary, Radico Khaitan is a high-growth, well-established spirits company with strong recent sales and a share price at historic highs. While fundamentals support continued strength, caution is warranted given expensive valuations and the potential for short-term corrections following such a swift rally.
Gopal Snacks Ltd Price ActionGopal Snacks Ltd’s share price is around ₹359.5 as of August 3, 2025. Over the past year, the stock has shown only a modest increase (up about 1%), with greater strength seen in the last six months (up 7%). The 52-week range is broad, with a high near ₹520 and a low around ₹253, indicating significant volatility. Average daily trade volumes have also risen, supporting liquidity.
The company’s financial performance for FY25 shows total revenue at approximately ₹1,474 crore, a slight rise over FY24. However, net profit slumped sharply to ₹19 crore in FY25 from ₹100 crore a year earlier, with the operating profit margin declining to about 5.3% (from nearly 10%). EPS stands at ₹1.52 for the most recent year. Key ratios—P/E around 82.7 and P/B near 11—point to a premium valuation, especially considering the weak recent profit growth.
Operationally, Gopal Snacks has faced challenges, including a significant quarterly loss attributed to rising costs and a one-off fire incident, which hurt margins and caused a 12% revenue drop that quarter. As a result, compounded profit growth is negative for the trailing twelve months, and return on equity dropped to 14% (from nearly 27% over the previous three years).
Promoter holding remains high (over 81%), but the stock is classified as high-risk, with volatility more than three times that of the broader Nifty index. Despite a positive dividend payout ratio (now around 66%), overall yield remains modest at less than 0.3%.
In summary, Gopal Snacks Ltd is a small-cap FMCG stock trading markedly below its 52-week highs, reflecting weak earnings momentum after a challenging year. Stronger long-term fundamentals and established market presence support the stock, but recent headwinds—including falling margins, higher volatility, and rich valuations—call for investor caution if seeking near-term upside.

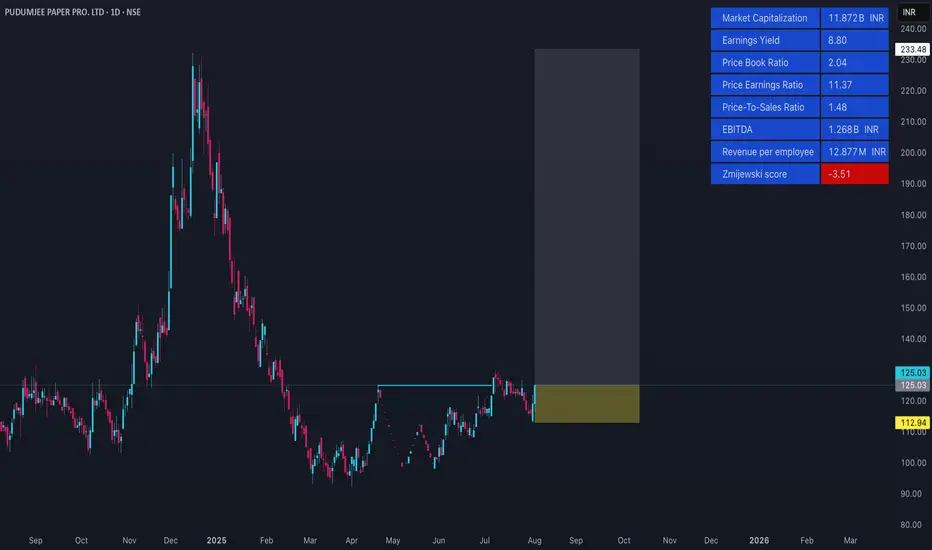
PDMJEPAPER Price ActionPudumjee Paper Products (PDMJEPAPER) trades near ₹125 as of early August 2025, with 52-week highs around ₹232 and lows near ₹90. The stock has demonstrated moderate to high volatility in recent months, with sharp daily moves both upward and downward. Over the last three months, the share price has risen roughly 4–5%, though its one-year return is negative, down about 5%. In contrast, the stock remains an exceptional long-term outperformer: up over 200% in 3 years and roughly 720% over 5 years.
Short-term price trends show a recovery from late June and July lows near ₹110–116, gaining back strength towards ₹125 by August. The market capitalization stands at approximately ₹1,100 crore, and analyst platforms suggest the current valuation is around 11–12 times earnings, with a price-to-book below 2, implying moderate valuation relative to recent growth.
Turnover and liquidity are healthy, with notable volume spikes during price rallies. The company has also outperformed its sector over multi-year periods. Historically, returns in August are mixed, but positive August rallies have been observed in recent years.
Operationally, Pudumjee Paper remains a mid-cap paper manufacturer with a focus on volume growth and steady, positive operating margins. While dividend yields are modest, financial stability is reflected in recent results. Investors should remain cautious due to past volatility and the cyclical nature of the paper sector, but the stock’s long-term performance signals strong sector positioning and improving fundamentals.
This summary is based on current market prices and trends as of August 2025, with emphasis on key performance and valuation metrics, and does not include references to specific data sources.
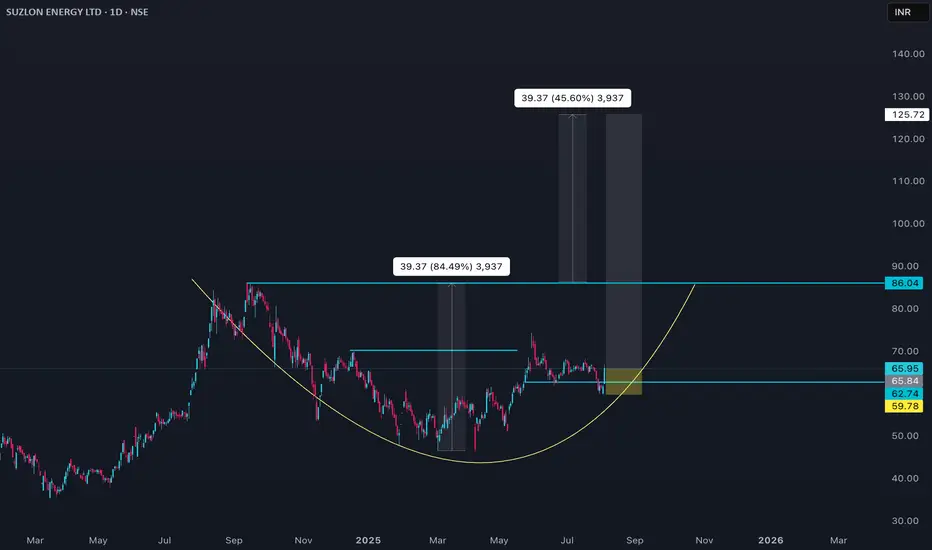
Suzlon Energy Price ActionSuzlon Energy’s share price is around ₹66 as of early August 2025. The stock price has shown strong volatility with a 52-week high near ₹86 and a low around ₹46. Over the last three months, the price has gained about 17%, but it has declined slightly by around 2–3% over the past year. Long-term gains are impressive, with the stock appreciating over 850% in 3 years and over 1,400% in 5 years.
Financially, Suzlon posted robust revenue growth of approximately 67% year-on-year, with revenues crossing ₹10,800 crore in the latest fiscal year. Profitability has surged, highlighted by a net profit increase of over 200%, strong EBITDA margins near 16–18%, and return on equity above 40%. The company has a healthy order book of 5.6 GW, indicating strong future revenue visibility.
Valuation metrics show a high price-to-earnings ratio around 40-43 and a price-to-book ratio near 14, reflecting elevated investor expectations. The stock carries a high beta near 2.6, indicating it is more volatile than the overall market.
Suzlon’s debt has been reduced significantly over recent years, improving financial stability. The firm is a leading player in India's wind energy sector, supported by government policies and large-scale renewable targets.
Seasonally, August tends to be a weaker month historically, but recent positive news like major turbine order wins have boosted sentiment. While the stock shows high growth potential and strong operational execution, its elevated valuation and volatility call for caution among short-term investors. Overall, Suzlon Energy stands as a high-beta, high-growth renewable energy company with solid financial turnaround.
This analysis describes recent market and financial data without specific source references, focusing on key trends and metrics as of August 2025.
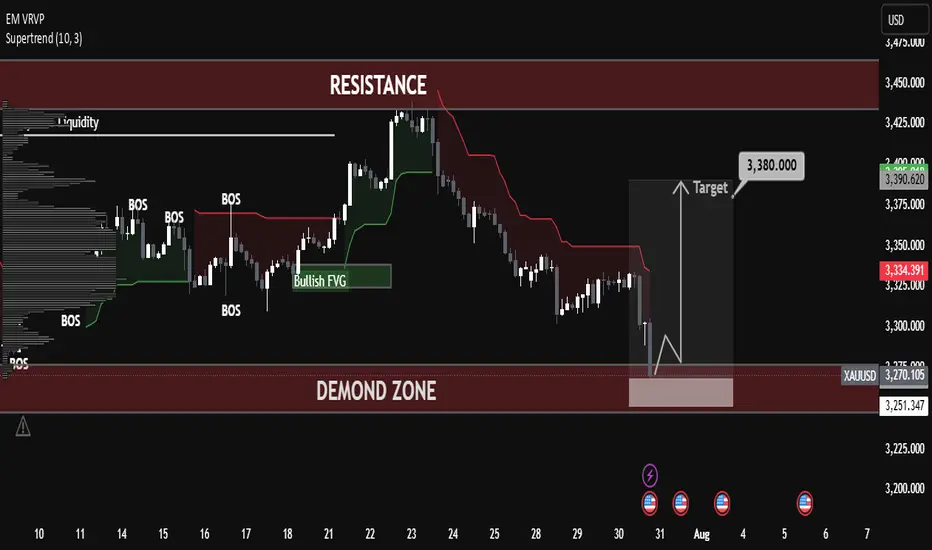
Gold Took Support – Now Bulls Are in Control! Gold Took Support – Now Bulls Are in Control!
Gold (XAUUSD) price has taken a strong bounce from the support zone, and now it’s looking bullish. Market reacted nicely from the demand zone, which means buyers are stepping in again.
📊 Technical Analysis:
✅ Strong Support Zone (3260–3280):
This area is acting like a strong base. Price touched here and immediately bounced — showing buying pressure.
🔄 Break of Structure (BOS):
Market broke the previous structure and gave signs of trend reversal. It also grabbed liquidity from the lows.
🟩 Bullish Fair Value Gap (FVG):
A clean FVG was formed and respected, which shows institutional activity and buying interest.
🎯 Target Level – 3366.984 USD:
If bullish momentum continues, gold can easily move towards this level. It’s also near a previous resistance.
📚 Educational Points:
Market took liquidity from the lows and reversed
Fair Value Gap is respected, adding confirmation
Structure break confirms buyers are in control
Price is heading towards the next resistance zone
📌 Conclusion:
Gold is now in a bullish phase. As long as the support zone is holding, buyers can stay confident. Target remains near 3366–3380 USD. Any pullback can give a good buy opportunity.