Short opportunity on Reliance Indu.Study and Analysis Perspective
📈 Opportunity Overview: There appears to be a short-term bullish trend developing in Reliance Industries' stock, presenting a potential opportunity for traders and investors over the next 1-3 days. This window could align with technical, market, or news-driven factors.
Technical Indicators to Watch:
Price Action
Risk Management Tips:
Set Stop-Loss: Keep a strict stop-loss to protect against unexpected downturns.
Target Profit: Define a profit target to secure gains within the 1-3 day window.
Position Sizing: Avoid over-leveraging; allocate capital wisely based on your portfolio.
Bullishpattern

W-Pattern Breakout Alert: KRN Heat Exchanger📊 Setup Overview:
Entry: Above ₹828.75
Stop Loss: ₹670
Target: ₹1030 (Positional)
RR: 1:1.2 (📌 Close to 20% risk, so trade light!)
📈 Technical Highlights:
Bouncing off 30DMA & 50DMA, forming a wide-range candle with strong volumes.
RSI looks bullish.
ATH Resistance: ₹833.5 🚧 — if broken with volume, add more and trail your SL!
💡 Fundamentals:
ROCE: 42.1% | ROE: 41.9% ✅
Market Cap: ₹5153 Cr
PE: 129 😬 vs Sector PE ~32. (Expensive, but growth potential seems priced in.)
Trend: Trading against the trend, so position sizing and risk management are key! 🚨
🛑 Disclaimer:
This is not investment advice. Risk management is crucial, especially when trading counter-trend setups. 🚩
💡 Quick Take:
With a W-pattern breakout, bullish RSI, and strong volume, this setup has potential. But the high PE ratio makes it an expensive bet. Sector comparison suggests caution, so treat this as a high-risk, high-reward trade! 🚀

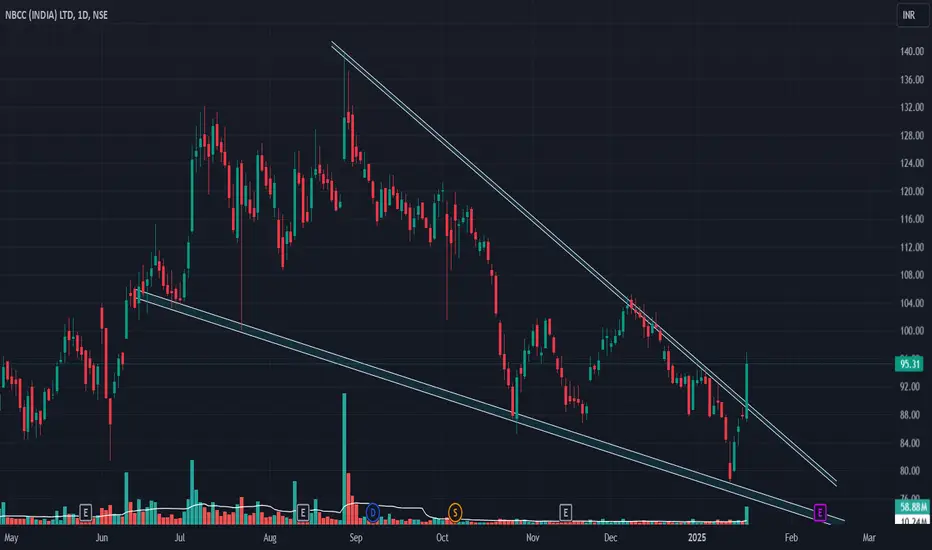
NBCC INDIADisclaimer : Trade at your own risk this is not buy - sell recommendation, I'm not sebi registered.
NBCC looks very bullish on daily, weekly and monthly charts keep on radar.
BSEafter moving partially sideway to bullish it has given fresh BO
if 5400 is saved this may given good returns from here

Parallel channel breakout in Aarti IndustriesNSE:AARTIIND A parallel channel breakout is happening at 415 levels. So for a swing trade buy at 425 levels & with fib retracement 1st target is 515 & 550.
The SL would be at 390 or a swing low.

TRENT LONG IDEA...I'm taking long positions in the stock based on my Elliot wave analysis.
On breaking down Trent's chart pattern, I can see that the stock price is currently in the wave 4 correction of an upward major WAVE 4 movement.
I'm expecting a quick bounce back to the marked levels (wave 5 rally).
Please do your own analysis before you trade.

This is HOW and WHAT the Institutions BUYTriveni Turbine Limited is a leading manufacturer of industrial steam turbines. With over five decades of experience, they design, manufacture, and deliver advanced technology steam turbines up to 100 Megawatt Electric (MWe). Their products are used across various industries, including power generation, petrochemicals, and more.
Here are some key points about Triveni Turbine:
Global Presence: They have a presence in over 80 countries.
Comprehensive Solutions: They offer engineered-to-order solutions, including refurbishment services through their Triveni REFURB program.
High-Tech Precision: Their turbines are known for high-tech precision and efficiency.
Diverse Applications: Their steam turbines cater to a wide range of pressure and flow applications.
Look in to the charts for my levels.

One of my charming champions WELCORP.Welspun Corp Limited is a leading manufacturer of large-diameter pipes globally. They produce a variety of products including BIS-certified Steel Billets, TMT (Thermo-Mechanically Treated) Rebars, Ductile Iron (DI) Pipes, Stainless Steel Pipes, and Tubes & Bars.
WCL has a strong global presence with manufacturing facilities in India, the United States, and Saudi Arabia. They are committed to ESG (Environmental, Social, and Governance) goals and are continuously expanding their product offerings to cater to both B2B and B2C markets.
I am entering again at 749 (GTT already placed today) for the target of 856 and with a stop loss at 721.

Garden Reach Shipbuilders Swing/positional Set upHello Everyone,
GRSE,Garden reach shipbuilders taking support of EMA200 Volume supporting to buyers, RSI is above 40 good long set up is form for swing/positional posiible 1770, 1885,2070++

Tataconsum breaking outThe stock seems to be breaking out from the support levels of 885 that we have identified with the following points
1. Rising volumes.
2. Rising relative strength as compared to the Nifty consumer Index which has not happened in the past
3. Fundamental view: Almost all counters have worked well in this index except for tataconsum, this is now time for this stock to give a nice upmove.
Potential upmove till 975 and then 1027

ZOMATO: Pullback trade📊 Analysis:
Good bullish candle form on 21EMA with good volume.
📈 Trading Plan:
Entry: Buy above 290 (wait for a breakout above candle at least 15-30 min with strong volume confirmation).
Target 1: 320
Target 2: 345
Stop-Loss: 275 closing basis
ZLong

UNITDSPR: Cup & Handle pattern breakout📊 Analysis :
Good bullish candle breakout of C&H pattern with good volume.
📈 Trading Plan :
Entry: Buy above 1565 (wait for a breakout above candle at least 15-30 min with strong volume confirmation).
Target 1: 1650
Stop-Loss: 1525
R:R 1:2

Parallel Channel consolidation in TitagarhNSE:TITAGARH A parallel channel has been formed in Titagarh
A double confirmation buy can be triggered when the price crosses EMA 44 with trailing SL.
The rest of the explanation of the targets and SL has been marked in the chart.

Parallel channel bounce back in ZEEL GETTEX:NSE : ZEEL A parallel channel breakout has formed in Zeel at 125 levels with a breakout.
1st target is to be achieved at 142 with 2nd to be at 152 on daily levels
SL to be the swing low which in this case would be 118

cup and handle breakoutBajaj consumer on weekly timeframe has formed cup and handle pattern and given breakout with good volume. The short term and mid term momentum is also bullish with recent crossover.
the target is of 1:3 which indicates it could be a fair trade.

ONGC Stock Looks to be in Momentum Right NowONGC stock has just made a trendline breakout and is above 50 EMA and RSI is also near 60, so the stock is still in momentum and is entering around 250, which is placing the stop loss as per the past performance. is 232 and its target is 298.

Nifty Analysis: Double Bottom Formation and Bullish OutlookThe Nifty index appears to be forming a classic "W" or double bottom pattern at its current lower levels, which it has been testing for the past few weeks. This is a strong technical signal often indicative of a potential trend reversal.
Meanwhile, the Dollar Index (DXY) is hovering near its peak levels and is showing signs of a divergence pattern on key technical indicators. This divergence suggests a possible shift in momentum, which could further support bullish sentiment for Nifty.
Based on this pattern analysis, it’s becoming increasingly clear that the market clouds are dissipating, and a brighter phase may be emerging. Nifty is poised for a bullish move, and this could create opportunities in related stocks. Stay vigilant and look out for stocks aligning with your trading framework.
Disclaimer:
This is a technical analysis based on chart patterns and is shared for educational purposes only. Please conduct your own research and analysis before making any trading decisions.

Flag & Pole in GRSENSE:GRSE Flag & pole are visible for GRSE in a weekly timeframe
Once the Resistance is broken beyond 1700, we can take a positive position for the ATH target
SL can be the swing low or between the range of 1366-1480

MANINFRAMANINFRA giving base breakout with decent volume. It seems ready for the next take-off... Keep it on radar.

Finolex Pipes - Falling Wedge Finolex Pipe has created Falling Wedge pattern, it has minimal volumes in this fall from 340 level.
Breakout zone is above 250 level.
Buy @ 240 level
SL 225
Target of the pattern is 340-350 level.
Time Frame : Short Term.

ADANI WILAMR by KRS Charts5th Nov 2024 / 9:22 AM
Why AWL ❓❓
1. Decent Fundamental and Corrected Stock Technically.
2. Even its Correcting since long time, it made HL in monthly Timeframe. Which is good sign.✅
3. Clearly 5 Wave Correction Structure is finished, One Bounce is expected till 4th Wave height from current price.
4. Upside Movement can be Sluggish it's a swing Entry so. 📈
With a Good R/R more than 1:3 Target will be 509 Rs.
with SL of 285 Rs Daily Closing Basis.

IDFC FIRST BANK by KRS Charts5th Nov 2024 / 2:34 PM
Why IDFCFIRSTB ❓❓
1. First thing BULLS COUNTER ATTACK visible after correction.
2. Previous Gap got filled last Candle.
3. On higher TF Price is at Old Support zone.
4. Swing Entry Due to B.C. Attack setup what it means, mentioned in Chart.
Target - 86 Rs & 100 Rs.
SL 1D Closing - 63.80 Rs.

NIACLNIACL giving resistance breakout with increased market participation. I have observed strong momentum in insurance sector. It seems momentum may continue. Keep it on radar
