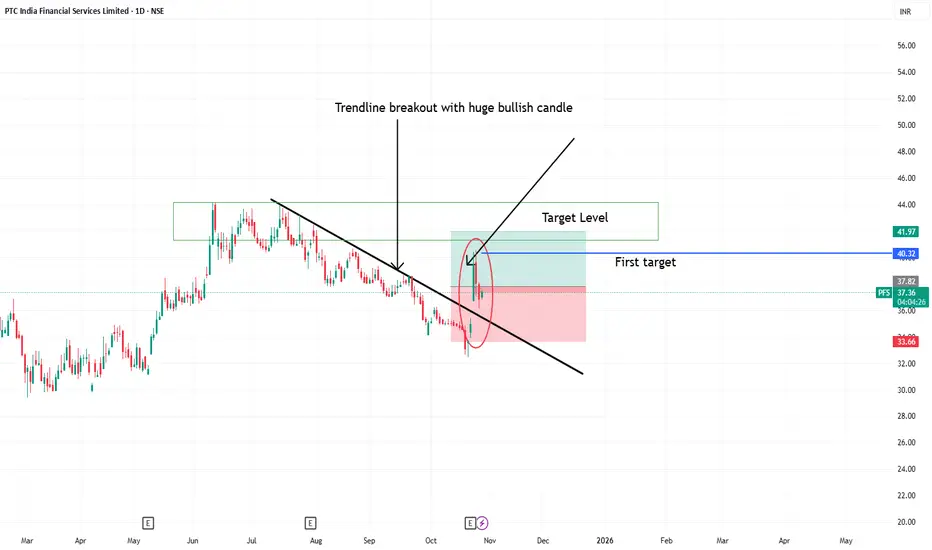
Trendline breakout in PFS 1. Trendline breakout seen in PFS
2. Huge bullish candle broke trendline shows buyers strength
3. stock may give rally and show upward movement upcoming few weeks
Bullishpattern
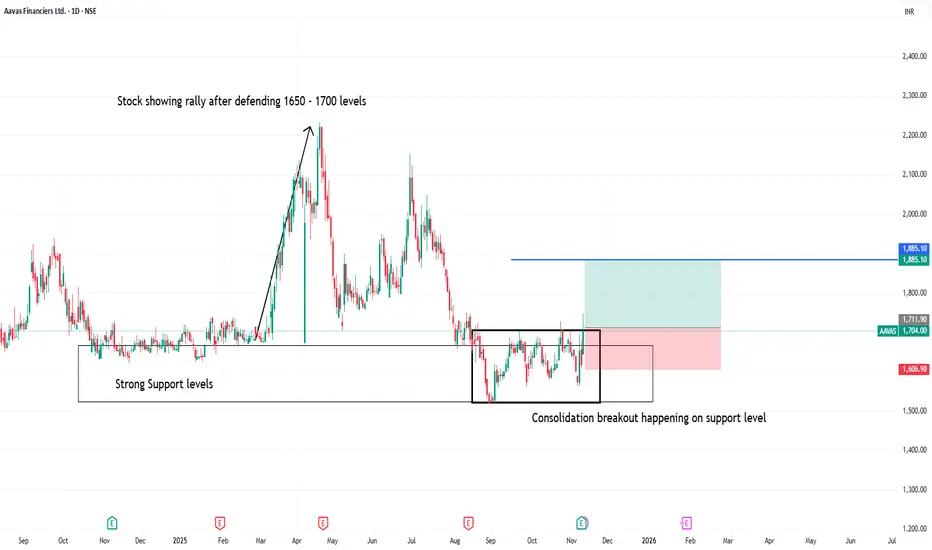
Consolidation breakout happening on support level in aavas fin1. Stock has been showing strength on 1700 levels buyers accumulating and taking further as shown on previous support
2. On same levels now consolidation has happened and soon stock may give nice breakout with great R:R
3. Usually range in consolidation will be its target after breakout
for ex:
if range is of 100 points in consolidation then target will be of 100 points
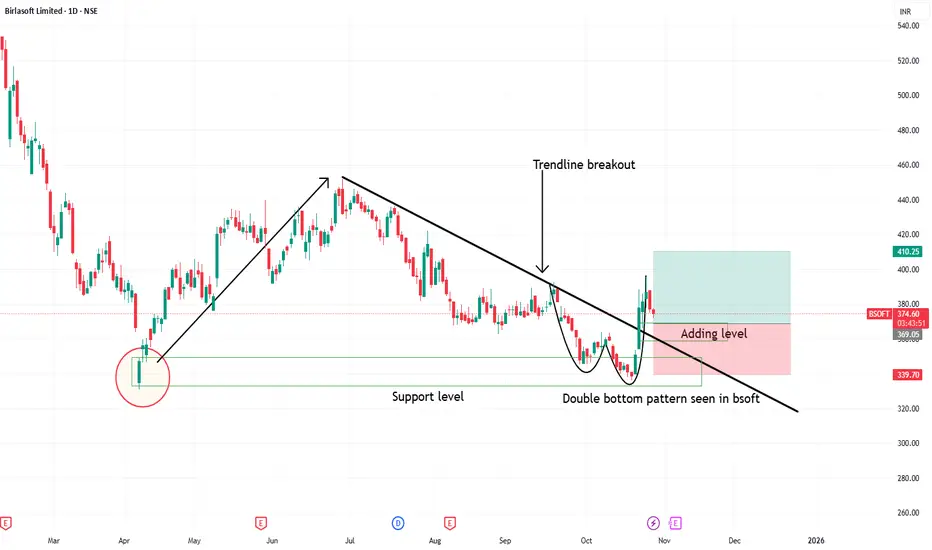
Double bottom in BSOFT1. Double bottom seen on support level
2. Trendline breakout seen with double bottom
3. Good fundamental stock can see upside movement in upcoming weeks
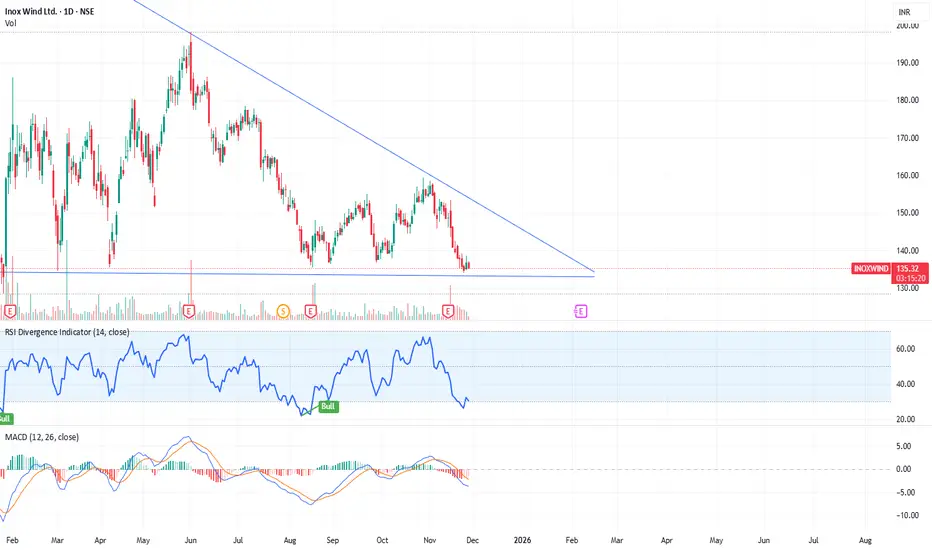
INOXWIND Accumulation Zone – High Probability Upside Reversal INOXWIND is approaching a high-probability bullish reversal zone.
Price is currently sitting at long-term horizontal support while compressing inside a falling triangle pattern. This area has previously acted as a strong demand zone.
Key Bullish Signals:
🔹 1. Price near major support + triangle apex
The price is holding above long-term support and squeezing toward the triangle’s end — a zone where breakouts or sharp reversals often happen.
🔹 2. RSI deeply oversold (near 28–30)
RSI is at levels where previous reversals occurred, showing sellers are exhausted and downside momentum is weakening.
🔹 3. MACD losing bearish strength
The MACD histogram is flattening and the lines are preparing for a potential bullish crossover, indicating the downtrend is weakening.
🔹 4. Tight price compression forming a “price pipe”
Price action is tightening, which often precedes a volatile move — and with indicators oversold, the probability favors an upside bounce.
🎯 Bullish Expectation
If the support holds, INOXWIND may show a sharp relief rally toward:
₹140
₹150 trendline
And possibly higher if volume supports a breakout.
⚠️ Risk Disclaimer
Support breakdown below ₹130 will invalidate the bullish setup.
This is a study of chart behavior and probability only — not a buy/sell recommendation. Always do your own research and manage risk.

NIFTY Cup & Handle pattern price action-Trend - Bullish
-Pattern - Cup & Handle
-Break out & retest
-Current week price is on pull back from ATH
Target - 30,800 Level

Tight Bullish Coil Above 50% EQ Means what ? Points to be Noted :
-Clear monthly swing low and swing high marked, defining the impulsive leg and its equilibrium zone. ( S1 and S2 )
-Price is consolidating in the upper half of this leg, holding above the 0.5 equilibrium level, showing sustained strength in the higher value area. ( also know as EQ )
-A clean ascending trendline (green) is guiding price from the swing low, with candles respecting it as dynamic support during the pause.
-Within this broader bullish structure, price has formed a tight parallel channel consolidation, indicating controlled pullback rather than distribution. ( white lines marked )
-Nearest major supply aligns with the all-time high, and the highlighted supply box marks the key decision zone where breakout or rejection is most likely.( orange box )
This post is for educational purposes only and is not investment, trading, or financial advice. Always do your own research, assess your risk tolerance, and consult a qualified financial advisor before making any trading decisions.

HEXT Price Action**Hexaware Technologies Limited (HEXT)** trades in a mid-range consolidation phase after retreating from its 52-week high, showing short-term upside momentum but elevated volatility relative to the Nifty, making it suitable for tactical trades around key levels rather than directional bets without confirmation.
## Current Price Action
- As of late November 2025, HEXT hovers around ₹750-760, down from a 52-week high of ₹900 (July 2025) and well above the low of ₹590, placing it roughly 15-20% off peak with recent sessions showing intraday swings of 3-4%.
- Past week up ~4%, but 1-month flat to +1% and 1-year mildly negative at -0.8%, reflecting sector headwinds like delayed client decisions amid a broader IT slowdown.
## Key Levels
- Resistance clusters near ₹830-900, aligning with prior highs and upper circuit bands, where sellers have capped rallies; a sustained close above ₹800 could signal resumption toward the yearly high.
- Support holds at ₹725-742 (recent lows) down to ₹590 extremes, with the ₹700 zone acting as a pivot—breaks below risk accelerated selling given 3x Nifty volatility.
## Technical Structure
- RSI around 72 suggests nearing overbought on shorter frames, while PE at 39x exceeds IT peers (sector ~28x), implying rich valuation unless earnings growth accelerates; beta of 1.4 amplifies Nifty moves.
- No dominant trend on higher timeframes yet—prioritize volume on breaks, opening range plays, and prior day levels over oscillators, as Q2 profit beat (22% YoY) supports dips but macro drags cap upside.

TMCV Price ActionTMCV appears to be in a post-demerger price discovery phase with moderate volatility and no clear established medium-term trend yet, so treating it as a short‑term trading candidate rather than a long‑term technical structure is prudent at this stage.
## What TMCV is
- TMCV is the newly listed commercial vehicle (CV) entity created from the demerger of Tata Motors’ CV business, giving separate exposure to the group’s CV operations.
- Existing Tata Motors shareholders received TMCV shares in a 1:1 ratio, and the new stock initially trades in a trade‑for‑trade segment to allow orderly price discovery, which tends to limit intraday speculation and can exaggerate gap moves.
## Current price zone and volatility
- Recent references place TMCV around the mid‑₹300s (for example, about ₹352 on 28 Nov 2025), with a 52‑week range roughly between ₹306 and ₹360, indicating it is trading in the upper half of its short available range but not at extremes.
- The relatively narrow high‑low band and short trading history mean any support/resistance levels are provisional and can break more easily than in mature charts.
## Technical picture (structure only)
- With price hovering closer to the upper part of its current band, immediate resistance is likely near the recent swing highs around the upper ₹350s–₹360 zone, while initial support sits near the recent lows around the low ₹300s; breaks beyond either edge would likely trigger momentum flows as the order book is still thin and adapting.
- Given the lack of long historical candles, higher‑timeframe moving averages and classic trend indicators will be less reliable; price action, volume spikes on breakouts, and intraday structure (prior day high/low, opening range) should be prioritized over slow lagging signals in this early phase.
## Trading approach ideas (not advice)
- For short‑term trades, one approach is to fade moves closer to the edges of the current band (buying near the low ₹300s, selling or tightening stops near the mid‑/high‑₹350s) as long as the band holds, while being ready to switch to breakout mode if price closes convincingly outside this range with higher volume.
- Because of the demerger context and trade‑for‑trade constraints, position sizing and risk limits need to be conservative: slippage and gaps can be meaningful, so pre‑defined stop levels and partial‑exit plans around known support/resistance are critical until TMCV builds more trading history.

Buy The Beast!Seems to be Very Bullish from current levels.
A great investment stock.
L&T Finance Holding
Short Term Tgt: 170/200
Long Term Tgts: 230/280/300/350
SL: should be around 88

INOX WIND – Testing Major Support + Falling Wedge StructureChart Overview
The price has been moving inside a descending trendline (falling wedge–like structure) since its peak earlier this year. Currently, the stock is once again testing a strong horizontal support zone around ₹132–135, which has acted as demand multiple times in the past.
This confluence of major support + wedge bottom makes this zone important for a potential bullish reversal.
🟩 Bullish Argument:
This zone offers a potential bullish opportunity because:
Price is sitting at strong demand zone (132–135).
The falling wedge structure is typically a bullish pattern.
RSI oversold → Possible reversal territory.
MACD is setting up for a future bullish crossover.
Risk–reward becomes favorable near major support.
🟧 What Bulls Want to See
A bounce from the ₹132–135 zone.
A close above the recent minor swing high on the daily.
Breakout above the descending trendline for positional upside.
🟥 Invalidity (When Idea Fails)
A daily close below ₹130 with volume would weaken the bullish case.
That would indicate breakdown from support instead of reversal.
📈 Potential Targets (if reversal occurs)
T1: ₹145
T2: ₹155
T3: Trendline breakout → ₹165+
⚠️ Disclaimer
This is not financial advice; for educational purposes only. Always manage risk.
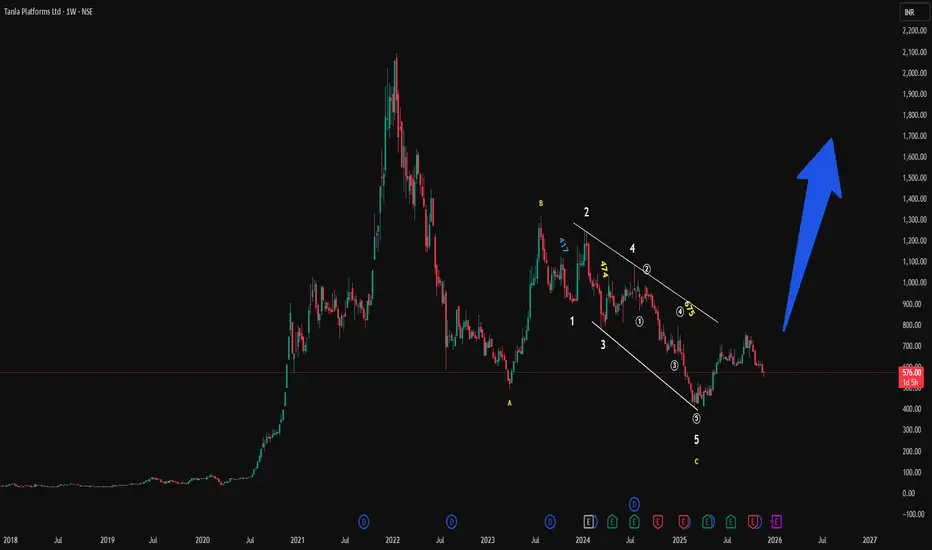
TANLA new Impulse start soonGood fundamental with Good price
Tanla Platforms Ltd. has an average share price target of 705.
The consensus estimate represents an upside of 1300 and 2100
View 3 reports from 1 analysts offering long-term price targets for Tanla Platforms Ltd..
GOLDHello & welcome to this analysis
GOLD after a super duper move from AUG - OCT followed by a sharp decline now appears to be consolidating within a triangle.
Currently appears to be in leg D which should be followed by leg E to complete the contracting triangle squeeze and from thereon the resumption of uptrend.
For those new to patterns - triangles are time wise correction that see less price retracement within a longer duration of time. The current triangle appears to be a contracting one.
Leg D could end near 4175 / 125750 approx while leg E could end near 4050 / 122250 approx.
The view would be incorrect if either the current up move goes above 4245 / 127950 without a pullback or the expected retracement goes below 4000 / 121000.
The interesting part here is that GOLD prior to its rally from 3250 was also within a triangle for 4 months. What followed was a parabolic move from a squeeze. Lets see if this one will also give such a move or not.
All the best

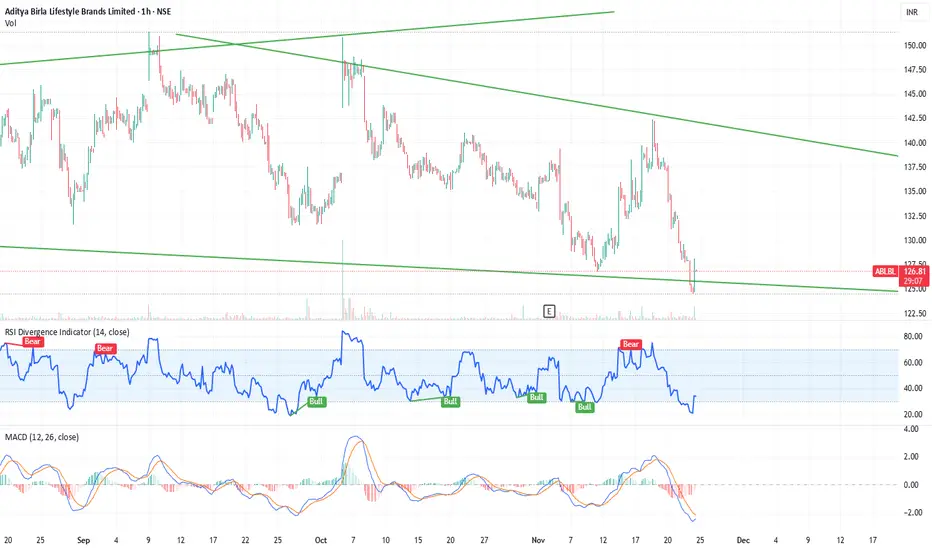
Falling Wedge Pattern (Bullish Setup) | Re-Opportunityit did give an opportunity last week, then fell, and is again at an opportunity zone now.
RSI Analysis
Your RSI shows:
RSI near 37–38
This is close to oversold, which is usually where reversals happen
Earlier, RSI bounced from similar levels
➡️ Supports a bounce possibility.
MACD Analysis
MACD is:
Below zero
Weak
But histogram shows reducing red bars (selling pressure slowing down)
➡️ MACD is not bullish yet, but weakening selling often comes before reversal.
It is again touching that same support, which means:
✔ Another opportunity is forming
✔ A bounce is possible
✔ Risk is low because stop-loss is nearby
❗ But downside risk is also real if support breaks
Entry Zone:
₹124–128 (exactly where price is now)
Stop-Loss:
A daily close below ₹122
If wedge breaks → downside can be sharp.
Targets:
If bounce happens:
T1: ₹135
T2: ₹142
T3: ₹150 (massive trendline resistance)
📌 Note
This analysis is for educational purposes only. It is not a buy or sell recommendation. Always do your own research and analysis before taking any trade. The stock market involves risk — trade carefully and use proper risk management.
Strong candle premierpol stcok to go longThis is the high probability that stock will bounce back from the current level. A very strong bullish engulfing candle has been seen . On breakout confirmation of the resistance area as well as the marked trend line take the long entry @ 46 with SL of 37 and Target price of Rs 70. A very good risk to reward ratio. This is for your educational purpose only.

Consolidation happening in BBTC (Bombay burmah trading)1. is having consolidation pattern between 1750 - 2100 levels
2. One can watch for breakout above 2100 with good Risk : Reward
3. stock has give strong results attracting buyers and accumulation seen at 1850 levels
with strong buyer coming taking stock to 2050 levels in single day
4. stock may test its all time high if breaches 2400 levels

GMR Airports looks Bullish ahead!!!- GMR Airports looks good for the upmove with the trendline support, volume profile poc suport
- It is moving inside a Parallel ascending channel pattern (right now at the support base line)
- Entry now can be bit risky, whatever so ,maintain the tight stoploss
- Monthly, Weekly time frames too show bullishness.
- Breakout awaits!!!!
Target levels mentioned@ chart
Just my view ...not a tip nor advice!!!!!
Thank you!!!

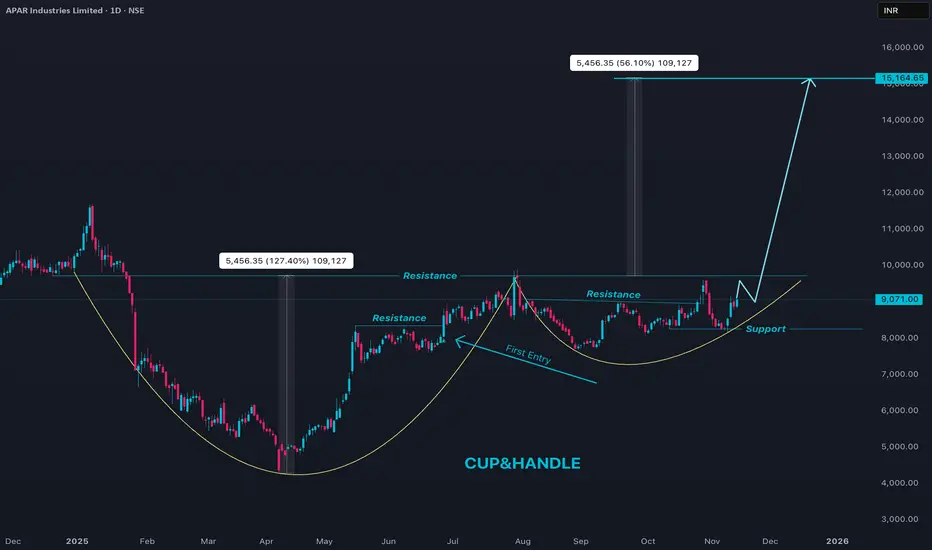
APARINDS Pyramid set upApar Industries (APARINDS) is currently in a strong uptrend on the daily chart, trading near the 9,000+ zone after a sharp rally over the past few months. Price is holding above key short-term moving averages, and momentum indicators like RSI and CCI are in bullish territory but not yet extremely overbought, which supports the ongoing up-move with healthy strength. Recent candles show sustained higher lows with only brief profit-booking dips, indicating buyers are still in control and using declines to accumulate.
In the near term, immediate support lies in the 8,600–8,700 band, where recent pullbacks have found buying interest and where short-term averages are clustering; holding above this zone keeps the trend intact. On the upside, every push to new highs can attract profit booking, so moves toward or above recent peaks around 9,100–9,300 are likely to see some volatility, but the broader structure remains bullish as long as price respects higher lows on the daily timeframe. For fresh positions, staggered entries on dips toward support with clearly defined stop-loss levels below the recent swing low is preferable to chasing extended candles, given the stock’s strong run-up and tendency for swift corrections after vertical rallies.
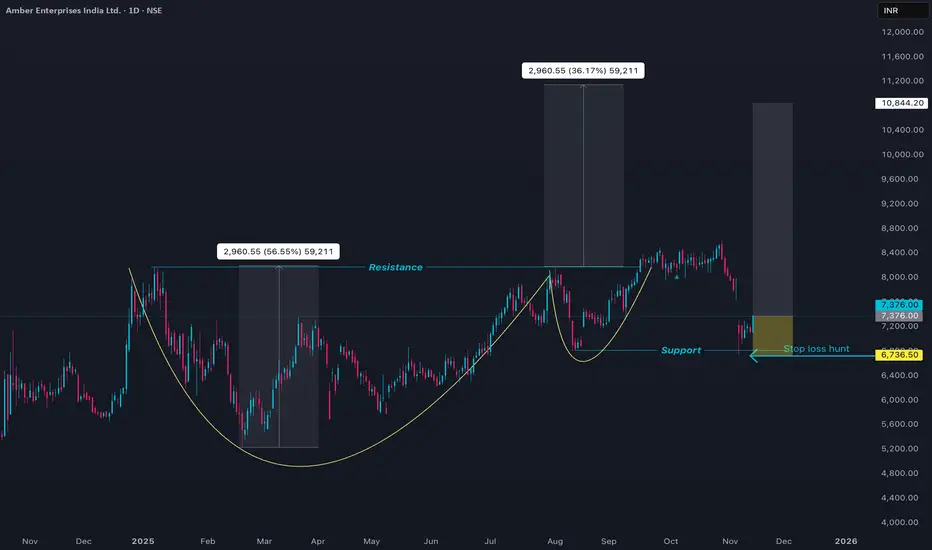
AMBER Re entry set upProbabilities to enter a trade
1. pattern cup & handle
2. Break out failed
3. stop loss hunt is also over
we have 3 probabilities that price may shoot up
Bullish Divergence Spotting a Possible Trend ReversalIn today’s chart study of Crompton Greaves Consumer Electricals, I’ve identified a clear bullish divergence forming between price action and RSI. While the stock continued to make lower lows, the RSI has started making higher lows, signaling that downside momentum is weakening.
This divergence, combined with a flattening MACD histogram and a potential crossover setup forming, suggests the stock may be preparing for a short-term bullish reversal.
The price is also trading near a major support zone around ₹275–₹276, which has been defended multiple times. A sustained move above ₹286 could confirm strength and open up room for a meaningful upside.
This setup offers a high-probability opportunity for early entry before the trend shifts. As always, I’ll be watching volumes and confirmation candles for follow-through.
Note:
This analysis is based purely on technical indicators and chart structure. It is not financial advice. Always conduct your own research and use proper risk management before taking any trade.

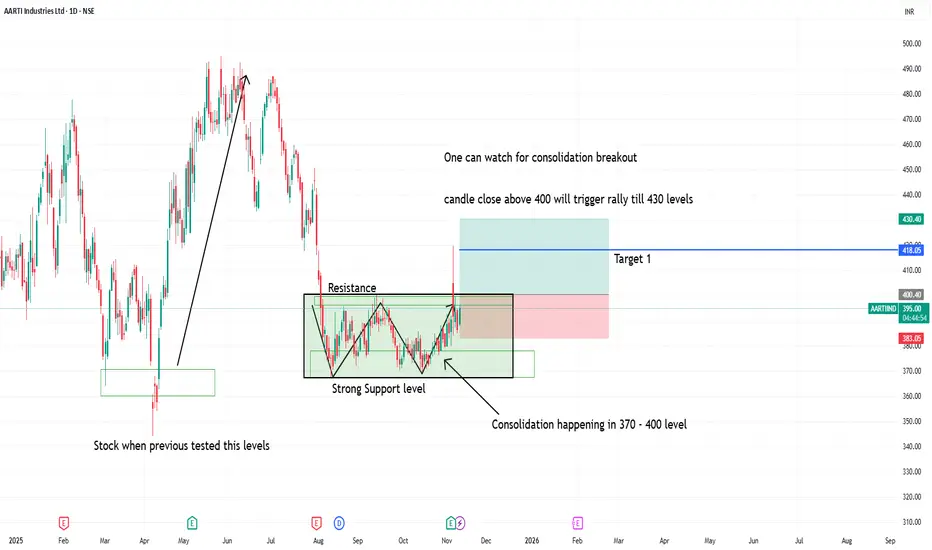
Watch for consolidation breakout in aarti industries1. Above 400 daily candle close will give strength to buyers to reach 430 level targets
2. Stock previously tested support levels gave big upside movement.
3. With good R:R one can watch for upside movement
4. normally the range of consolidation is target after breakout
if 30 points is consolidation range then target will 30 points after the consolidation breakout
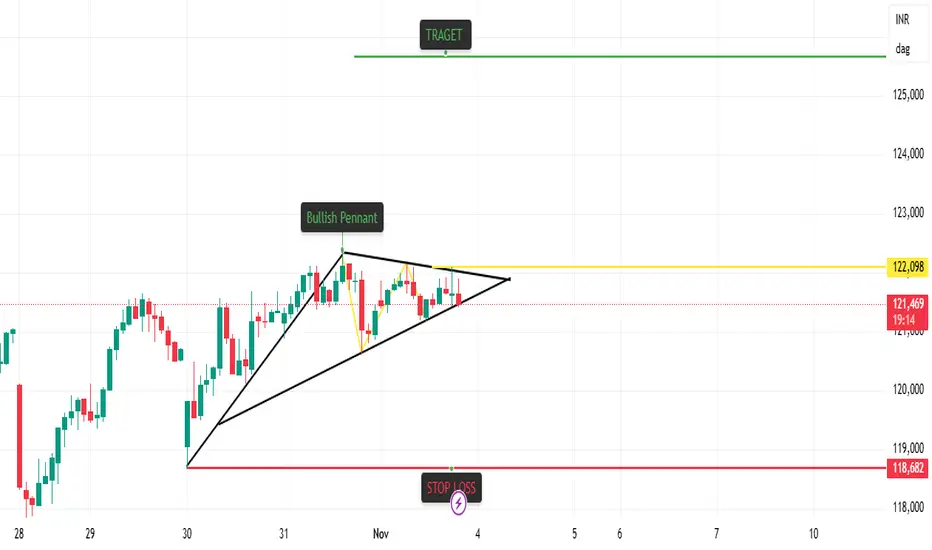
Bullish Pennant Breakout Strategy in GoldBullish Pennant Breakout in Gold MCX
📊 Pattern Overview:
A Bullish Pennant pattern has formed after a strong upward move, signaling a potential continuation of the trend. The pattern is characterized by converging trendlines during consolidation, followed by a breakout to the upside.
📈 Strategy Setup:
Pattern: Bullish Pennant
Breakout Confirmation: Price closing above pennant resistance line
Entry Zone: Near breakout candle close
Target (T1): ₹125,635
Stop Loss (SL): ₹118,682
Risk–Reward Ratio: Approximately 1:2
📊 Indicator Confluence:
T-K Cross: Bullish Cross
Price vs Kijun: Bullish
Cloud Trend: Up
VWMA: Up
RSI: Up
VWAP: Up
SuperTrend: Down (short-term resistance, to be monitored)
🧠 Trading Logic:
The Bullish Pennant indicates a temporary consolidation within an existing uptrend. A confirmed breakout with indicator support (Ichimoku, RSI, VWMA, and VWAP in alignment) strengthens the bullish momentum. Traders may look for sustained candles above the upper trendline with volume confirmation.
⚠️ Disclaimer:
This content is shared for educational purposes only and does not constitute investment or trading advice. Market conditions can change rapidly — always conduct your own analysis and use proper risk management before making any trading decisions.
The Next Big Altcoin Reversal? $CAKE Ready for a Massive Bull RuThe Next Big Altcoin Reversal? NASDAQ:CAKE Ready for a Massive Bull Run
#CAKE is breaking out from a strong falling wedge after a long accumulation phase. Smart money is showing interest as price shifts from bearish to bullish structure.
Support: $2.30 – $2.50
Resistance: $9.30 / $18.70 / $38.40
A weekly close above $3 could trigger a major trend reversal with potential upside of 900%+ in the long term.
SMC & ICT Insights:
Break of Structure confirmed on HTF
FVG support around $2.40–$2.55
Liquidity targets above $9.30 and $18.70
CAKE looks ready for a multi-month bullish run if it holds current levels.
NFA & DYOR

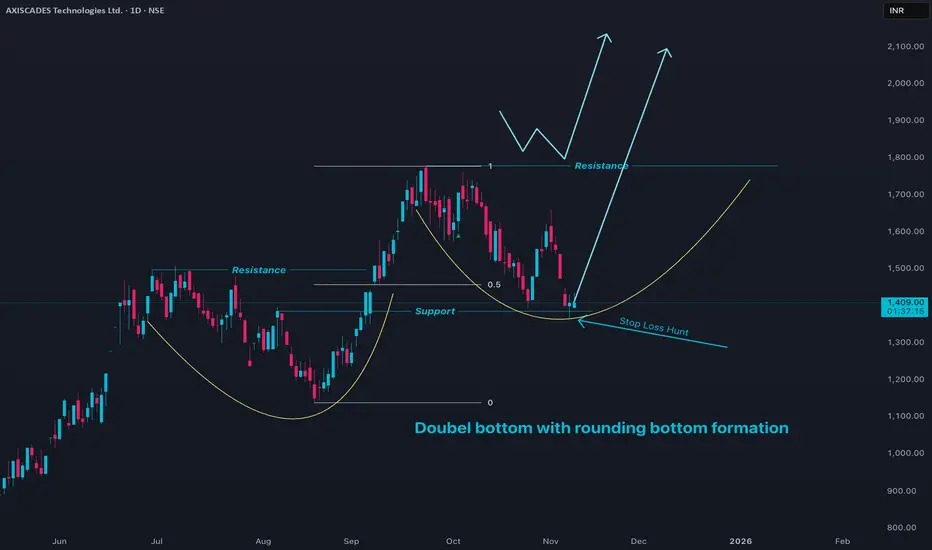
AXISCADES Price Action 1. Price Trading at discound levels
2. Price has taken stop losses
3. Probable 3rd rounding pattern for reversal
4. Double bottom formation