Double bottom W pattern in LIC housing financeDouble bottom W pattern in LIC housing finance
may test its resistance zone
good for upside movement
Bullishpattern

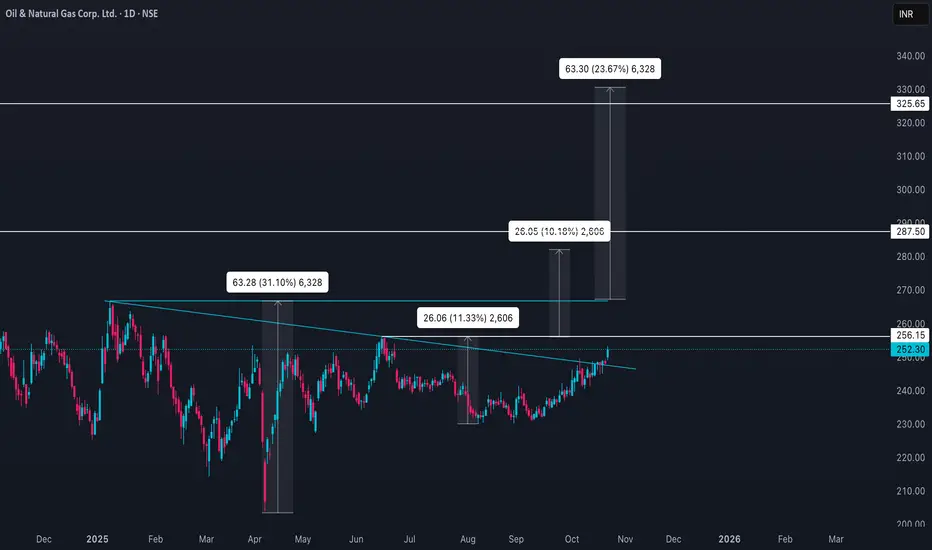
Continuation Diamond (Bullish) – ONGC Ltd. (NSE: ONGC)📊 Continuation Diamond (Bullish)
Pattern Type: Bullish Continuation
🧩 Pattern Insight:
The Continuation Diamond (Bullish) pattern forms when a strong uptrend pauses temporarily, creating a diamond-shaped consolidation before resuming higher. This indicates that the market is taking a breather while both bulls and bears attempt control — but eventually, the breakout above the diamond signals a continuation of the prior uptrend.
🧠 Key Takeaway:
This pattern reflects renewed bullish strength after consolidation, suggesting the continuation of a long-term uptrend once the breakout holds above resistance.
⚠️ Disclaimer:
This analysis is for educational and informational purposes only and should not be considered investment advice. Market investments are subject to risks. Please consult your financial advisor before making any investment decisions.

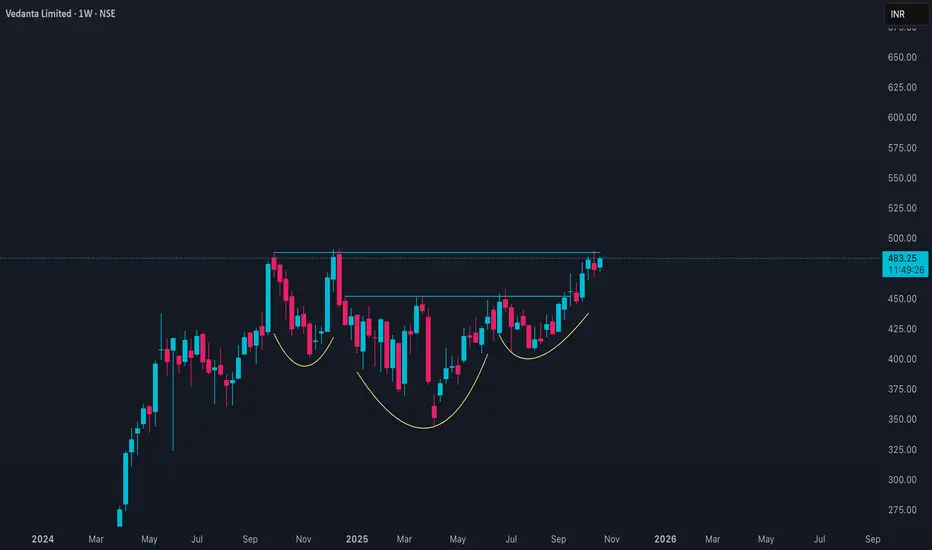
VEDL Price ActionAs of October 23, 2025, **Vedanta Limited (VEDL)** closed at around **₹483.25**, up approximately **1.6%** from the previous close near ₹475.65. The stock traded within a range of ₹474.65 to ₹484.85 during the day, reflecting sustained buying interest and moderate volatility.
Vedanta's market capitalization is about **₹1.89 trillion**, making it one of the largest diversified natural resources companies in India. Its earnings per share (EPS) stand at roughly **₹37.11**, with a price-to-earnings (P/E) ratio of around **13.0**, indicating an attractive valuation relative to some peers in the metals and mining sector.
Technically, Vedanta is in a mild uptrend, trading above both the 50-day (₹452.40) and 200-day (₹441.10) moving averages, which represent strong support levels. The Relative Strength Index (RSI) is near 60, indicating strength without being overbought.
Key support is positioned around ₹475, while resistance may be encountered near ₹490–₹495 levels. Overall, the medium-term outlook is positive, supported by stable commodity prices, cost control measures, and steady operational performance. Traders may look for a breakout above ₹490 to confirm further upside potential, while any dip closer to ₹470–₹475 may be viewed as a buying opportunity.
HCC Price ActionAs of October 23, 2025, **Hindustan Construction Company Limited (HCC)** closed at around **₹28.46**, up about **1.6%** from the previous session’s close near ₹28.01. The stock traded between a low of ₹28.12 and a high of ₹28.91 during the day. The company holds a market capitalization close to **₹5,180 crore** and is ranked 12th in its sector for market cap.
The stock's **P/E ratio** is roughly **30**, with an EPS of ₹0.95 and a book value of ₹4.98. The 50-day moving average is near ₹27.54, while the 200-day moving average is around ₹28.10, showing the price hovers close to long-term averages.
Fundamentally, HCC has reduced debt but continues to face challenges with low sales growth and a low interest coverage ratio. The promoter holding has reduced to approximately 16.7%, with a significant portion pledged. Despite some profits, the company is not currently paying dividends.
Technically, the stock remains in a consolidation phase after the recent uptrend. Support lies close to ₹27, with resistance near ₹29. A sustained move above ₹29 could lead to renewed momentum, while a drop below ₹27 might lead to further weakness.
Overall, the outlook is cautiously neutral to mildly positive, with debt reduction and consolidation underway but growth and profitability concerns persisting.

ONGC Price ActionAs of October 23, 2025, **ONGC (Oil and Natural Gas Corporation Limited)** closed at approximately **₹252.31**, up about **1.69%** from the previous close of ₹248.12. The stock traded within a day range of ₹249.08 to ₹253.24, indicating positive intraday momentum.
The company has a strong market capitalization of around **₹3.17 lakh crore**. The stock’s **P/E ratio** stands at about **8.8**, reflecting a relatively attractive valuation compared to other large-cap energy peers. Earnings per share (EPS) is approximately ₹28.66.
Technically, ONGC remains in an uptrend, trading above its 50-day moving average (~₹239) and 200-day moving average (~₹241), which serve as significant support levels. Momentum indicators such as RSI suggest the stock has room to move higher without being overbought.
Immediate resistance is around ₹255–₹258, while support is near the 50-day moving average. The medium-term outlook is bullish, supported by stable cash flows, rising crude oil prices, and improved operational efficiency. This makes ONGC a generally attractive stock for investors seeking exposure to the energy sector with a blend of growth and value.
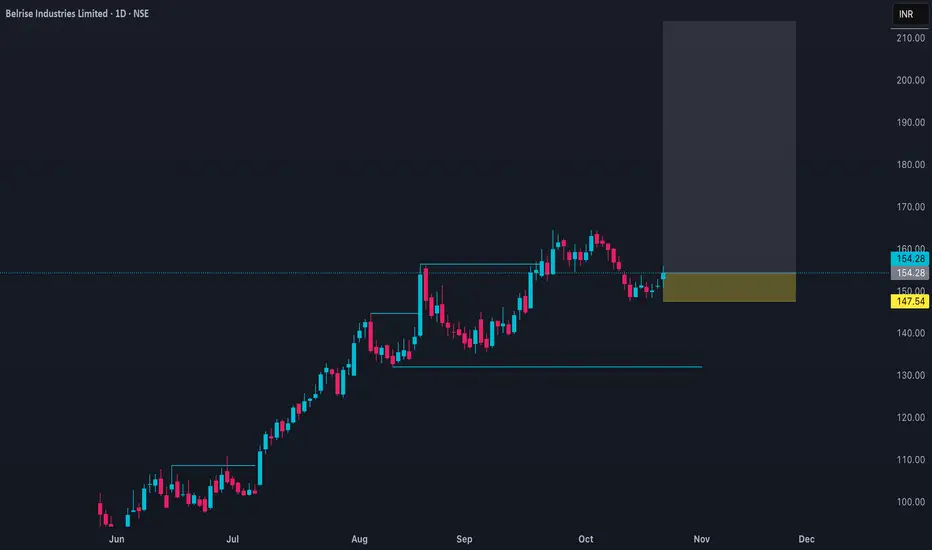
BELRISE Price ActionAs of **October 23, 2025**, **Belrise Industries Ltd (NSE: BELRISE)** closed at **₹154.28**, gaining about **2.1%** from the previous session’s ₹151.08. The intraday range was **₹150.77–₹155.90**, reflecting active trading with high turnover volume exceeding **6.8 million shares**. The company’s **market capitalization** stands around **₹13,730 crore**, placing it in the mid-cap auto components segment.
Belrise’s **52-week range** is between **₹89.15 and ₹164.50**, showing a robust uptrend since June 2025. The stock currently trades above both its **50-day moving average (₹148.8)** and **200-day moving average (₹130.5)**, confirming continued medium-term strength. The current **P/E ratio** is approximately **34.75**, with an **EPS of ₹4.44** and a moderate **dividend yield** of about **0.27%**.
Technically, the structure remains bullish yet nearing a consolidation zone. The **RSI sits around 62**, suggesting healthy momentum but closing in on the overbought range. **Immediate support** levels are near ₹150 and ₹146, while **resistance** lies at ₹156–₹158. A breakout above ₹158 could open targets toward ₹164–₹168, while failure to hold ₹150 might trigger mild profit booking.
Fundamentally, the company maintains steady growth in profitability and has improved its debt profile post-IPO, driving stronger liquidity. With steady earnings, a leaner balance sheet, and diverse auto-component product demand, **Belrise Industries** holds a stable-to-bullish outlook for the remainder of 2025, particularly if sustained above the ₹148–₹150 support zone.
IFBIND Price ActionAs of October 23, 2025, **IFB Industries Ltd (NSE: IFBIND)** was trading around **₹1,893**, showing a modest weekly gain of about 4% and up nearly 40% over the past three months. The stock has recently fluctuated between the **52-week high of ₹2,319.85** and **low of ₹1,060**, indicating strong recovery momentum after several quarters of underperformance.
The company’s **market capitalization** stands near **₹7,480 crore**, placing it in the small- to mid-cap category. The current **P/E ratio** ranges between **60 and 66**, while the **P/B ratio** is close to **8.9**, reflecting that the stock trades at a premium to its book value but roughly in line with other consumer durables peers like TTK Prestige and Voltas. Its **EPS (TTM)** is about **₹26.6**, with **no dividend** declared at present.
Technically, IFBIND maintains a bullish medium-term structure. It has broken out above its 200-day moving average, and the **RSI remains strong around 62–65**, suggesting continued upward momentum without being overbought. Key **support levels** are near **₹1,820–₹1,850**, and **resistance** lies around **₹1,940–₹1,960**. A breakout above ₹1,960 may propel the stock toward ₹2,050–₹2,100, while sustained trade below ₹1,820 could signal a brief pause or retracement.
Overall, the outlook for IFB Industries appears constructive, supported by solid sales growth in its home appliances and motor divisions, improving profitability, and strong cash flow metrics. Short-term consolidation aside, the medium-term bias stays positive as valuations normalize and operational growth remains consistent.

HONASA Price ActionAs of October 23, 2025, **Honasa Consumer Ltd (NSE: HONASA)**, the parent company of “Mamaearth,” closed at around **₹275**, down about **1.7%** from the previous session. The stock traded between **₹272 and ₹278** during the day, showing range-bound price action amid mild selling pressure.
The stock is currently valued at a **market capitalization of approximately ₹8,930 crore**, and it trades at a **P/E ratio of around 123** and a **P/B ratio of 7.7**, reflecting a premium valuation compared to many peers in the personal care segment. Over the past six months, the stock has gained nearly **17%**, while it remains about **36% below** its 52-week high of ₹426.85, indicating a stabilizing price after earlier volatility.
From a technical perspective, Honasa’s momentum remains neutral. Its **RSI is around 49**, signaling balanced market sentiment, while **CCI and MFI indicators** point toward slight downside bias. The price hovers near its **20-day and 50-day moving averages**, suggesting an ongoing consolidation. Immediate **support lies near ₹270–₹272**, with **resistance around ₹285–₹290**. A sustained close above ₹290 could initiate a short-term uptrend, whereas a drop below ₹270 might lead to weakness toward ₹260.
Despite short-term consolidation, the medium-term trend appears stable as the company continues to see revenue growth and brand diversification across its skincare, baby care, and haircare segments. Investors are watching closely for results-driven triggers or marketing expansion news that could decide its next directional move.

TFCILTD Price Action## TFCILTD – Price Analysis (August 2025)
### Price & Market Metrics
- **Current share price:** ₹297.75 (as of August 13, 2025; latest close).
- **Market capitalization:** Approx. ₹2,757crore.
- **52-week range:** ₹122.32 (low) – ₹303.50 (high); new high reached in early August.
- **All-time low:** ₹4.45 (Sep 2001).
- **All-time high:** ₹303.50 (July–August 2025).
- **Day’s range (Aug 13):** ₹282.60–₹303.50.
- **Volume:** 3,955,421 shares traded on Aug 13.
- **Beta:** 1.24, showing moderate volatility.
### Returns & Volatility
- 1-week gain: Around 8.25%.
- 1-month gain: Approximately 4%.
- 1-year return: Roughly 67%.
- Daily moves of 5-6%; volatility is moderate to high recently.
### Valuation
- **Price/Earnings (P/E) ratio:** 31.10–31.47 (much higher than sector average of ~11.4).
- **Price/Book (P/B) ratio:** 2.69–3.14.
- **Book Value Per Share:** ₹94.80–₹110.54.
- **Dividend yield:** About 1.01%; ex-dividend date August 14, 2025.
- **EPS (TTM):** ₹9.46–11.77.
- **Intrinsic value estimate (GF Value):** ₹152.95—current price trades at a 95% premium over this fair value estimate.
### Financial & Business Highlights
- Revenue (TTM): ₹1.58billion.
- Net profit (TTM): ₹1.09billion.
- Net profit margin: Approximately 69%.
- Debt/Equity Ratio: ~70.9% (moderate leverage).
- Gross margin: 99% (financial lending business).
### Technical & Sentiment Overview
- Stock made a new all-time high in early August.
- Trend is bullish, supported by heavy volumes.
- Dividend payout scheduled for September 20, 2025.
- Overall business cited as "average growth, high valuation" in recent analysis.
***
## Summary
TFCILTD is trading near record highs at ₹297.75, well above its estimated fair value and sector norms. The stock’s valuation metrics—particularly its P/E and P/B ratios—are elevated, reflecting strong price momentum and investor enthusiasm. Financial performance shows very high profit margins and reasonable growth, but the premium to intrinsic value signals potential overvaluation risks. Volatility and recent price swings are moderately high. Investors should weigh current optimism and momentum against valuation concerns and sector returns.

Jio Financial Services (JIOFIN)Pattern: Bullish Flag
Breakout Zone: Above ₹312
Structure: Flag developing after a strong pole; EMAs supportive and flattening upward
Momentum: RSI recovering above 50, MACD histogram turning positive
Plan:
Buy Trigger: Close above ₹312
Stoploss: ATR-based (~₹298)
Targets: ₹360 → ₹388
View: Post-consolidation breakout potential; improving sentiment in Financials sector.

SCHAEFFLER Price Action 2 set upsSchaeffler India traded positively on October 21, 2025, closing near ₹3,930 after rising around 1.4% intraday. The day’s range was between ₹3,875 and ₹3,949, reflecting moderate volatility and a short-term recovery from recent consolidation near ₹3,850. The stock’s market capitalization stands around ₹61,300 crore, with a PE ratio close to 59.7 and a PB ratio near 11.3, indicating sustained valuation at a premium relative to the broader market.
Technically, Schaeffler has been moving in a neutral-to-bullish pattern. The RSI sits around 50–55, suggesting balanced momentum without overbought pressure. MACD remains slightly negative but flattening near the signal line, hinting that selling momentum is easing. Key support lies around ₹3,850 and ₹3,780, while resistance is seen at ₹3,980–₹4,050. A decisive breakout above ₹4,050 may reestablish bullish momentum toward ₹4,150–₹4,200.
Overall, the short-term outlook is mildly positive with improving stability in price structure. Sustaining above ₹3,900 will be crucial to continue upward momentum, while any dip below ₹3,850 could invite profit-taking or retesting of deeper supports around ₹3,750. Medium-term investors may await a clearer breakout above ₹4,050 before expecting stronger trend continuation.

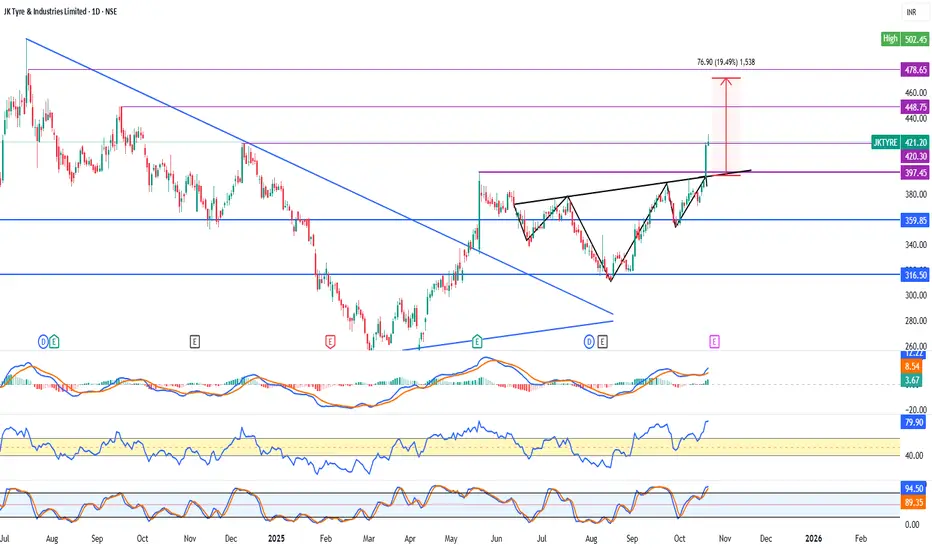
JkTyre Inverted Head & Shoulder PatternHi All…
Greetings!
Today I’m sharing with you JkTyre Daily Chart. Yesterday there has been a good break out in the stock. The stock has made a Inverted Head & Shoulder Pattern and has crossed its Neckline. I think it would a good time to invest in the stock. Hoping for the stock to reach the TGT’s of 420 448 478.
In the coming time I think it should give good returns.
Thanking You
Important Things
1. This is only for educational purposes only.
2. Never over trade.
3. Always keep Stop Loss.
4. Trade in limited quantity.
5. Taking a small loss is better than wiping up your whole capital.
I hope you found this idea helpful.
Please like and comment.
Share with Your Friends.
Keep Learning,
Happy & Safe Trading
Disclaimer – These ideas shared by me to all are my personal analysis / views. I'm not a SEBI registered technical analyst.
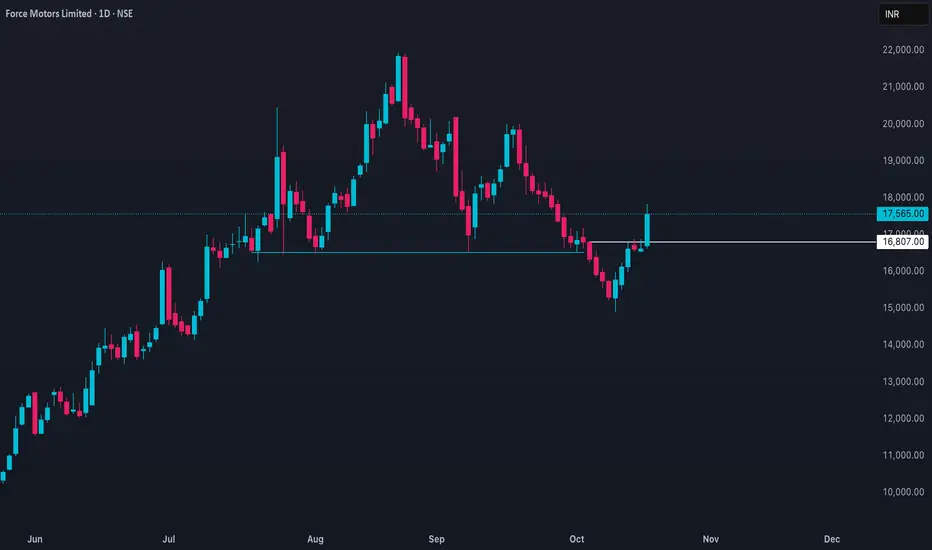
FORCEMOT Price Action PyramiddingForce Motors Ltd closed at ₹17,565 on October 17, 2025, gaining about 5.67% over the previous day amid strong volume and broad sector momentum. The stock traded between a high of ₹17,830 and a low of ₹16,624 during the session. This rise extends a rebound from mid-October levels after multiple sessions of consolidation near ₹16,000.
The near-term structure appears bullish, with momentum indicators showing strength; RSI has climbed above the neutral 50 mark, reflecting renewed buyer interest. The next resistance levels are positioned around ₹17,950–₹18,200, while immediate support lies at ₹17,000 followed by ₹16,500. Sustained closes above ₹18,200 could lead to further upside toward ₹18,800–₹19,000.
Fundamentally, Force Motors maintains a market capitalization of about ₹23,100 crore with a trailing P/E around 26.7 and P/B near 7.0, implying continued valuation expansion supported by strong earnings growth. The broader uptrend from late August lows remains intact, and short-term dips toward support zones may attract buying interest if overall market sentiment stays favorable.
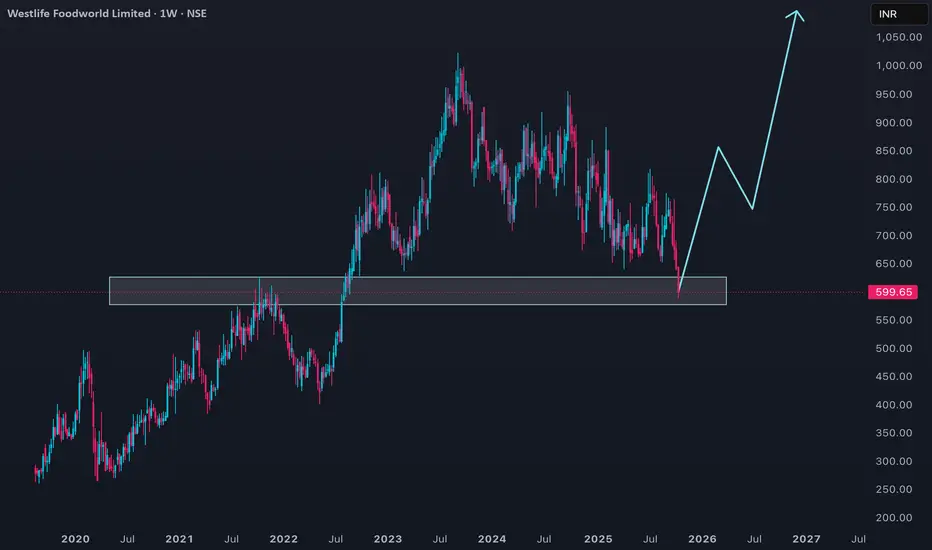
WESTLIFE Price Action Investing set upWestlife Foodworld traded in a downtrend as of October 18, 2025. The closing price was around ₹600, after an intraday range between ₹611.65 and ₹588.05. The broader trend over the last month has been negative, with the stock down about 13% in the last 30 days and nearly 31% off its yearly high of ₹898. Short-term support is near ₹588 and resistance is around ₹645.
The daily average traded price was approximately ₹600.59 and volumes were healthy at over 7 lakh shares. The stock is trading well below its 50-day moving average of ₹707.82, reinforcing the bearish short-term sentiment. Over recent weeks, continued selling pressure and weak technical momentum have prevailed, with no reversal signals as yet.
Technically, as long as the price stays below ₹645–₹650, the near-term outlook remains weak. Sustained closes above ₹650 could trigger a short-covering move, while breach of ₹588 may accelerate downside. Medium-term investors should watch for trend stabilization and base-building above the recent lows before any fresh entry.
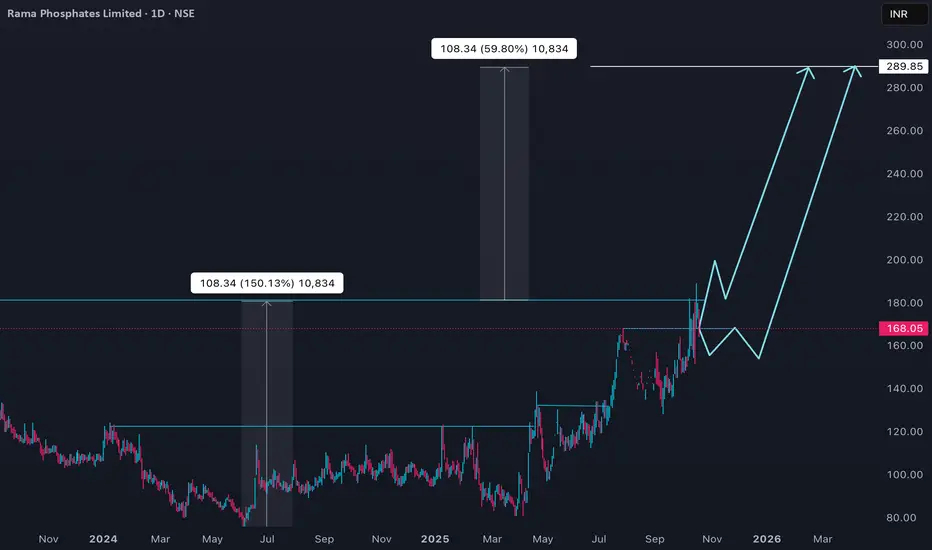
RAMAPHO Price Action Rama Phosphates Ltd (RAMAPHO) closed at ₹168.05 on October 17, 2025, down 4% for the day, with a market cap of about ₹595 crore. The stock has seen a 52-week high of ₹188.90 (October 2025) and a low of ₹80.85 (March 2025), maintaining high volatility with a 20% daily price band set by the exchange.
Recent trading volumes remain strong, with 380,240 shares traded and a value of ₹6.39 crore on the latest trading day. The September 2025 quarter results showed net sales of ₹245.93 crore and a net profit of ₹17.28 crore, translating to an EPS of 4.88, indicating continued operational strength.
Technically, RAMAPHO has corrected from recent all-time highs but is backed by strong fundamentals—a TTM P/E of 14.09, P/B of 1.64, and a return on equity (ROE) of 4.72%. Comparisons with sector peers suggest the stock remains attractively valued relative to its earnings and book value, and optimism holds among some market watchers for medium-term upside toward the ₹500 level if earnings growth sustains.
Dividend activity and bulk deals in recent weeks have contributed to price swings, and investors should watch for ex-dividend dates and upcoming financial announcements for additional momentum triggers.
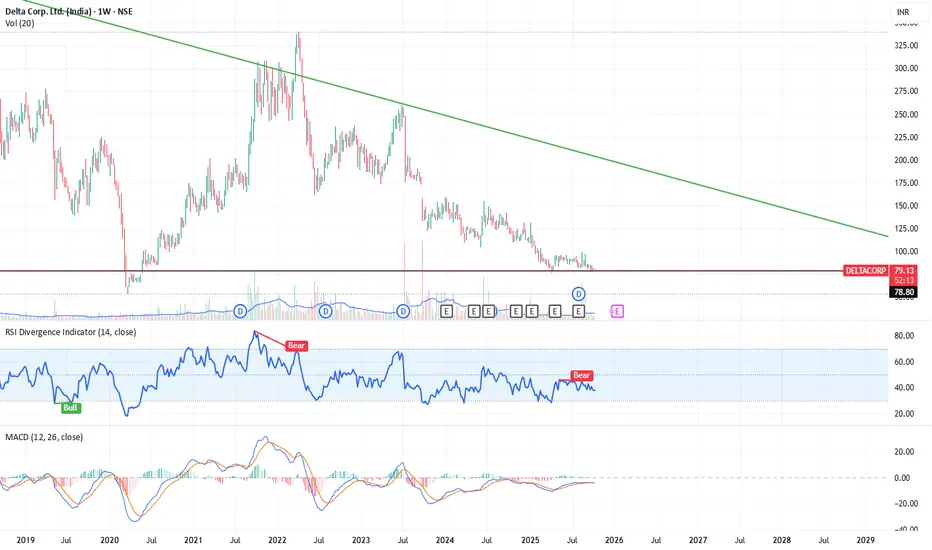
Delta Corp | Support Zone Rebound | Long term analysisThis chart presents a technical study of Delta Corp Ltd. focusing on the historical price behavior around a strong support zone near ₹78 and the potential for a rebound toward the long-term descending trendline.
🔍 Overview :
Support Zone Identification: The ₹78–₹79 level has acted as a multi-year horizontal support, with multiple past price reactions and bounces from this region.
Trendline Resistance: A long-term downward sloping trendline from the 2021 peak serves as a key resistance. Historically, price has respected this line, making it a crucial level to monitor for any rebound attempt.
Indicators Used:
RSI (Relative Strength Index) shows the stock is currently in the oversold zone (<40). Past oversold readings near this support level have led to bullish reversals.
MACD currently shows bearish momentum but is approaching a zone where reversals have previously occurred.
Volume remains modest, but any increase near support may indicate accumulation.
📈 Trade Study Hypothesis:
If the support holds, the price may potentially rebound toward the trendline (currently near the ₹110–₹120 range), offering a medium-term technical play. A strong bullish signal would be a breakout above the trendline with volume confirmation.
⚠️ Note:
This idea is intended purely for educational and analytical purposes. It is not a recommendation to buy, sell, or hold any security. Always perform your own due diligence or consult a financial advisor before making investment decisions.
MSTCLTD Price ActionMSTC Limited (MSTCLTD) is currently trading in the ₹511–₹544 range, having closed around ₹543 on October 16, 2025. The stock recently rebounded over 5% within two sessions after experiencing a multi-day decline. Typical intraday volatility fluctuates between 2% and 3%.
Short-term technical indicators are mixed, with daily moving averages showing mild bearishness, while weekly momentum indicators are turning slightly bullish. On a monthly basis, trend signals remain bearish and Bollinger Bands suggest mild negative pressure over broader timeframes. Key support is noted near ₹540, immediate resistance is around ₹548, and there is major volume support at approximately ₹540.5. If the price breaks below ₹518, it may invite further declines; conversely, moving above ₹548–₹551 could enable a rally toward ₹560 or higher.
Fundamentally, MSTC is a small-cap company with a market capitalization just under ₹3,850 crore. Latest financials show flat sales and subdued long-term growth, though multi-year returns have outperformed benchmark indices over three and five years. Current share price trades at a substantial premium to its estimated intrinsic value, resulting in a stretched valuation compared to historical averages. The company maintains consistent dividend payouts, with the latest declared at ₹4.5 per share in April 2025.
Overall, MSTCLTD is showing short-term optimism due to a price rebound, but technical setups and high valuations suggest caution. Sustained upward movement will depend on fundamental improvement and supportive broader market conditions.

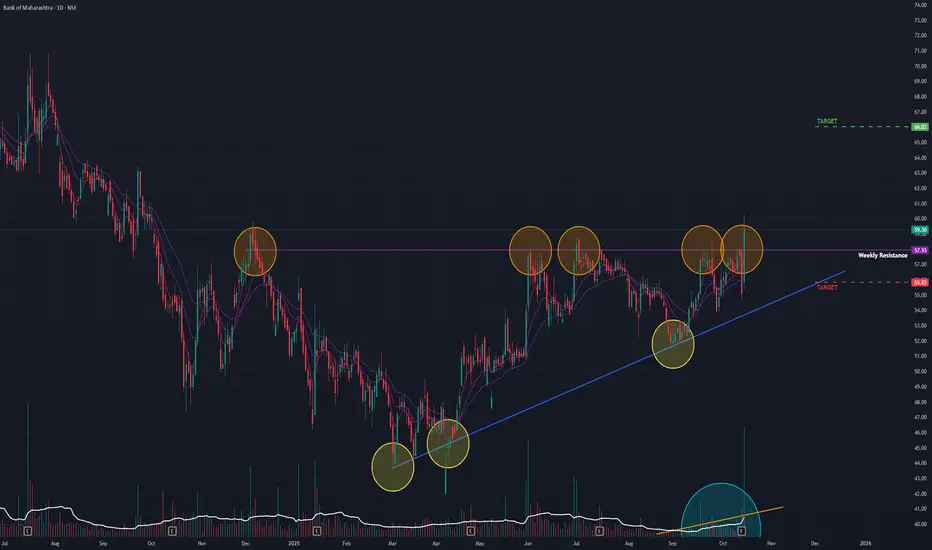
Bank of Maharashtra (D) - Breaks Out of Bullish Triangle PatternBank of Maharashtra has delivered a powerful bullish signal today, breaking out of a classic Ascending Triangle pattern on high volume. This decisive move suggests that its consolidation phase is over and a new uptrend is likely beginning.
The Setup: An Ascending Triangle
Following a prior downtrend, the stock meticulously formed an Ascending Triangle pattern. This is a classic bullish structure characterized by a series of Higher Lows consistently pushing up against a flat horizontal resistance level, which in this case, has been in place since December 2024. This pattern indicates a gradual build-up of buying pressure.
Today's Decisive Breakout
Today's session (Wednesday, October 15, 2025) confirmed the bullish outlook with authority:
- Strong Price Surge: The stock rallied by an impressive +7.60% .
- Confirmed Breakout: The price decisively broke out and, importantly, closed above the key horizontal resistance of the triangle.
- Huge Volume: The breakout occurred on huge trading volume , which provides strong confirmation and indicates significant buyer participation.
Adding to the conviction, as you noted, trading volume has been steadily increasing over the past few days, suggesting smart money was accumulating shares in anticipation of this move.
Underlying Technical Strength
The breakout is well-supported by key momentum indicators. The short-term Exponential Moving Averages (EMAs) and the Relative Strength Index (RSI) are both in a strong bullish state across the Monthly, Weekly, and Daily timeframes, indicating broad-based strength.
Outlook and Key Levels
With the bullish pattern now confirmed, the path of least resistance has shifted firmly upwards.
- Bullish Target: If the stock sustains this breakout momentum, the next logical area of resistance and potential price target is the ₹65 level.
- Bearish Target: If the stock fails the breakout momentum, it could pull back to the support level around ₹54
In conclusion, today's high-volume breakout from a classic bullish pattern is a very strong technical signal. The key now is for the price to remain above the ₹58 support level to validate the start of a new, sustained uptrend.
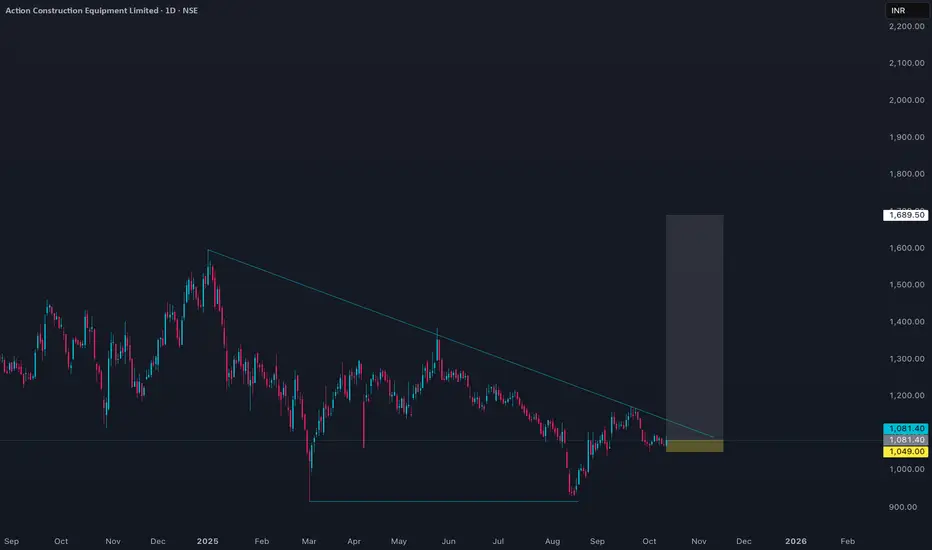
ACE Price Action with probable 18R trade set up- Current Price: Around ₹1,081 as of October 2025.
- Market Capitalization: Approximately ₹12,870 Crores.
- 52-week Range: The stock traded between ₹917 and ₹1,600 in the past year.
- PE Ratio: Roughly 31, indicating moderate to high valuation relative to earnings.
- EPS: Around ₹34.4 (TTM).
- Price-to-Book Ratio: About 8, suggesting a premium valuation relative to its book value.
- Dividend Yield: Low, approximately 0.19%.
- Revenue and Profit: Latest annual revenue near ₹3,245 Crores and net profit around ₹423 Crores.
- Price Trend: The stock has faced some downside pressure recently with a 19% decline over the last year but historical performance showing strong growth over 3-5 years.
- Volatility: The stock is moderately volatile, about 3.2 times more than the Nifty index.
- Sector: ACE operates in the heavy machinery and industrial equipment sector, showing good profitability and efficiency metrics with consistent earnings growth.
Overall, ACE trades at a premium valuation reflecting growth expectations but recent price corrections indicate some caution in the market. The company shows good fundamentals with strong earnings growth potential balanced against sector cyclicality and market volatility.
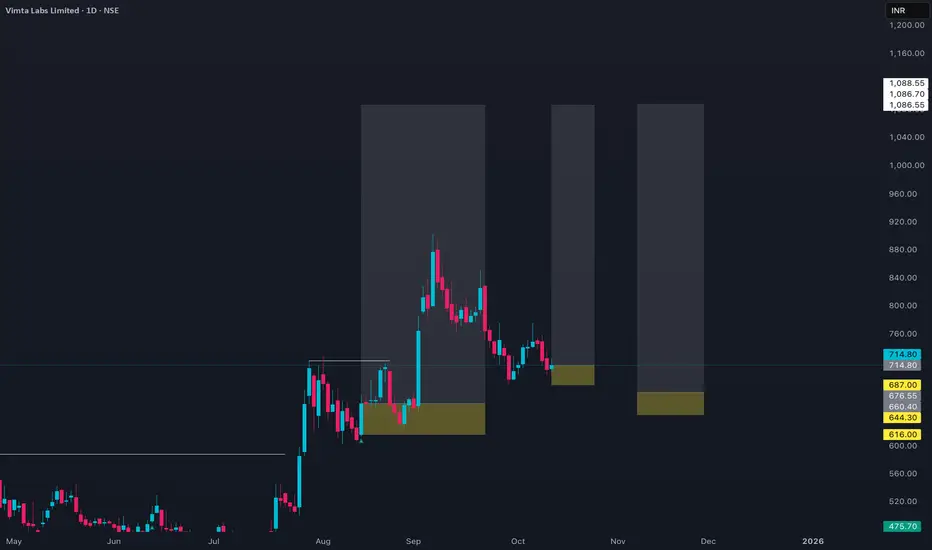
VIMTALABS: Probable pyramid entries
- Current Price: Around ₹715 as of early October 2025, with daily price fluctuations between approximately ₹700 and ₹723.
- 52-week Range: The stock has traded from a low near ₹270 to a high around ₹903, showing strong growth over the past year.
- Market Capitalization: About ₹3,180 Crores.
- Valuation: PE ratio stands near 45, indicating a moderately high valuation relative to earnings.
- Earnings: EPS is about ₹15.9.
- Moving Averages: The 50-day average price is roughly ₹719, and the 200-day average is near ₹545, indicating medium-term momentum in an uptrend.
- Dividend Yield: Very low at around 0.14%, consistent with growth-oriented companies.
- Volume: Recent trading volumes average about 60 lakh shares daily, indicating good liquidity.
- Price Trend: The stock has experienced some volatility but sustained gains overall, with occasional pullbacks and rebounds, reflecting investor confidence in the company’s niche testing and laboratory services sector.
- The stock price structure indicates a bullish phase supported by improving fundamentals and positive market sentiment.
Overall, Vimta Labs shows strong upward price momentum with a solid growth profile, trading at a premium that reflects optimism about its expanding testing services business.
HERITGFOOD Re-entry set upHeritage Foods Limited (HERITGFOOD)
- Current Price: Approximately ₹496 as of mid-October 2025, with a day range between ₹485.7 and ₹497.7.
- 52-week Range: The stock has traded between ₹355.55 (low) and ₹658 (high) in the past year.
- Market Capitalization: About ₹4,607 Crores.
- Valuation: PE ratio stands around 27, indicating moderate valuation given its dairy sector positioning.
- Earnings: EPS of about ₹18.34.
- Moving Averages: The 50-day average price is approximately ₹483, and the 200-day average is near ₹443, showing a recent upward trend with solid support.
- Dividend Yield: Roughly 0.5%, reflecting modest income for shareholders.
- Volume: Daily traded volumes average around 16,000 shares.
- Performance Trends: Over recent years, the company has grown sales significantly, with a healthy profit recovery and improving operating margins. The stock price has demonstrated a mid-term rising trend with potential upsides based on recent positive momentum.
- Market Sentiment: Moderate volatility with periodic volume increases correlating with price advances.
Overall, Heritage Foods exhibits stable financials with steady profitability and moderate valuation in the food processing sector, trading near its short-term highs with a cautiously optimistic outlook for further gains.

ADANIPORTS Pice Action- The stock is trading around ₹1,438 as of mid-October 2025, with a day range from approximately ₹1,396 to ₹1,442.
- On a 52-week basis, the stock fluctuated between a low of about ₹995 and a high near ₹1,494, currently trading closer to its upper range.
- Market capitalization is around ₹3.1 lakh Crores, making it one of the largest port infrastructure companies in India.
- The PE ratio is about 27.5, reflecting a moderate valuation for a growing infrastructure sector leader.
- Book value per share is about ₹288, so the stock trades at approximately 5 times book value.
- Dividend yield is low, near 0.5%, consistent with reinvestment into growth.
- Recent quarterly results showed a 6.5% rise in net profit and a strong 31% increase in revenue year over year.
- The stock has demonstrated steady sales and profit growth over the past five years with roughly 23% CAGR in profits.
- Return on capital employed (ROCE) is approximately 13.8%, with return on equity (ROE) close to 18.8%, signaling efficient use of capital.
- The stock has shown volatility with daily price swings around 2%, reflecting sensitivity to macroeconomic factors and sector developments.
Overall, ADANIPORTS remains a strong performer in the infrastructure sector with solid fundamentals, consistent growth, and trading at a fair valuation reflecting its leadership in port and logistics services.

Fortis Healthcare’s share price analysisFortis Healthcare’s share price is currently around ₹667, reflecting strong momentum and significant outperformance over the past year, with a return of about 49%. The stock recently touched a 52-week high of ₹744.5 and a low of ₹406, indicating a broad trading range and robust investor interest
Analyst sentiment remains bullish, with most forecasts targeting a price range of ₹736 to ₹850 over the next 12 months, suggesting a potential upside of around 10–20% from current levels . Some projections are even more optimistic, with year-end 2025 targets as high as ₹933 if market conditions remain favorable . Technical indicators currently point to a bullish trend, supporting the positive outlook .
Fundamentally, Fortis Healthcare has reported strong financial results, including an 84% year-on-year jump in net profit for Q3 FY2024-25 and a 40% quarterly profit increase, underscoring operational momentum . The company trades at a price-to-earnings (PE) ratio of about 65, which is above the sector average, indicating that the stock is priced at a premium due to its growth prospects . The price-to-book (PB) ratio is 3.49, and the dividend yield is modest at 0.24% .
In summary, Fortis Healthcare is in a bullish phase, supported by strong earnings growth and positive analyst outlooks. While the stock is trading at a premium valuation, its growth trajectory and sector leadership continue to attract investor interest, with further upside likely if current trends persist
