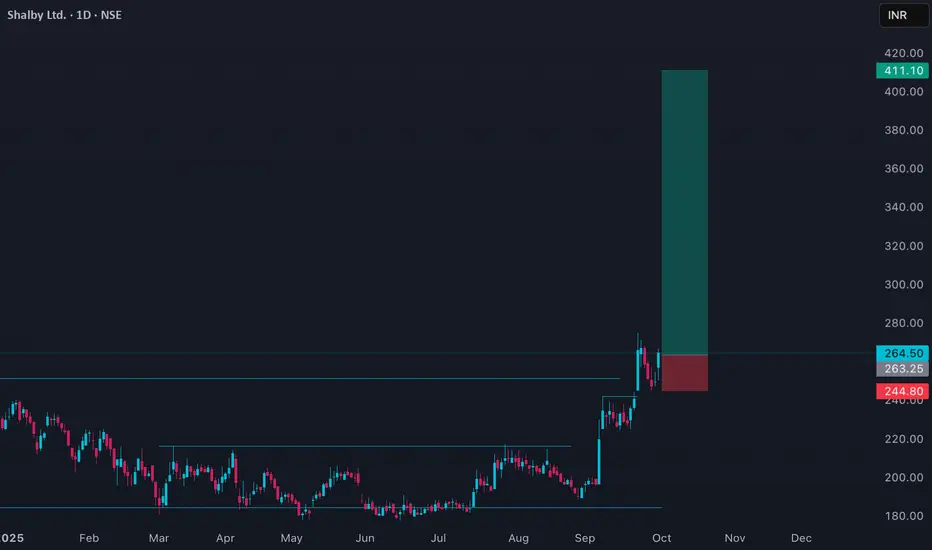
SHALBY Price ActionShalby Limited (SHALBY) is currently in a strong uptrend, closing today at ₹264.85 with a gain of about 6.64%. The stock has traded between ₹250.05 and ₹266.60, showing high momentum and robust volume, indicating strong buying interest.
Price action reveals that SHALBY is trading well above both its 50-day average (~₹214.55) and 200-day average (~₹205.60), confirming the bullish trend. The stock is nearing its 52-week high of ₹282.30, which represents a critical resistance level to watch. Immediate support levels are around ₹250, providing a cushion against potential short-term corrections.
Technical indicators suggest the stock is in an overbought zone, so while the momentum is positive, some consolidation or profit-taking may occur near resistance. Overall, the price action signals continued strength and bullish sentiment, with potential for further upside if the stock breaks above the 52-week high on strong volume.
Bullishpattern
JKPAPER Price ActionJK Paper Limited (JKPAPER) closed today at ₹385.50, up 3.34% from the previous close of ₹373.05. The stock traded between ₹372.60 and ₹392.95, showing solid buying momentum and trading above its 50-day average of about ₹374, and 200-day average near ₹359.
Technically, JKPAPER is in a moderate uptrend with positive momentum, supported by strong volume and close above short-term averages. The stock faces near-term resistance around ₹395, with strong support around ₹370. Momentum indicators suggest continued bullish bias but overbought conditions could lead to temporary consolidations.
Fundamentally, JK Paper benefits from steady demand in the paper and packaging sector along with improving operational efficiency. The company reported stable revenue growth and improving margins recently, supporting positive sentiment. The medium-term outlook looks constructive if the stock sustains above support and breaks resistance decisively.

BANKINDIA Pyramid set upBank of India (BANKINDIA) closed today at ₹123.35, up 3.79% from the previous close of ₹118.85. The stock traded in a range between ₹118.90 and ₹123.85 on strong volume, showing renewed buying interest. It is trading above its 50-day moving average (~₹114.67) and 200-day moving average (~₹110.67), indicating bullish momentum.
Technically, the stock is in an uptrend with immediate support at ₹119 and resistance around ₹130, the recent 52-week high. Momentum indicators like RSI suggest moderate strength, with room to move higher before overbought conditions. The price action is supported by a solid market cap and improving financials, aligning with positive sentiment in the banking sector.
Overall, Bank of India shows a robust short to medium-term outlook, with potential for further gains if it sustains above current support and builds upon buying momentum. Watch for any breakouts above ₹130 for acceleration, or a dip below ₹119 that may trigger some consolidation.

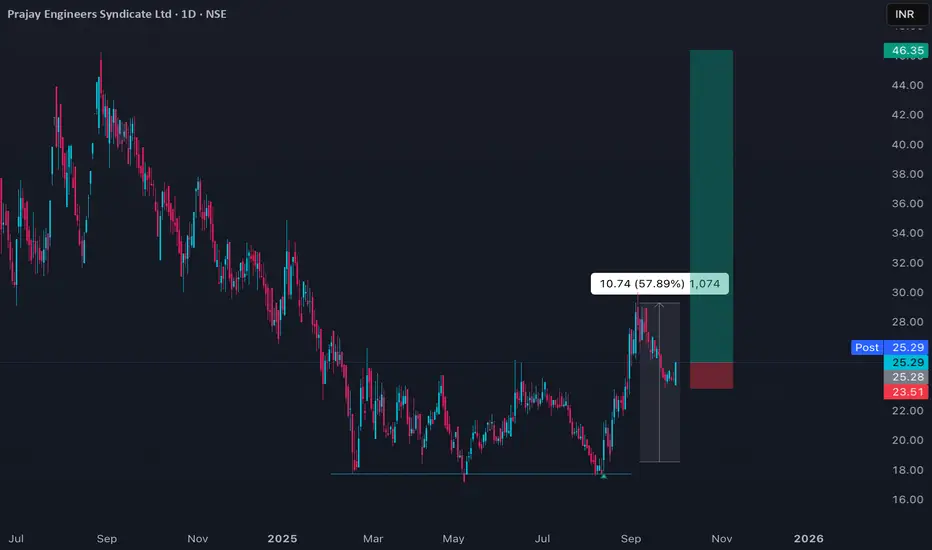
PRAENG Pyramid Set upPrajay Engineers Syndicate Ltd (PRAENG) traded mildly positive today, with prices fluctuating within a narrow range around ₹20. The stock continues its recovery from recent lows, showing incremental gains over the past few sessions. Short-term technical indicators suggest the price is trading above its 20-day moving average, signaling some regained bullish momentum, but the overall trend remains sideways.
Momentum signals such as RSI are moderately positioned, indicating neither strong buying nor oversold conditions. Volume is stable but not exceptionally high, which points to limited participation and tempered volatility. Support for PRAENG is near ₹18, reflecting the base built over the last month; resistance appears at ₹22, where previous rallies have stalled.
Fundamentally, the company has delivered modest improvement in sales and managed to reduce operational losses recently, but overall business and industry headwinds persist. The medium-term outlook stays neutral, with further upside possible if the stock can close above the ₹22 resistance zone on higher volume. Conversely, a drop below support may trigger another leg down in price.
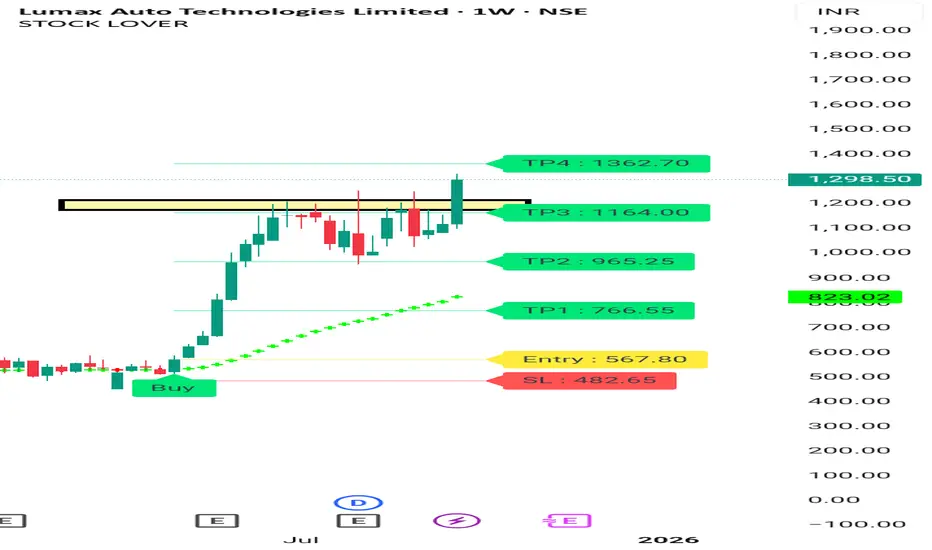
Lumax Tech Breakout On Weekly Chart Full auto Ancillary Sector is on. Breakout. Lumax Tech also Give Breakout.
It's good bet for Medium to long term with a StopLoss.
Tgt 1500 -1800
Keep SL of 10%
Consult your financial advisor before making any position.
For more information visit my profile on Tradingview.
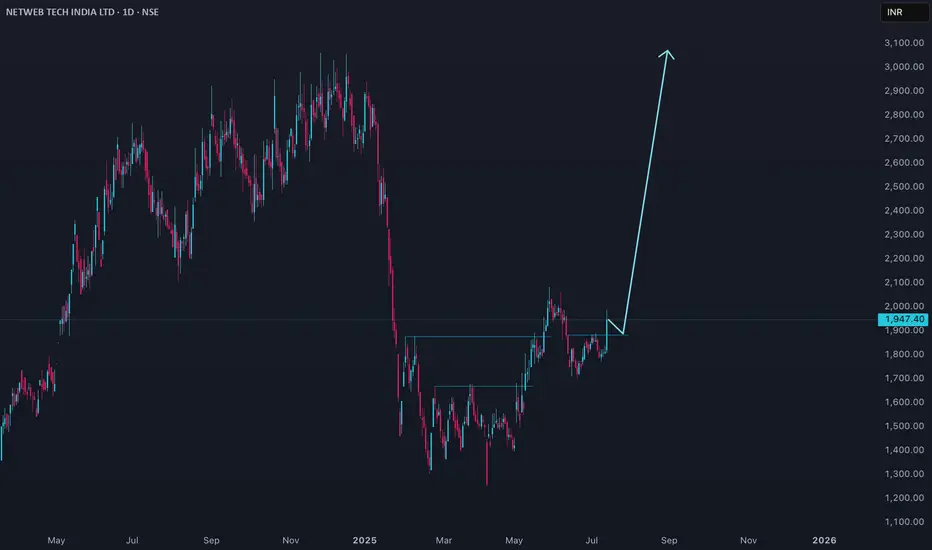
NETWEB Price actionNetweb Technologies (NETWEB) is trading at ₹1,947.40 as of July 11, 2025. The stock has shown a strong short-term recovery, up about 7.4% in the last session and nearly 6.8% over the past week, but it remains down by over 25% in the past six months. The 52-week high is ₹3,060 and the low is ₹1,251.55.
Valuation-wise, NETWEB is trading at a high price-to-earnings ratio (around 90–96) and a price-to-book ratio near 20, indicating a premium valuation. The company’s market capitalization is approximately ₹11,000 crore. Promoter holding has slightly decreased in the recent quarter.
For the near term, technical targets suggest resistance around ₹2,000–2,040 and support in the ₹1,750–1,850 range. Analyst forecasts for the next year place price targets between ₹1,824 and ₹2,805.
Fundamentally, the company is considered overvalued at current levels, despite strong recent profit growth. The stock’s premium valuation and recent volatility suggest caution for new investors, with further upside dependent on continued earnings momentum and broader market sentiment.
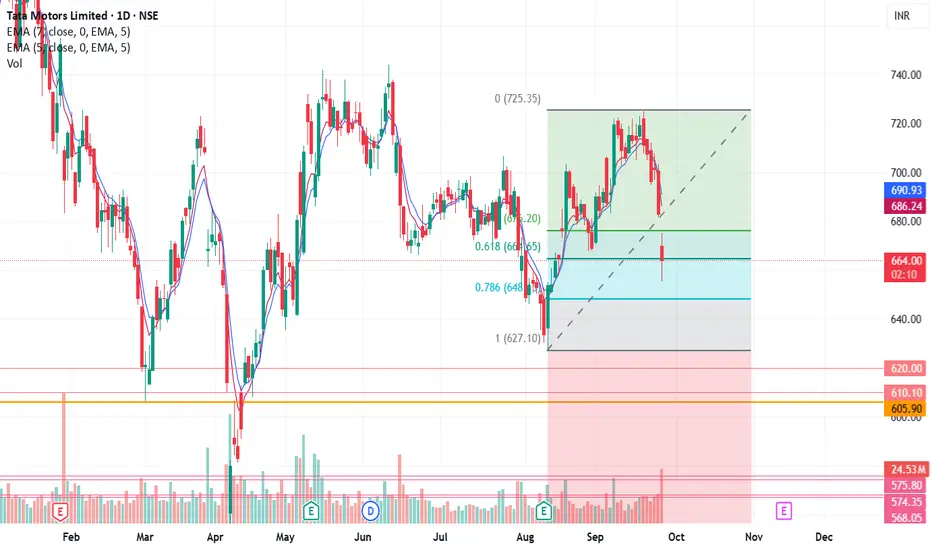
On Golden level of Fibonacci RetracementWith recent bullish momentum in the Auto industry, this looks like a good time to catch Tatamotors as it is on the Fibonacci Retracement golden level. I am bullish on this. Pinbar candle on the bottom on a daily basis gives me more confidence.
TTKHLTCARE Price ActionTTK Healthcare Ltd closed at ₹1,190 today, with a marginal decline of 0.03%. The stock traded in a tight intraday range between ₹1,189 and ₹1,205, showing sideways movement with modest trading volumes. Current price trends suggest consolidation after recent declines, as the stock has retreated significantly from its 52-week high of ₹1,770 but remains above its yearly low of ₹1,101.
Technically, TTK Healthcare is hovering around its 50-day average but well below its 200-day moving average, signaling caution in the medium term. Momentum indicators remain neutral, with no decisive bullish or bearish signals emerging. Support is visible near ₹1,180, while resistance stands at ₹1,205; any sustained breakout or breakdown beyond these levels could direct the next move.
Fundamentally, the company maintains a price-to-earnings ratio of about 26.65 and an EPS of ₹44.65. Dividend yield is moderate. Overall, TTK Healthcare is consolidating near lower price bands, and short-term direction will depend on movements beyond its current range, with traders watching for fresh volume or breakout signals.

JINDALPOLY Price ActionJindal Poly Films Ltd closed today at ₹595.45, slipping slightly from the previous session. The stock traded in a tight intraday range between ₹588.05 and ₹597.80, showing muted price action after a recent attempt at a short-term rebound. Volumes remained below the 20-day average, indicating cautious sentiment and potential lack of follow-through by buyers.
Technically, the stock remains below its 200-day moving average, highlighting medium-term weakness, but it has managed to hold above its 50-day average, which provides some hope for short-term recovery. The company’s 52-week high is ₹1,150, while the 52-week low is ₹505.55—a sign of significant past volatility and correction. Book value per share is considerably higher than current price, contributing to a low price-to-book ratio near 0.62, and the price-to-earnings ratio remains negative due to recent losses.
Momentum indicators are neutral with no clear trend reversal signal. Despite a mild recovery in recent weeks, medium- and long-term returns remain negative. The company announced a final dividend of ₹5.9 per share, resulting in a 1% dividend yield in line with the industry average, but forward earnings outlook remains constrained and free cash flows are a concern.
Overall, Jindal Poly Films is currently in a consolidation phase after a long downtrend, displaying a defensive and range-bound character. Sustained trading above ₹600–₹610 could improve bullish prospects, while a breakdown below ₹588 may lead to renewed weakness. Investors should monitor volume and price action within this narrow range for early signals of the next directional move.

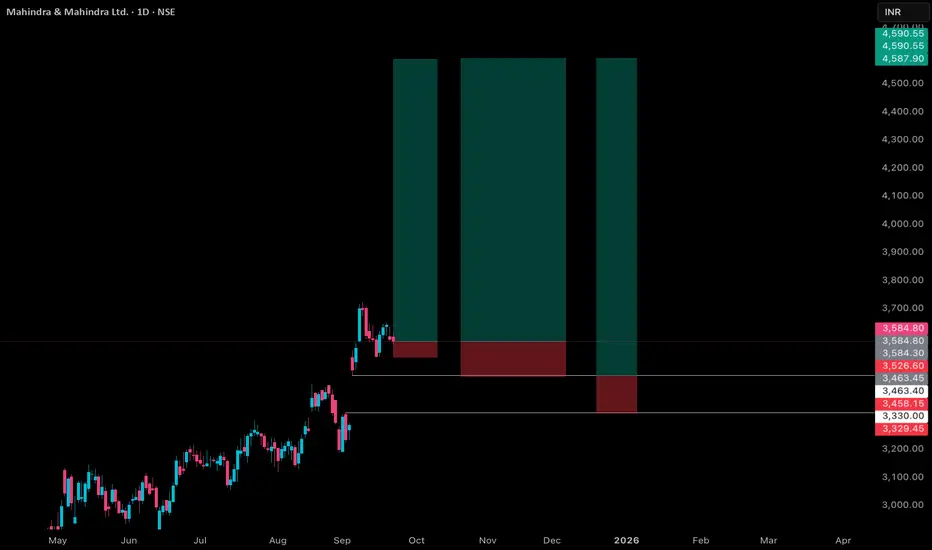
Mahindra & Mahindra Price ActionMahindra & Mahindra (M&M) closed today at ₹3,584.8, showing a slight decline of about 0.2% from the previous close. The stock traded in a range between ₹3,569 and ₹3,616 during the session, indicating sideways movement with moderate volatility. Despite the minor pullback, M&M remains well above its 50-day and 200-day moving averages, supporting its medium-term upward trend.
The stock exhibits strong fundamentals with an EPS of ₹122.13 and a price-to-earnings ratio near 29.35, reflecting reasonable valuation relative to its earnings. Return on capital employed (ROCE) stands around 13.9%, and the company has a consistent track record of delivering sales and profit growth at healthy compounded annual rates over recent years.
Key support levels to watch are ₹3,550 and ₹3,500, while resistance lies near the recent session high at ₹3,616 and extends toward the 52-week high vicinity near ₹3,724. Momentum indicators show mild consolidation, suggesting that a break above resistance could lead to renewed buying interest.
Overall, M&M is in a stable position with a constructive outlook, balancing between short-term consolidation and medium- to long-term targets driven by robust business performance and diversified presence across automotive and industrial segments.
VSTTILLERS Price Action Multiple set upVST Tillers Tractors Ltd closed today at ₹5,186, slipping slightly by approximately 0.86%. The stock traded between an intraday low of ₹5,146 and a high of ₹5,272, reflecting minor profit booking after recent robust gains. The company remains fundamentally strong, operating with zero debt for the last five years and consistently offering a dividend payout.
Technically, VST Tillers holds above its 50-day and 200-day moving averages, maintaining its uptrend on the daily chart. The price-earnings ratio is approximately 39, and return on capital employed stands healthy. Support is clustered around ₹5,146, with the next key zone near ₹5,100; resistance is seen at ₹5,272 with the all-time high at ₹5,548. In terms of market cap growth and volume, investor interest remains elevated, supporting its overall upward trajectory.
In summary, VST Tillers is showing strong medium-term structure with bullish bias. Pullbacks have attracted buyers and, barring a decisive fall below ₹5,100, the stock is well positioned for further appreciation towards its 52-week high region.

SYRMA Price ActionSyrma SGS Technology Ltd closed at ₹816.25 today, down 1.39% with a loss of ₹11.5 from the previous session. The stock opened at ₹834.80 and traded within a range of ₹811.95 to ₹836.95, reflecting a mildly bearish session after demand failed to sustain above recent highs. Despite the pullback, Syrma SGS remains in a firm uptrend on longer time frames, still trading well above its 50-day and 200-day averages.
The price action signals some profit booking near resistance zones close to ₹837, while immediate support now lies at ₹812 and secondary support at ₹800. With the recent rally, momentum indicators are cooling but not oversold, suggesting a potential for pause or minor consolidation before the next directional move. With a price-to-earnings ratio near 72.5, Syrma trades at a premium on growth expectations, and market cap continues to expand, standing around ₹14,544 crore.
Overall, the technical posture remains bullish in the medium term, though short-term traders should watch for stabilization near support zones and a decisive close above ₹837 for renewed upside momentum.

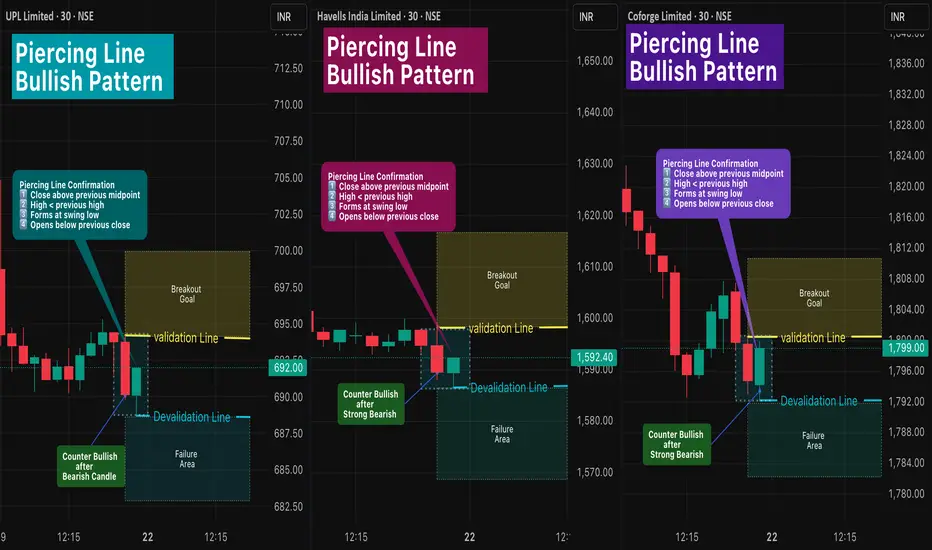
Piercing Line Bullish Pattern 🔎 Intro / Overview
The Piercing Line Pattern is a two-candle bullish reversal setup that forms after a downtrend.
- Sellers lose control → Buyers step in strongly.
- Entry and exit are rule-based using Validation and Devalidation lines to restrict false signals.
- Stop-loss is based on swing low, and Target is 1R (equal to risk distance).
This setup can be applied across any symbols and any timeframe (Just make sure it is after Downtrend or at Swing Low).
📊 Example symbols in this idea:
NSE:UPL · NSE:HAVELLS · NSE:COFORGE
___________________________________________________________
📌 How to Use
✅ Piercing Line Pattern – Confirmation Rules
1️⃣ Close Above Midpoint → The second candle must close above the midpoint of the first bearish candle.
2️⃣ Lower High Condition → The second candle’s high should be lower than the previous candle’s high, showing controlled recovery rather than immediate breakout.
3️⃣ Swing Low Context → The pattern forms after a swing low or decline, signaling potential reversal from bearish to bullish.
4️⃣ Gap/Open Condition → The second candle should open below the prior candle’s close, reflecting initial selling pressure before buyers take over.
When Pattern Confirm - Entry Rules -
📌 Validation → Close above the Pattern High .
📌 Devalidation → Close below Swing Low before validation.
When all conditions align, the Piercing Line confirms a bullish reversal opportunity.
__________________________________
🎯 Trading Plan
- Entry → Candle closes above the Validation line (Pattern high).
- Failure → If candle closes below Devalidation line before validation.
- Stoploss → Swing Low.
- Target → Equal to stoploss distance (1R).
___________________________________________________________
📊 Chart Explanation
All Patterns shown in 30-min timeframe :
1️⃣ NSE:UPL (UPL Limited)
- Entry @ 694.20 → Breakout Goal confirmed only on candle close above this level.
- Devalidation Level: If price closes below 688.70 , the Pattern shifts to the Failure Area.
2️⃣ NSE:HAVELLS (Havells India Limited)
- Entry @ 1598.20 → Breakout Goal confirmed only on candle close above this level.
- Devalidation Level: If price closes below 1586.50 , the Pattern shifts to the Failure Area.
3️⃣ NSE:COFORGE (Coforge Limited)
- Entry @ 1800.50 → Breakout Goal confirmed only on candle close above this level.
- Devalidation Level: If price closes below 1792.10 , the Pattern shifts to the Failure Area. .
📊 All three Patterns are live and active in the same timeframe.
___________________________________________________________
👀 Observation
- Piercing Line is most effective near swing lows after a clear downtrend.
- Strict validation/devalidation rules help avoid false entries.
- Works well across multiple symbols when conditions align.
___________________________________________________________
❗ Why It Matters?
- Defines entries and exits clearly with rule-based validation.
- Provides a structured framework to trade reversals confidently.
___________________________________________________________
🎯 Conclusion
The Piercing Line Pattern is a disciplined bullish reversal signal.
By combining Validation and Devalidation Rules, traders gain clarity and protection against false trades.
🔥 Patterns don’t predict. Rules protect. 🚀
___________________________________________________________
⚠️ Disclaimer
📘 For educational purposes only.
🙅 Not SEBI registered.
❌ Not a buy/sell recommendation.
🧠 Purely a learning resource.
📊 Not Financial Advice.
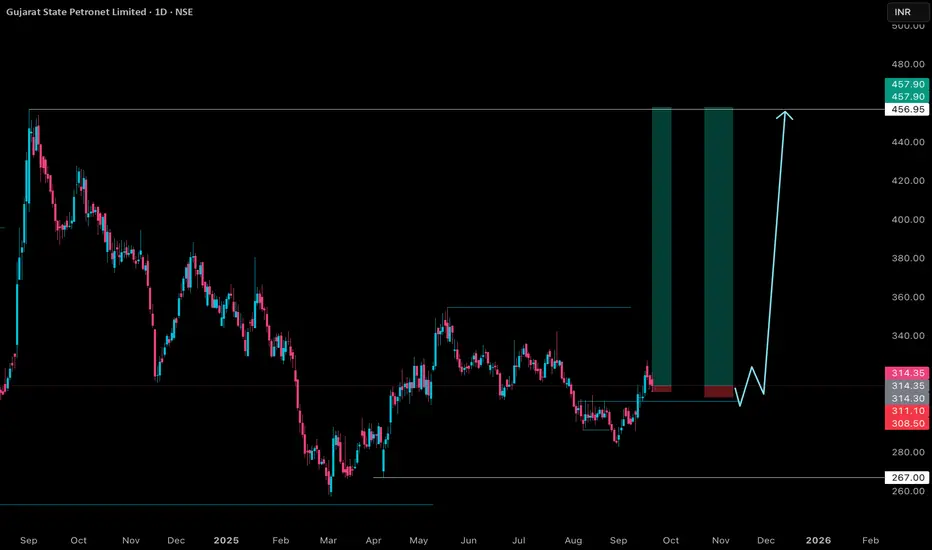
GSPL Price Action, muliple trade set upGSPL (Gujarat State Petronet Ltd) traded firm today, closing near ₹387 and maintaining a robust uptrend. The stock established an intraday range between ₹379 and ₹392, with active buying visible on dips. Technical structure continues to favor the bulls, as GSPL remains well above its short-term moving averages and consistently sets higher lows on the daily chart.
Momentum indicators are positive but not overbought, pointing to continued strength with scope for moderate upside. Immediate resistance is placed at ₹395, and a breakout above this level could target the ₹410–₹420 range. Support levels are found at ₹380 and ₹372; a fall below these may prompt short-term profit booking, but trend reversal signals remain absent for now.
Overall, GSPL’s price action and technicals highlight sustained bullish sentiment, with pullbacks finding buyers and volume trends supporting further gains as long as it holds above key support zones.
Nifty50 - Set to March towards 30KNifty is showing strong bullish momentum backed by multiple signals
Trendline Breakout from consolidation
Cup & Handle Formation indicating continuation
Three White Soldiers Candles
Reversal from Crucial Support near 24,300
Multi-Timeframe Alignment (Daily, 4H, Weekly)
Entry: 25,670
With strong confluence of bullish signals, Nifty50 looks set to march towards the 30K in Next 5-6 Months

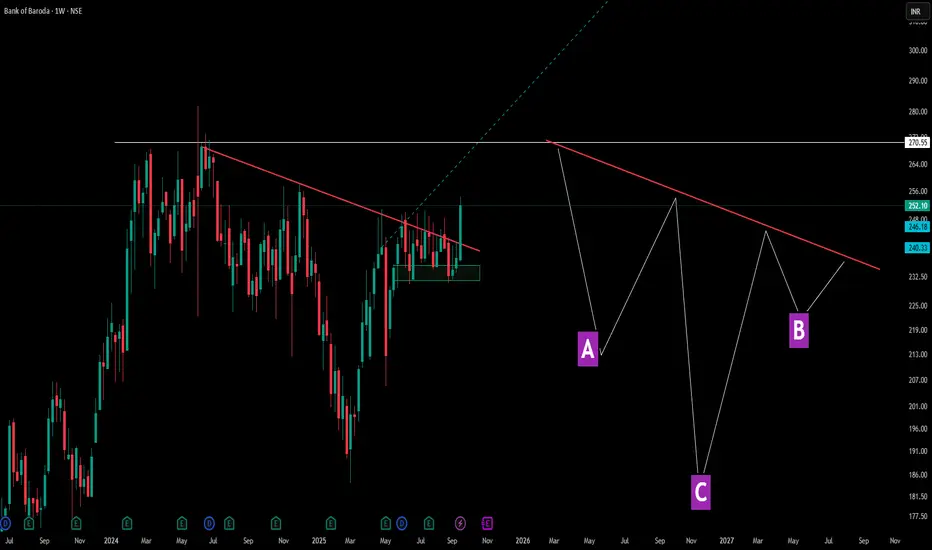
Decoding Angled Necklines in Inverted Head & ShouldersThis chart showcases a perfect example of how inverted head and shoulders patterns don't always follow textbook formations. Points A and B represent the shoulders, while C forms the deeper head—but notice the crucial difference: the neckline (red line) is tilted rather than horizontal.
Pattern Education Points:
- Traditional vs Reality: While many educational materials show horizontal necklines, real market patterns frequently display angled necklines, which are equally valid
-Shoulder Structure: The left shoulder (A) and right shoulder (B) don't need perfect symmetry—market patterns reflect actual supply and demand dynamics, not geometric precision
Market Structures:
- Before A, There was serious consolidation and then a Lower Low formation in the markets -> showcasing a dry volume dip and significant correction ( marking C ) as well as a result .
- Accompanied by a decent V shape recovery, tilted neckline is been touched again - showcasing market multi structure patterns are really important and there identification can lead to a decent trade idea
- later the next shoulder ( B ) gives solid consolidation but this time the dip is not solid unlike the normal Inverted HnS which makes the 2nd dip equal to the 1st shoulder dip here its a solid consolidation with small dip and a marubozu green candle after that .
Disclaimer: This content is for educational purposes and not financial advice. Always do your own research before making trading decisions.
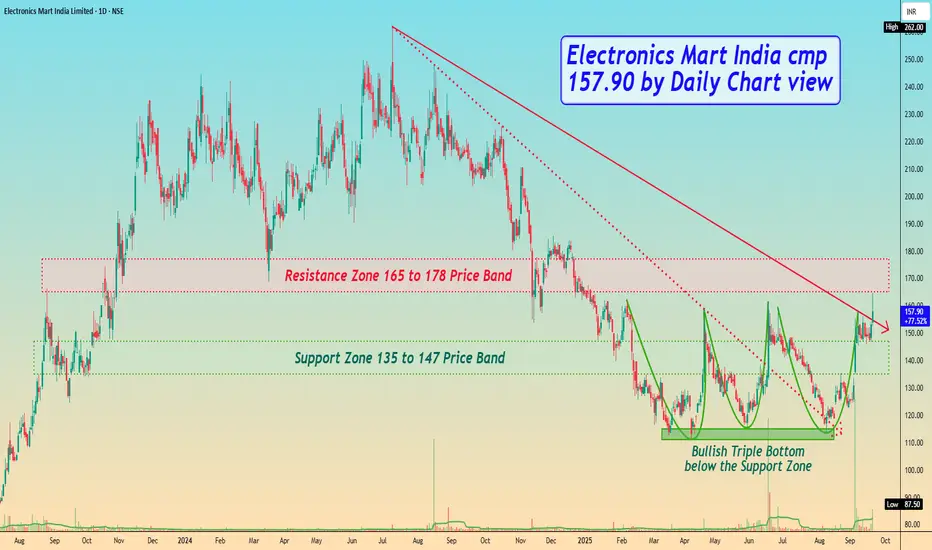
Electronics Mart India cmp 157.90 by Daily Chart viewElectronics Mart India cmp 157.90 by Daily Chart view
- Support Zone 135 to 147 Price Band
- Resistance Zone 165 to 178 Price Band
- Falling Resistance Trendlines Breakout seem sustained
- Volumes surging heavily above avg traded qty over past few days
- Bullish Triple Bottom with considerate Cup & Handle around Support Zone
- Support Zone price band is under testing retesting phase over the past 2 weeks
GODREJIND Price ActionGodrej Industries Ltd closed at ₹1,175.60 today, experiencing a 3.4% decline with heavy trading volume and a daily price range between ₹1,160 and ₹1,222.80. The stock has traded weakly in recent sessions, following a period of sideways consolidation, and now sits just above key support near ₹1,150.
From a technical perspective, the stock averages—50-day and 200-day—are at ₹1,184 and ₹1,122 respectively, suggesting the price remains above long-term support but has slipped below short-term momentum lines. Indicators like RSI and MACD are showing reduction in buying momentum, and the recent moving average crossover points to a near-term bearish bias. The current price is also well below the year’s high of ₹1,390 but still far from the yearly low of ₹766.
Fundamentally, Godrej Industries remains a diversified holding company with strong assets in consumer products, real estate, and agriculture. The most recent quarter shows healthy revenue growth and improving operating margins, but ongoing concerns about muted profit growth and pressure on consumer demand are apparent. Promoter holding has increased slightly, which is a positive, but the stock continues to trade at a relatively high price-earnings multiple, indicating limited value upside in the short term.
Looking forward, key areas to watch include the ₹1,150 support zone for signs of demand, and ₹1,200–₹1,230 as resistance for any bounce attempts. Any decisive move below support may accelerate downside, while a recovery above resistance could restore bullish sentiment. Despite recent weakness, long-term prospects remain tied to the group’s ability to generate stable earnings and diversify growth across its business lines.

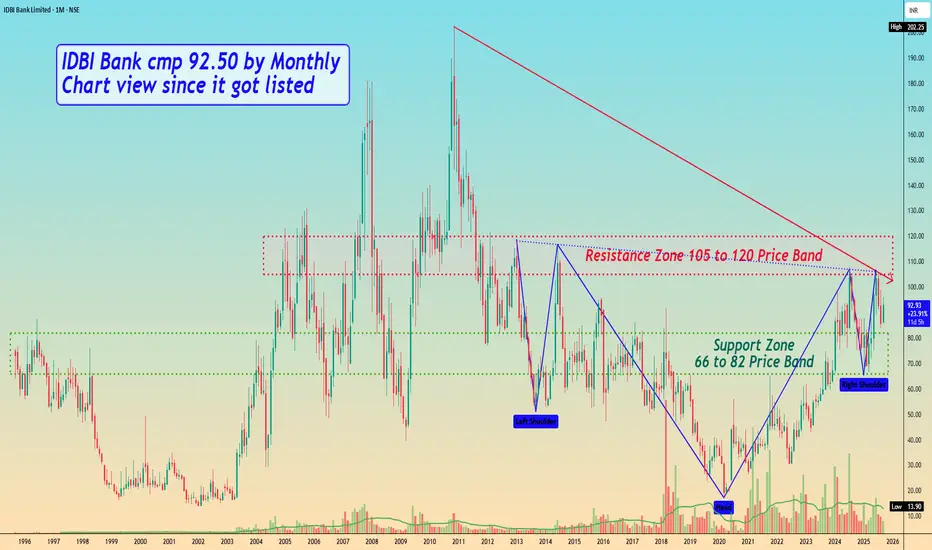
IDBI Bank cmp 92.50 by Monthly Chart view since it got listedIDBI Bank cmp 92.50 by Monthly Chart view since it got listed
- Support Zone 66 to 82 Price Band
- Resistance Zone 105 to 120 Price Band
- Bullish Cup and Handle done indicative of good upside probability
- Resistance Zone acting strongly hence Price move getting rejected since October 2011
- Breakout above Resistance Zone needs heavy traded Volumes increase and needs to sustain above it for few days to foresee and anticipate fresh upside 🤞🏽🤞🏽🤞🏽🤞🏽
LAURUSLABS Price ActionLaurus Labs Ltd showed strong bullish momentum today, closing near ₹920 and touching an intraday high of ₹921.50. The stock rallied nearly 3% over the previous session, with support coming in at ₹885–890 and sustained buying interest driving it to fresh 52-week and all-time highs. Volumes were robust, and Laurus Labs remains above both its short- and long-term moving averages, reflecting continued upward trend strength.
Technical indicators are positive, with the price firmly above the 50- and 200-day averages and momentum readings remaining supportive. Resistance is expected around ₹922–925; a breakout could pave the way for higher targets, while immediate support sits at ₹885 and then ₹860. The stock’s price-to-earnings ratio sits on the higher end, signaling premium valuation thanks to growth expectations and strong fundamentals.
In summary, Laurus Labs is in a strong uptrend with bullish technicals and fresh highs, offering positive sentiment unless it drops below key support levels.

HERITGFOOD Price ActionHeritage Foods Ltd (HERITGFOOD) traded strongly on September 18, 2025, closing around ₹509 after hitting an intraday low of ₹496 and a high near ₹519. The stock jumped nearly 4% today, continuing its recent upward trend with robust volumes exceeding two million shares. The 52-week high stands at ₹658, indicating further upside potential if current momentum persists.
Technically, the stock trades above medium-term moving averages, supporting a bullish bias. Immediate support is seen at ₹496, while resistance levels are near ₹520 and ₹540. The price-to-earnings ratio is approximately 28, with solid return metrics and healthy profit growth. Heritage Foods remains well positioned for short-term gains unless price falls below the ₹496 support.

Btc 1H long ideaHere's a detailed description of the information presented:
• Financial Instrument: The chart is for Bitcoin (BTC) priced against USDT (Tether), a stablecoin. The "Perp Perpetual Mix Contract" suggests this is a futures or derivatives contract that doesn't expire.
• Timeframe: The chart is set to 1-hour (1H), meaning each candlestick represents one hour of price movement.
• Trading Position: A long position is currently open, indicated by the green and red boxes. A long position is a bet that the price will increase.
• Entry Point: The white horizontal line marks the entry price at 116,980.2.
• Take-Profit Target: The top of the green box, labeled "Target," is at 119,810.0. The potential profit for reaching this target is 3,517.2 USDT, which is a 3.02% gain.
• Stop-Loss: The bottom of the red box, labeled "Stop," is at 114,658.0. This is the price level where the trade will automatically close to limit losses. The potential loss is 1,646.4 USDT, or a 1.42% drop.
• Risk/Reward Ratio: The text "Risk/Reward Ratio: 2.14" indicates that the potential profit is 2.14 times greater than the potential loss. This is a key metric used by traders to evaluate if a trade is worth the risk.
• Price and Indicators:
• The current price is shown as 117,210.1.
• The chart includes various indicators and tools, such as moving averages (the blue and yellow lines moving with the price) and a volume histogram at the bottom (red and green bars).
• There are also horizontal white lines that likely represent significant support and resistance levels.
In summary, the image provides a clear visualization of a planned crypto trade, outlining the specific entry, stop-loss, and take-profit levels, as well as the associated risk/reward profile.

SANSERA Price ActionSansera Engineering Ltd (SANSERA) closed today at approximately ₹1,482, showing positive momentum with a steady intraday range between ₹1,445 and ₹1,523. The stock remains near its recent highs, supported by robust volume and favorable technical conditions.
### Technical Analysis
- The stock trades above its key short-term and medium-term moving averages, indicating a bullish trend.
- Momentum indicators like RSI are comfortably above 50, hinting at strengthening buying pressure without being overbought.
- Support is well established around ₹1,430–1,450 levels, which acted as a strong base during intraday dips.
- Near-term resistance stands around ₹1,520–1,525; a breakout above this would likely propel the stock toward the ₹1,600 level.
### Price Action Summary
Sansera Engineering has shown resilience after recent consolidation, with buyers stepping in at major support levels, confirming positive accumulation. The market outlook remains optimistic given steady fundamentals and technical strength, with room for further appreciation in the short to medium term.
Traders should monitor for sustained volumes and a decisive close above resistance to confirm the bullish breakout, while keeping an eye on support zones for any corrective pullbacks.
