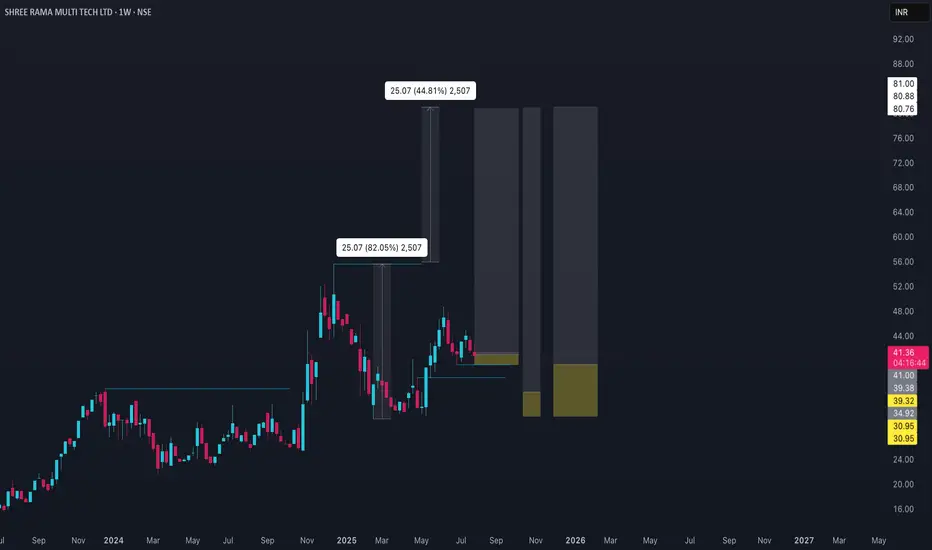
SHREERAMA Price ActionShree Rama Multi-Tech Ltd is currently trading around ₹41 as of late July to early August 2025. In the recent period, the stock has moved within a narrow range of ₹40.50–₹42.95, reflecting relatively low volatility. The short-term price trend appears positive, with upside targets ranging from ₹41.60 to ₹47.58 for the near-to-mid term. On the downside, support levels are seen near ₹40.06 and, more distantly, at ₹31.79 and below.
Fundamentally, the company has posted strong year-on-year sales growth, with March 2025 quarterly net sales up nearly 27% compared to the previous year. This operational momentum may be contributing to the positive sentiment around the stock, even as it consolidates near current levels. However, price targets over the next several months suggest modest gains rather than rapid appreciation, with resistance likely to emerge in the ₹44–₹48 range.
In summary, Shree Rama Multi-Tech Ltd offers a stable price trajectory with moderate upside potential. The outlook is supported by improved sales but tempered by significant resistance after the recent rally. The stock seems suitable for investors seeking gradual gains within the packaging sector, though the pace of growth may remain measured near term.
Liquidty is not so great yet, but stock is strong and trend is clearly up, now only thing is to find a right entry to catch our part of profit.
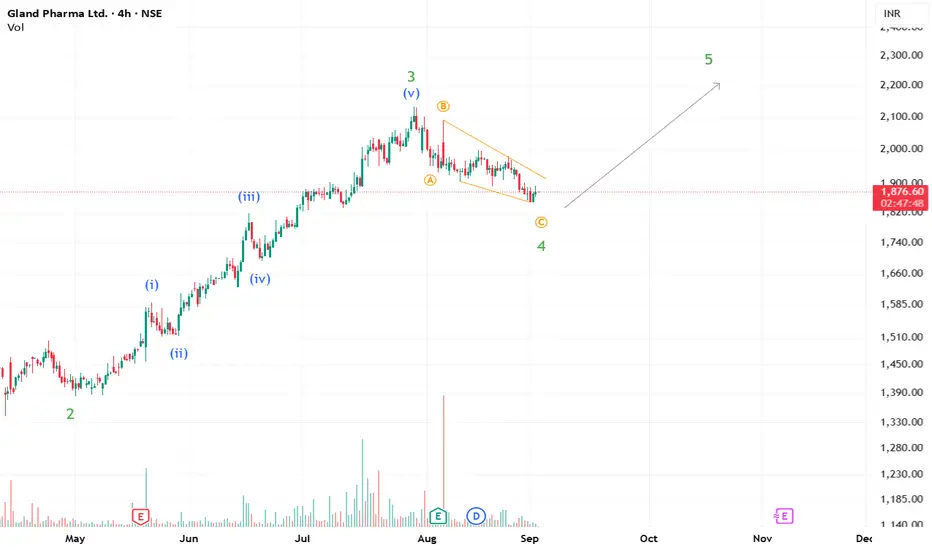
Bullishpattern
Bullish view for Gland Pharma?!!As probable Wave 4 approaches its end, we may see an upside to complete Wave 5 in Gland Pharma.
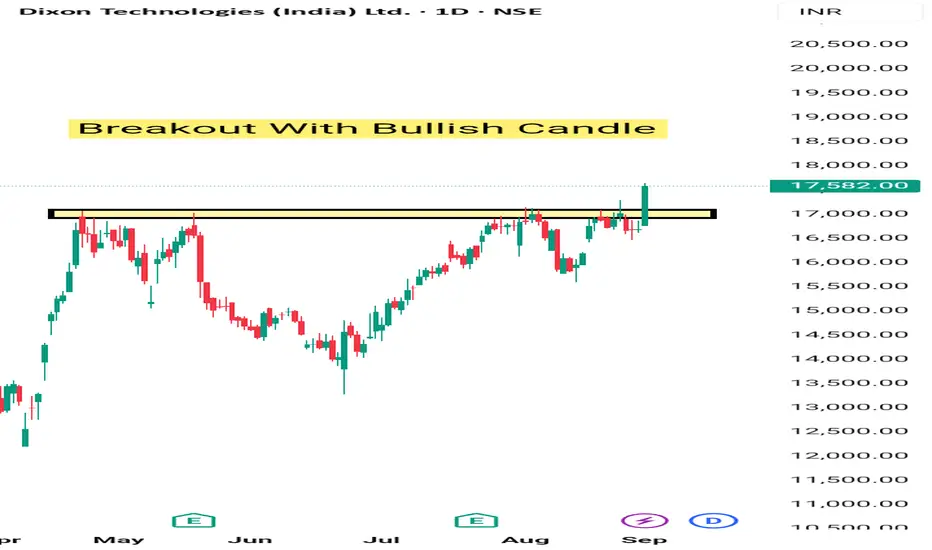
Dixon Breakout Tgt next 5-6%Dixon given breakout with high volume & made a clear breakout with bullish candle. It may give another 5 -6% Movement for swing trading . Stock is good for long term also . It's given breakout of rounding Bottom.
PRAENG Price Action
### Market & Price Metrics
- **Current share price:** ₹17.81 as of August 8, 2025.
- **Market capitalization:** ₹125crore.
- **52-week range:** ₹12.85 (low) to ₹22.80 (high).
- **Recent movement:** Price has declined by about 2.7% in early August, reflecting ongoing downward trend.
### Returns & Volatility
- **1-month change:** Negative, with price down from approximately ₹19.9 in early July.
- **1-year trend:** Down over 49% from August 2024.
- **Price swings:** High volatility, often 3-5% daily moves.
### Valuation
- **PE Ratio:** Not meaningful due to consistent losses (latest EPS: -₹4.29 for FY 2025).
- **Book Value Per Share:** Estimated near ₹38 but reflecting asset sales.
- **Dividend yield:** Nil – no payouts in recent years.
### Company Fundamentals
- **Revenue (FY 2025):** ₹57.5crore, little change over previous year; long-term growth remains muted.
- **Net Profit Margin:** Deeply negative, with net loss of about ₹30crore for FY 2025.
- **EPS:** Negative, improved (less loss) from previous FY (-₹4.29 vs -₹5.57).
- **Net Worth:** ₹486crore.
- **Total Assets:** ₹839crore.
- **Debt/Leverage:** Total outside liabilities ₹352.8crore; interest coverage very weak.
### Cash Flow & Profitability
- **Operating cash flow:** Positive at ₹19.2crore for FY 2025.
- **Free cash flow:** Volatile — positive some years, negative in others.
- **Return on Equity (ROE):** Negative.
- **Return on Assets:** Negative, driven by losses.
### Business & Qualitative Notes
- **Growth:** Minimal and below industry norm; 5-year annual revenue growth less than 3%.
- **Market share:** Continues to decline.
- **Profitability:** Negative margins and earnings; unable to achieve sustainable profitability.
- **Dividend:** No payout record; losses preclude distributions.
- **Shareholding:** Promoters hold about 36.8%, retail and others 63.2%.
### Technical & Sentiment
- **Trend:** Bearish in recent months; repeated breakdowns at support levels.
- **Analyst view:** Sentiment remains negative — company lacks near-term growth catalysts; high risk.
***
**Summary:** PRAENG is a deeply distressed small-cap real estate company, trading near multi-year lows after sustained losses, high volatility, and deteriorating fundamentals. No dividends, weak sales trends, and negative returns underscore significant investment risk at current prices.

ABDL Price ActionAs of August 29, 2025, Allied Blenders & Distillers Limited (ABDL) is trading around ₹501, showing short-term volatility with some decline from its recent high near ₹540. The stock has delivered impressive returns over the last twelve months, nearly doubling from its 52-week low of ₹279, and rising about 56% over six months and 28% in the last three months. The price-to-earnings ratio stands elevated at 59.4, and the price-to-book ratio is above 9, indicating that growth expectations are currently priced in.
Financially, ABDL maintains a market capitalization of over ₹14,200 crore, reflecting strong investor interest. The company’s quarterly earnings have been stable, but a relatively modest earnings per share means any further rally may require stronger profit growth. Technical indicators suggest the stock is trading in a neutral to slightly oversold territory, with momentum fluctuating but long-term moving averages still supporting the uptrend. Dividend yield is low, showing focus on growth over payouts. The outlook remains cautiously optimistic, with growth-oriented investors watching profitability closely for the next leg up.

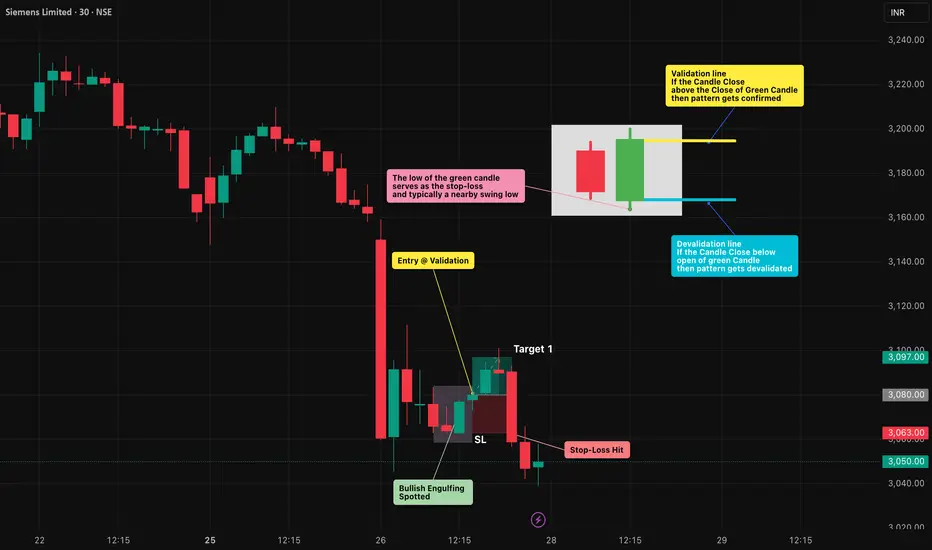
Bullish Engulfing Pattern: Spotting Reversals with Discipline🔎 Intro / Overview
Managing risk is just as important as finding an entry. The Bullish Engulfing is one of the most effective candlestick patterns to identify potential reversals. When traded with discipline, it signals a shift from seller pressure to buyer control, helping traders time their entries with confidence.
📔 Concept
A Bullish Engulfing occurs when:
The first candle is a small red candle that continues the downtrend.
The next candle is a large green candle whose body completely engulfs the red candle’s body .
👉 This shows a clear psychological shift — sellers push lower (red candle), but buyers step in strongly (green candle) and reclaim control.
📌 How to Use
✅ Validation → The candle must close above the close of the green candle.
❌ Invalidation → If price closes below the open of the green candle before confirmation.
Trading Plan:
Entry → After confirmation of the green candle’s close.
Stop-Loss (SL) → Below the low of the green candle.
Take-Profit (TP) :
Conservative → 1R (Entry → SL distance)
Moderate → 2R
Aggressive → Book partial at 1R and trail the rest using tools like ATR, Fibonacci levels, or structure-based stops to ride any extended upside move.
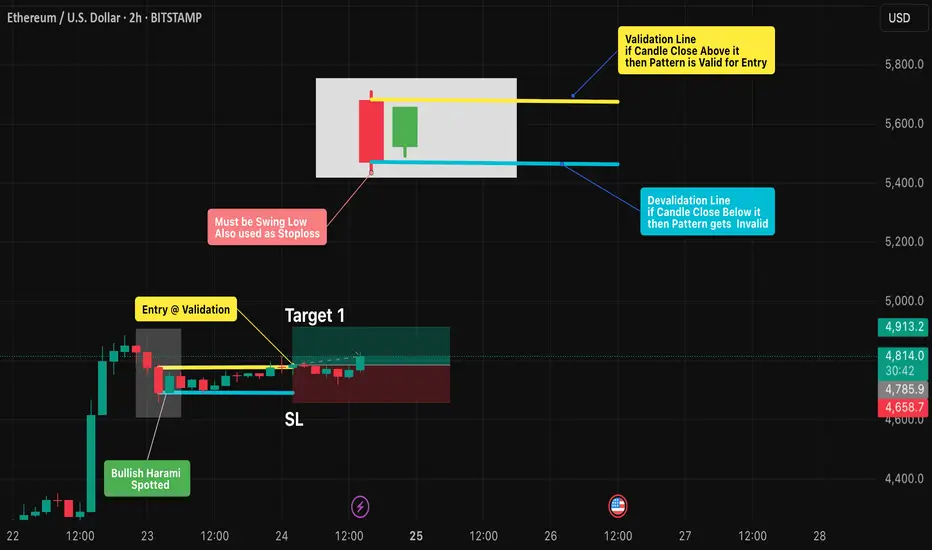
📊 Chart Explanation
On the chart, the first small red candle shows sellers continuing the downtrend. The next large green candle completely engulfs the red candle’s body and closes higher — signaling that buyers have taken control.
The pattern was validated at the close of the green candle , where the long entry was taken. The low of the green candle is used as the stop-loss level, while the targets are mirrored in reverse using the same distance.
In this example, Stop-loss was quickly achieved . From there, traders can apply trailing stop methods to lock in profits and manage further upside targets.
👀 Observation
Most effective at support zones or after a prolonged downtrend .
A high-volume green candle adds conviction to the signal.
In sideways/choppy markets , it can produce false signals — always filter with structure and indicators.
❗ Why It Matters?
The red candle shows seller pressure .
The green candle shows buyer strength .
This clear shift in control creates a rule-based setup with defined entry, SL, and TP.
🎯 Conclusion
The Bullish Engulfing is a strong sign of reversal — but only when combined with structure, confirmation, and disciplined risk management.
🔥 Patterns don’t predict. Rules protect.
⚠️ Disclaimer
For educational purposes only · Not SEBI registered · Not a buy/sell recommendation · No investment advice — purely a learning resource
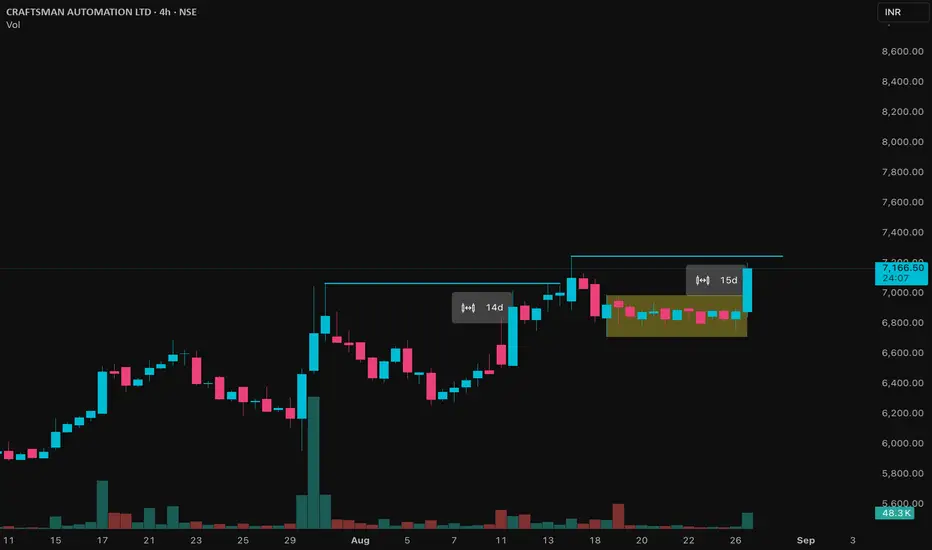
Craftsman Price ActionCraftsman Automation’s share price in August 2025 has been trading near ₹6,839, showing resilient performance and hitting close to the upper end of its 52-week range. The stock has surged over 24% in the past three months, demonstrating strong momentum thanks to improved sentiment and periodic bullish technical signals, such as recent moving average crossovers.
Financially, the company posted robust annual sales growth above 20% and consolidated net sales exceeding ₹1,700 crore, but short-term earnings growth has been mixed with some volatility in profit trajectory. Craftsman’s valuation remains notably high, with its price-to-earnings ratio elevated above 77, reflecting investor expectations for strong future growth. This optimism is underpinned by industry forecasts projecting EPS growth over the next few years at a rate higher than the sector average.
Promoter holding at nearly 49% reflects management commitment, and steady interest and employee expenses indicate stable operations. Technically, bullish signals on moving averages have led to short-term price gains, while bearish signals on other indicators may cause small dips from time to time. Overall, Craftman Automation is seen as a premium growth play with strong operational results and solid long-term prospects, though investors should be mindful of valuation risks and short-term price swings.
Lloyds Metals Hints at Final Wave V RallyThe wave principle suggests Lloyds Metals has likely completed Wave IV, with an upward Wave V move potentially unfolding toward new highs.

Zydus Lifesciences – Cup and Handle Breakout SetupThe stock has formed a classic Cup and Handle pattern, with a breakout zone around ₹1,010–1,020. A successful breakout above this level indicates bullish continuation, with a projected upside target of around ₹1,235.90 (21.5% potential).
The daily RSI (67.49) and weekly RSI (61.78) are both rising, signaling strong bullish momentum with room for further upside. The MACD also remains in positive territory, reinforcing the bullish trend.
A sustained breakout above ₹1,010–1,020 can be used as an entry point, with an upside target of ₹1,235, while maintaining a stop loss at ₹919 to manage risk below the handle low.
Disclaimer: The information provided in this analysis is for educational and informational purposes only and should not be considered as financial or investment advice.

Hubtown Price AcionHubtown Limited's stock price has been on a steady upward trajectory, currently trading around ₹345 in late August 2025. The stock has shown strong momentum over recent months, rising steadily from lows near ₹162 over the past year. This rise is supported by positive market sentiment and the company’s ongoing progress in its real estate development projects, along with strategic mergers to consolidate its portfolio.
Financially, Hubtown has experienced improvement in revenue and profitability, reflecting efficient project execution and a favorable market environment. Its price-to-earnings ratio suggests moderate valuation, balancing growth expectations against earnings stability. Market capitalization places it comfortably within the mid-cap segment, attracting institutional interest.
Technically, the stock is trading well above key moving averages, showing a bullish trend with increased trading volumes confirming strength. It has broken through multiple resistance levels but may encounter short-term consolidation as traders book profits. Overall, Hubtown presents a solid growth story backed by fundamentals and positive technical indications, making it an attractive choice for investors looking for exposure in the real estate sector.

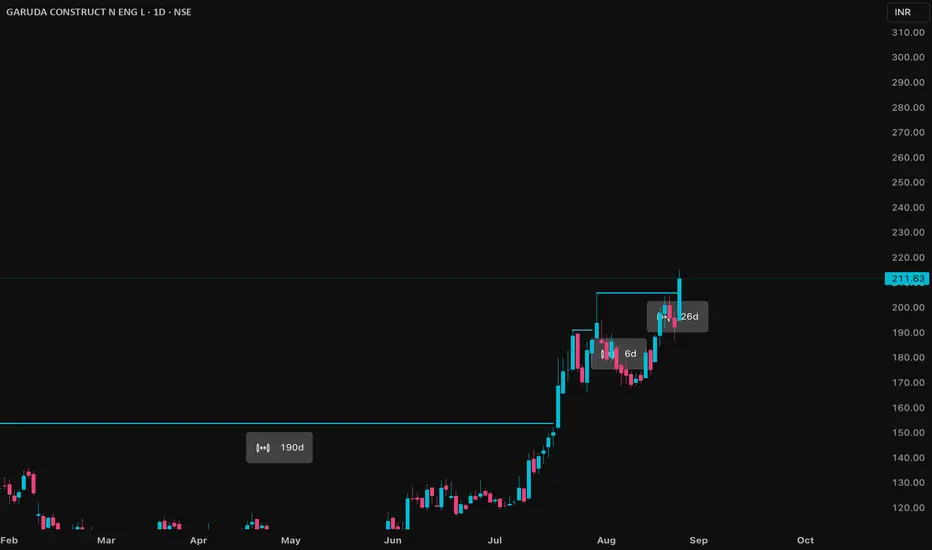
Garuda Price ActionGaruda Construction and Engineering Limited has shown significant price appreciation recently, trading around ₹211 as of late August 2025, marking a strong gain of over 10% in a single session. The stock has nearly doubled over the past six months, moving up from a 52-week low near ₹76 to a high close to ₹215, reflecting robust investor interest and positive sentiment.
The company’s price-to-earnings ratio is approximately 28, indicating a moderate valuation that reflects the market’s expectations of continued growth. Price-to-book ratio remains relatively low, suggesting that the stock may still hold value compared to its book assets. The market capitalization stands near ₹1,970 crore, placing it strongly in the mid-cap range.
Financially, the company reported solid quarterly profitability with profit around ₹28 crore on revenues of about ₹127 crore, highlighting operational efficiency and margin control. The dividend yield is modest, with recent dividend payouts indicating management’s focus on balanced capital allocation between growth and shareholder rewards.
Technically, the stock has broken past key resistance levels and is trading well above its 50-day and 200-day moving averages, maintaining a clear bullish momentum. Trading volumes have increased, validating the price moves, but some volatility may persist due to profit-taking at near-term highs. Overall, the outlook for Garuda Construction appears positive, supported by strong fundamentals and favorable technical setups, making it attractive for medium- to long-term investors focused on growth in the engineering sector.
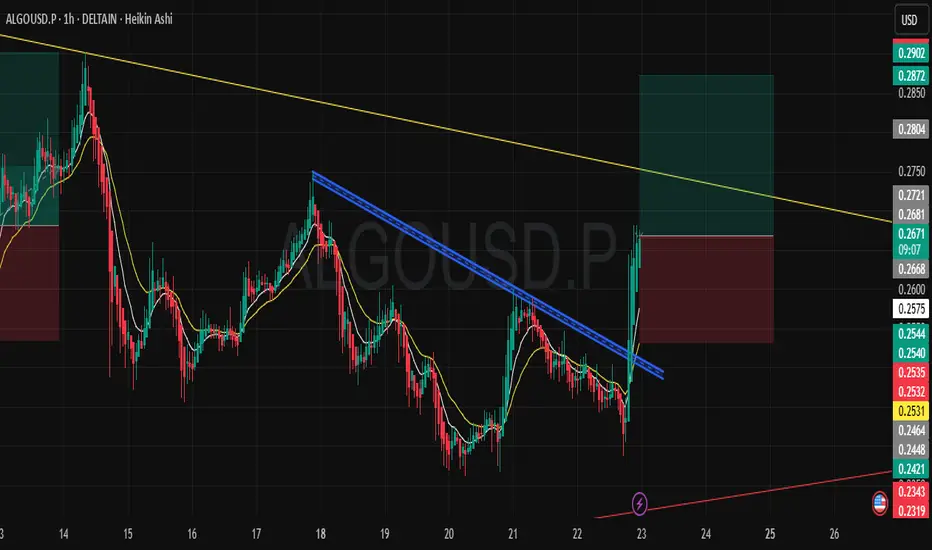
ALGO/USDT – Bullish Breakout Setup (1H)ALGO has shown a clean breakout from the descending trendline (blue) after several days of lower highs. The breakout was backed by strong bullish candles and a close above the short-term EMAs, confirming momentum shift to the upside.
🔹 Trade Plan:
Entry: Around 0.2575 (post-breakout confirmation)
Stop Loss: 0.2540 (below structure & EMAs)
Targets:
First Target: 0.2721
Second Target: 0.2804
Extended Target: 0.2902
🔹 Technical Outlook:
The descending trendline was acting as resistance since August 17 and has now been broken.
EMAs are turning upward and aligning bullishly.
Strong volume push on breakout candle indicates buyers stepping in.
Next major resistance sits near the higher descending yellow trendline – a break above that could open the way toward higher levels.
📊 Bias: Bullish as long as price holds above 0.2540. Watching for continuation toward upper resistance.
OlectraThis is bullish parallel channel formation breakout on the upper edge. Though weekly/monthly closing above the supply area 1530-1460 is very important here. However the recent move above 1350-1270 gave good strength to the bulls.
Consider it with time frame of 1.5 yr-2 yrs and stop loss 1280
2000 looks promising in next 6 months

Bullish Harami Pattern: Spotting Reversals with DisciplineIntro / Overview
The Bullish Harami is a candlestick reversal pattern that often forms at the end of a downtrend.
It signals a possible shift where sellers weaken and buyers begin to step in.
The first candle’s low must be a swing low , and this level can also be used as a stop-loss reference.
To trade it effectively, spotting the formation is not enough — strict validation and invalidation rules are key to avoid false signals.
✨ Concept
A Bullish Harami is a two-candle pattern:
- First candle (Red🔴): A strong bearish candle showing seller dominance (swing low).
- Second candle (Green🟢): A smaller bullish candle whose body is fully inside the prior red candle’s body (wicks ideally inside).
This forms the “harami” structure, where the green candle looks like it is “inside the red candle,” suggesting a pause in bearish pressure and potential reversal.
📖 How to Use
1️⃣ Identify the pattern: Look for a large red candle followed by a smaller green candle contained within it.
2️⃣ Validation Point: The setup is validated if price closes above the open of the red candle within the next few candles.
3️⃣ Invalidation Point: The setup is invalidated if price closes below the close of the red candle before validation occurs.
4️⃣ Stop-Loss & Targets:
- Stop-loss (SL): Place at or just below the swing low (first red candle low).
- Target (TP): 1x, 2x, or more times the distance between entry and stop-loss.
5️⃣ Enhance Reliability: Combine with support levels, trendlines, moving averages, or other candlestick signals to filter out weak setups.
📊 Chart Explanation – Step by Step
✔ The Bullish Harami pattern was spotted after a clear downtrend.
✔ The following candle closed above the red candle’s open → Validation confirmed ✅ .
✔ A long entry was taken on the same candle.
✔ The Bullish Harami pattern has also been drawn and highlighted on the chart.
🔍 Observation
- If Target 1 is achieved → book 2 lots , and trail the remaining position with a stop-loss.
- Harami is only a potential reversal → confirmation is necessary.
- Breakout above the red candle’s open = buyers in control 🟢.
- Breakdown below the red candle’s close = setup failure ❌.
- Patience is key — wait for confirmation before entering.
📌 Why It Matters?
The Bullish Harami helps traders by:
- Reducing false reversal trades with strict rules.
- Providing clear entry/exit levels with discipline.
- Enforcing risk management via pre-defined SL & TP.
✅ Conclusion
The Bullish Harami becomes powerful when traded with discipline.
By marking the open and close of the red candle, traders can clearly separate a valid long trade from a failed setup.
With a stop-loss at the swing low and take-profits at 1x, 2x, or more, while trailing further lots, the Harami offers a structured, rule-based strategy.
⚠️ Always remember: the pattern shows possibility → price confirmation makes it probability .
⚠️ Disclaimer
For educational purposes only · Not SEBI registered · Not a buy/sell recommendation · No investment advice — purely a learning resource
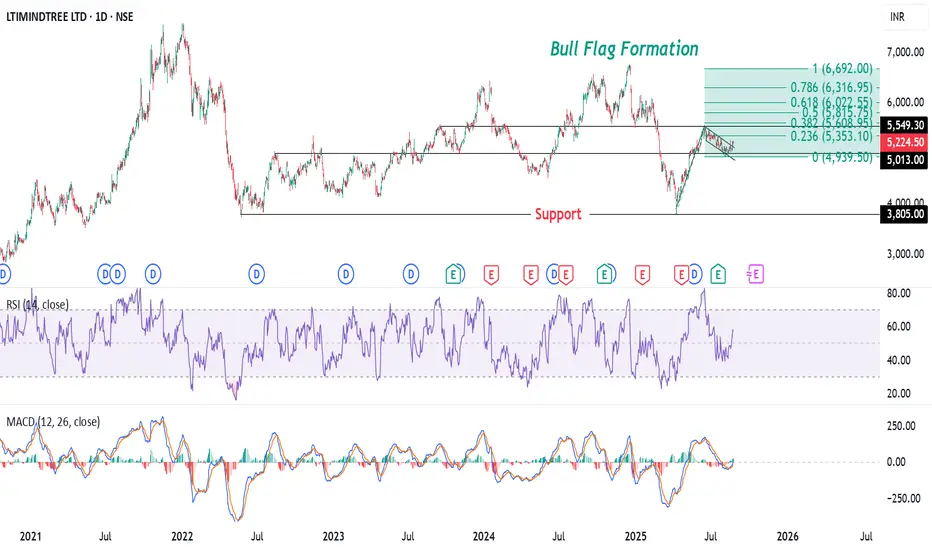
LTIMINDTREE Forms Bull Flag: Signs of a Potential Upside Move?The chart of LTIMINDTREE LTD shows a Bull Flag formation, a bullish continuation pattern that typically appears after a strong upward move. The flagpole is represented by the sharp price rally, from 3,800, followed by a downward-sloping consolidation channel forming the flag.
This pattern suggests a potential breakout to the upside, supported by the Fibonacci extension levels projecting targets up to the .618 fib ext. level at ₹6,022. The RSI is near 56.89, indicating moderate strength, while the MACD shows a possible bullish crossover, further reinforcing the bullish outlook. The key support level is around ₹5,000, and a breakout above the flag could signal a resumption of the uptrend.
Disclaimer: The information provided in this analysis is for educational and informational purposes only and should not be considered as financial or investment advice.
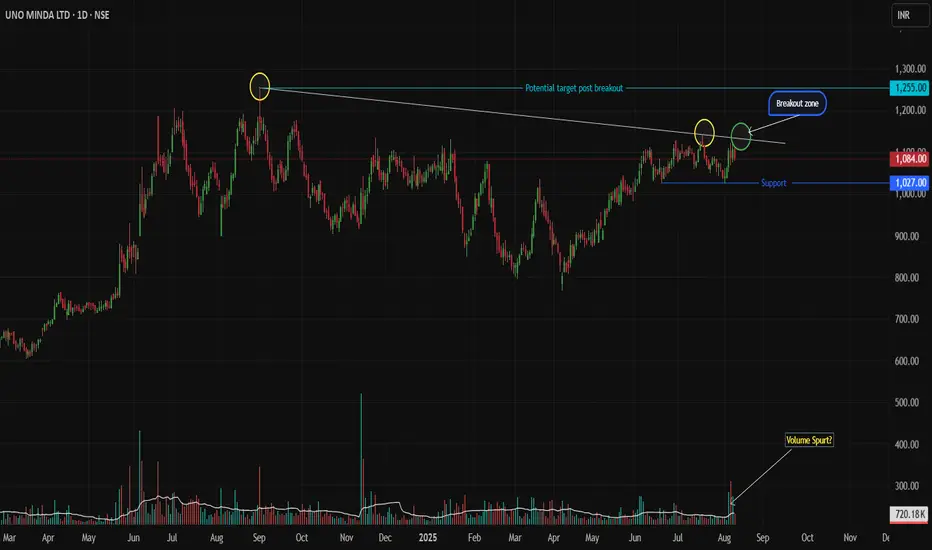
Uno Minda: Triple Trendline Test - Breakout or Pullback Setup Uno Minda Price Action Setup
(Daily Timeframe | Pure Price Action + Volume)
Key Structure
Resistance Trendline: Tested twice (02-Sep-2024 & 17-Jul-2025). Price now approaches it for the 3rd attempt.
Support Zone: Strong base at 1027 (recent swing low).
Long-Term Trend: Bullish (higher highs/lows).
Trade Scenarios
SCENARIO 1 : Trendline Breakout
Trigger:
Daily breakout candle closes above the resistance trendline.
Candle must be strong bullish (full-bodied green) with volume > 20-day average.
Entry: On confirmation of breakout (next candle open/close above breakout candle’s high).
Stop Loss: Low of the breakout candle.
Targets:
First: 1255 (take partial profits).
Trail balance with trailing SL (e.g., below recent swing lows).
SCENARIO 2 : Pullback to Support
Trigger:
Price retests 1027 support, followed by a strong bullish reversal candle (e.g., Bullish Engulfing/Hammer) with rising volume.
Entry: After reversal candle closes (confirmation).
Stop Loss: Below the low of the reversal candle.
Targets:
First: 1130 (take partial profits).
Trail balance aggressively.
Risk Management
Position Size: Risk ≤ 1% capital per trade.
Avoid chasing: Enter only on confirmed triggers.
Invalidation: Exit if price closes below SL levels.
Disclaimer
This idea is educational only. Not financial advice. Trading carries high risk. Past performance doesn’t guarantee future results. Always test strategies in a demo account. Consult a financial advisor before trading.
Boost 👍 if helpful! Comment below for other stocks you want analyzed.
Keep it price-driven. Trade safe! 💡
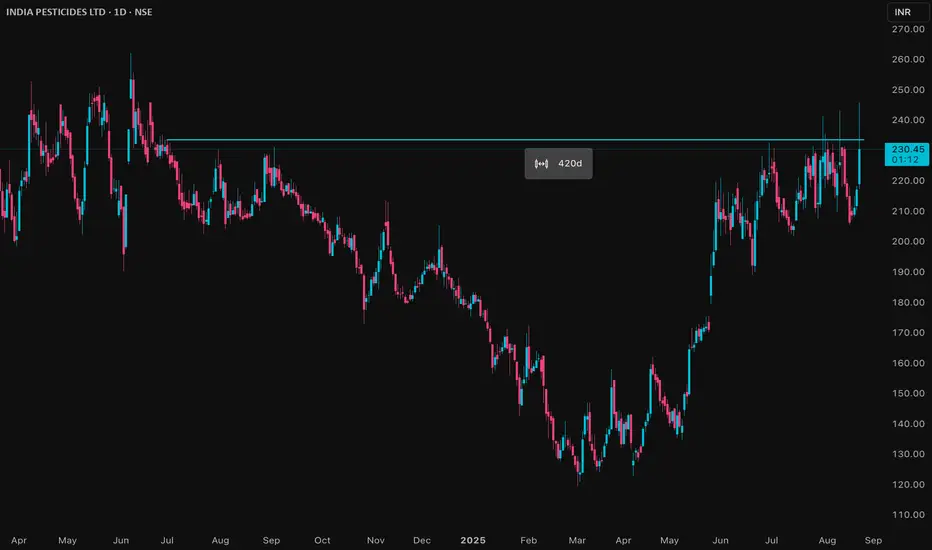
IPL Price ActionIndia Pesticides Ltd (IPL) is trading at ₹217.3 as of August 21, 2025. The stock has shown impressive strength recently, with a gain of 9% today and an intraday high of ₹238.5. It is just 3% below its 52-week high of ₹244.25, reflecting its robust upward momentum.
Over the last six months, IPL has surged by nearly 65% and is up 4% for the past year, outperforming major indices. The company's valuation stands at a PE ratio of 25 and a price-to-book (PB) ratio of 0.36, which is moderate for the agro-chem sector.
Operationally, IPL remains almost debt free and has recently expanded its manufacturing capacity, which could support further growth. The company’s return on capital employed (ROCE) is about 13%, with a return on equity (ROE) of around 9.5%. Key strengths include solid financials, improved sales, and sector-wide optimism.
Trading volumes are strong, and IPL is above all major moving averages, signaling bullish sentiment. Support is seen near ₹206–₹208, while resistance is close to ₹244 (recent high).
In summary, IPL continues to display strength, buoyed by expansion efforts and solid financial metrics. Momentum and technical indicators favor further upside if broader market conditions remain supportive.
NAVA Price Analysis
## Current Price and Trend
NAVA Limited is trading near ₹610, showing resilience after a period of strong rally. The price action exhibits momentum and relative strength compared to industry peers and the overall market. Despite some weekly volatility, the trend over the past year has been decisively upward, with gains of around 50%.
## Volatility and Performance
- **Volatility:** NAVA is moderately volatile, with typical weekly movements near 6%. This is in line with industrial sector averages, making it a relatively stable performer among mid-cap stocks.
- **Performance:** Over the last year, NAVA's price has surged over 57%, vastly outperforming the broader Indian industrial sector and market averages.
- **Long-Term Growth:** The stock has delivered impressive multi-year returns, far exceeding the sector, and momentum remains positive as of the most recent quarter.
## Valuation
- NAVA's price-to-earnings (P/E) and price-to-book (P/B) ratios are moderate. The P/E is around 16, and the P/B is close to 2, suggesting it is at a fair premium relative to book value but not excessively overvalued compared to growth stocks.
- The dividend yield stands at about 1.6%, offering modest income for investors.
## Financial Strength and Prospects
- The company recently reported record consolidated revenues, reflecting strong operational performance and expansion initiatives.
- Notably, profitability has eased in recent quarters due to operational inefficiencies and investment allocations, yet the financial position remains robust.
- Ongoing diversification into renewable energy and international projects, particularly in Africa, point toward sustained revenue streams and future growth opportunities.
## Risk Factors
- The stock is about 3.7 times as volatile as the Nifty index, which may be significant for risk-averse investors.
- Pending collections and recent dips in profitability highlight operational risks that warrant monitoring.
- While market optimism remains, questions persist regarding the efficiency of some recent investments and expansion plans.
## Summary
NAVA Limited demonstrates strong long-term growth, a solid market presence, and an optimistic outlook, tempered by recent profitability concerns and operational challenges. The stock's upward trajectory and moderate valuation could appeal to both growth-oriented and value-conscious investors, provided they are comfortable with its inherent volatility and sector-specific risks.

OPTIEMUS Price ActionOptiemus Infracom Limited (OPTIEMUS) is currently trading around ₹608 as of August 2025. The stock has shown a strong recent performance, gaining approximately 4% in the latest trading sessions, with daily price ranges between ₹585 and ₹625.
Over the past year, the stock price has fluctuated substantially, with a 52-week low near ₹378 and a high nearing ₹874. The current price sits closer to the mid-to-upper end of this range, indicating a recovery from lows but still beneath recent highs.
Financially, Optiemus Infracom has an earnings per share (EPS) of about ₹7.58. The price-to-earnings (PE) ratio stands elevated, above 80, which highlights strong market expectations for future growth or reflects a premium valuation often seen in technology or telecom-related firms.
The price trades above its 50-day average (~₹609) and 200-day average (~₹595), indicating a positive medium-term trend. Volume levels are moderate, consistent with stable investor interest.
While the stock has seen volatility, the trajectory suggests a gradual uptrend supported by its core business segments in electronics and telecommunications infrastructure. Key support is seen around ₹580, while resistance near ₹630 could test the strength of the ongoing rally.
In summary, Optiemus Infracom is positioned in an upward trading range with strong growth expectations, but valuation is relatively high, which should be monitored alongside company earnings and sector dynamics for future moves.

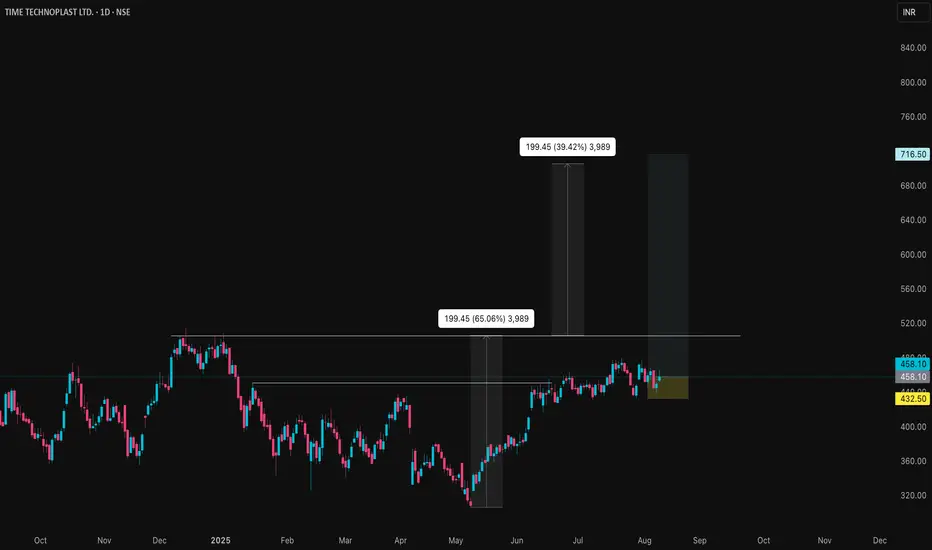
TIMETECHNO Price ction
### Market Metrics
- **Current share price:** ₹458.10.
- **Market capitalization:** ₹10,396crore.
- **52-week price range:** ₹306.60 (low) to ₹513.55 (high).
- **All-time low:** ₹17.55 (Feb 19, 2009).
- **All-time high:** ₹513.55 (Dec 13, 2024).
### Returns & Volatility
- **1-week change:** Down 1.98%.
- **1-month change:** Up 4.83%.
- **1-year return:** Up 43.18%.
- **Recent volatility:** Daily moves between ₹451.70 and ₹466.10 common.
- **Beta:** Not specified, but price swings indicate moderate volatility for sector.
### Valuation
- **Price/Earnings Ratio:** 26.79, above sector average.
- **Price/Book Ratio:** 3.88, also higher than sector average.
- **Dividend yield:** 0.55%.
### Company Fundamentals
- **Revenue (Trailing 12 months):** Approximately ₹54,570million.
- **Net profit margin:** 7.1%, improved over last year.
- **EPS (Trailing 12 months):** ₹17.10 (16.29% YoY growth).
- **Book value per share:** ₹118.21.
- **Return on Equity:** 13.3%.
### Growth & Profitability
- **Annual earnings growth:** 25% (past year), average 25.4% over 5 years.
- **Net profit for Q1 2025:** ₹10,952lakhs, up 18.6% YoY.
- **Free cash flow remains positive; margin improvement noted over 5 years.**
- **Return on assets:** 9.04%.
### Valuation Analysis
- **High PE and PB ratios indicate the stock is priced above sector averages.**
- **Recent buy recommendations from analysts; fair value status varies by source.**
### Qualitative Notes
- **Strong earnings and steady sales growth, but trading above intrinsic metrics.**
- **Growth momentum has slowed versus earlier years, though above industry norm.**
- **Stable dividend payout policy, but yield remains modest.**
- **Technical signals ranged from neutral to bullish in July and August 2025.**
**Summary:** The stock is trading at a high valuation given its growth history and sector performance. Investors should consider recent price corrections, volatility, and elevated PE/PB ratios before entering at current levels. The company maintains strong growth and profitability but is subject to valuation risk if sector trends reverse.
GOKULAGRO Price ActionGokul Agro Resources Ltd is currently trading around ₹333. The stock has recently gained close to 6% in a single session, reflecting strong bullish sentiment. The year-to-date performance is solid, with the price up substantially from its 52-week low of ₹193, and not far below the 52-week high of ₹377.
The company’s latest quarterly results showed significant sales growth, with March 2025 net sales up nearly 23% year-over-year and profit after tax also improving. The earnings per share (EPS) is about ₹17.9, and its price-to-earnings (PE) ratio stands near 18, which is reasonable for the sector. Book value per share is approximately ₹61.9, making the price-to-book ratio above 5, on the higher side for an agro-commodity company.
Gokul Agro’s upward momentum is backed by positive business results and optimism about the edible oils and agri-processing sector in India. The stock trades well above its 50-day and 200-day moving averages, confirming the uptrend. High trading volumes and active participation indicate continued interest from both institutional and retail investors.
Overall, Gokul Agro Resources is showing robust growth, supported by improved profitability and strong sector dynamics. The key levels to watch are support near ₹310 and resistance around ₹350–₹377. The outlook remains positive as momentum and earnings trends are both favorable.

GODFRYPHLP Price Action## Trend Overview
Godfrey Phillips India (GODFRYPHLP) is showing a volatile but overall bullish structure on the daily chart. The stock recently hit an all-time high near ₹9,645 and is currently trading around ₹8,687. After a strong rally over the past year, the price has entered a consolidation phase, with short-term corrections and profit booking visible.
## Price Action & Momentum
- The stock has gained over 100% in the last year, reflecting strong long-term momentum.
- In the short term, the price has pulled back from its peak and is trading below key resistance levels, indicating some selling pressure.
- Despite the pullback, the broader uptrend remains intact as the price is still above major moving averages.
## Technical Indicators
- **Moving Averages:** The daily price is above its 50-day and 200-day simple moving averages, supporting a positive long-term bias. Shorter-term averages (20-day and 50-day) are converging, suggesting consolidation.
- **Relative Strength Index (RSI):** The RSI is in the neutral zone, indicating neither overbought nor oversold conditions. This points to a potential pause or sideways movement before the next trend.
- **MACD:** The MACD indicator has shown a weak sell signal, but the overall momentum loss is mild, not confirming a strong reversal.
- **Bollinger Bands:** The price is in the lower half of the bands, suggesting a cooling-off period after a sharp rally. Volatility remains high.
## Support and Resistance
- **Immediate Support:** Around ₹8,500, where the stock has found buying interest in recent sessions.
- **Major Support:** Near ₹8,000, which coincides with the 50-day moving average and a previous breakout zone.
- **Immediate Resistance:** Near ₹8,900 to ₹9,000, which aligns with recent swing highs.
- **Major Resistance:** The all-time high at ₹9,645.
## Volume and Sentiment
- Recent sessions have seen higher volumes on down days, indicating profit booking.
- Long-term sentiment remains positive, but short-term traders are cautious due to the recent correction and volatility.
## Summary
GODFRYPHLP remains in a strong uptrend on the daily timeframe, but the current phase is marked by consolidation and profit-taking after hitting record highs. The price is holding above key supports, and as long as it stays above the 50-day moving average, the broader bullish structure is intact. Short-term movements may remain range-bound with a slight downward bias until a clear breakout above resistance or breakdown below support occurs. Risk management is advised due to elevated volatility.

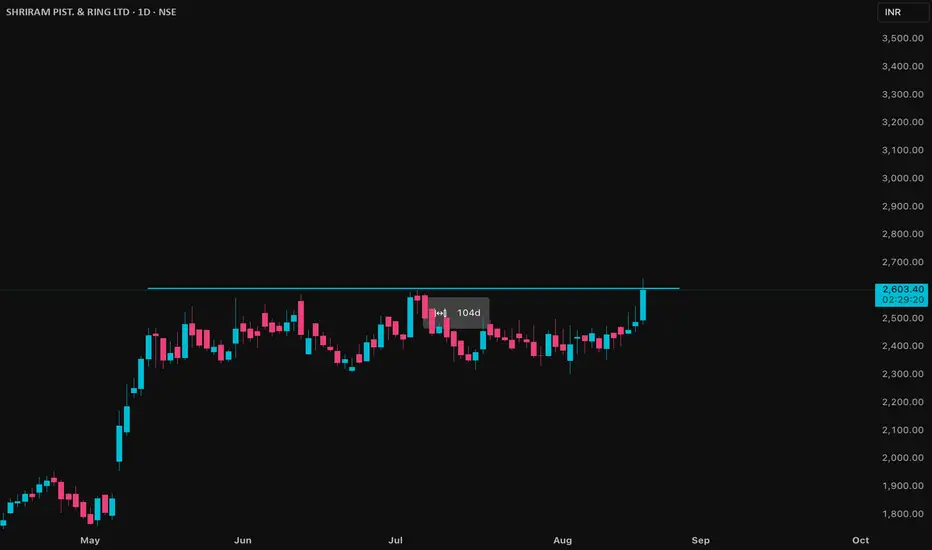
SHRIPISTON Price ActionHere are more detailed insights on Shriram Pistons & Rings Ltd (SHRIPISTON):
**Financial Performance:**
- For FY2025, revenue stood at ₹35.5 billion, up 15% year-on-year.
- Net income reached ₹5.07 billion, a growth of 14%, with a stable profit margin of 14%.
- Latest quarterly (Q1 FY26) income was ₹991.7 crore, up 12.8% sequentially and 14.9% year-over-year; profit after tax was ₹134.9 crore, up 15.8% QoQ and 15.1% YoY.
- EPS for Q1 FY26 was ₹30.40, up from ₹27.10 in the previous quarter.
**Growth & Forecasts:**
- The company’s earnings and revenue are expected to grow at roughly 13-14% per annum in the next few years.
- Return on equity is forecast to be about 21% in three years, signalling strong capital efficiency.
- Price target estimates from analysts suggest a potential move toward ₹3,050 in the medium term.
**Business Fundamentals:**
- Shriram Pistons is a leading manufacturer of pistons, piston rings, and engine components for the automotive industry, serving both domestic and export markets.
- Its customer base covers passenger, commercial, and industrial vehicle sectors.
- The company is consistently improving technology and manufacturing processes, supporting quality and competitive positioning.
**Recent Operational Trends:**
- The company reported 21.45% profit growth for the June 2025 quarter, though its debtors turnover ratio has declined, indicating comparatively slower collection of receivables.
- Operational efficiency is strong, but management is actively working on improving the receivables cycle.
- Dividend payout is regular, with a recent interim dividend of ₹5 per share declared.
**Sentiment & Outlook:**
- Investor and analyst sentiment remains positive, with strong fundamental and earnings performance backing the share price.
- Shares are currently trading near all-time highs following quarterly results and forward guidance; some volatility can be expected as profit booking takes place and the company works through receivables issues.
- The company is viewed favorably for its ability to outperform sector average growth rates and maintain robust profit margins.
**Technical Overview:**
- The stock is in a strong uptrend and trading above its major moving averages.
- Key support can be found around ₹2,000; a break above ₹2,600 could target the analyst consensus price of ₹3,050.
Shriram Pistons continues to show solid performance, sector leadership, and growth, though investors may watch for further improvements in cash flow and receivables management for sustained momentum.