SIGACHI Price ActionSigachi Industries Ltd is currently trading near ₹38.8 after facing a significant decline over the past year. The price movement remains sideways in the short term, with the stock trading close to its 52-week low of ₹30.51 and resistance around ₹43.80. The overall trend is weak, and the stock continues to trade below key moving averages, showing no signs of a sustainable reversal.
The stock sees high daily price swings and speculative sentiment continues to drive recent movements. Financial performance shows revenue growth in the last quarter, but profits have declined sharply, leading to subdued earnings per share and a relatively high price-to-earnings ratio. Book value is low, and the price-to-book multiple remains elevated. While debt remains manageable, operating margins have compressed, and some pledged shareholdings introduce caution for investors.
Comparing its performance to sector peers, Sigachi shows weaker earnings and valuation metrics. The stock experienced a recent bounce but is still well below its yearly high. Short-term traders might focus on quick moves between the immediate support and resistance bands, but long-term investors will require clear recovery in both fundamentals and price action before considering new entries.
Bullishsetup

EMBDL Price ActionEMBDL (Embassy Developments Ltd) is trading around ₹94, having faced a persistent downtrend over the past year with a decline of nearly 22%. The stock’s 52-week range stretches from ₹89.22 (low) to ₹163.69 (high), reflecting significant volatility, though recent weeks have seen relatively steady movement between ₹94 and ₹98. Market capitalization is around ₹12,900 crore.
### Technical Overview
EMBDL’s short-term momentum is weak, with prices consolidating near their 52-week low and most technical indicators suggesting sideways to negative bias. The stock underperformed the Indian real estate sector and broader market over the past one year. It remains below its key moving averages, and oscillators indicate continued downside risk unless a clear reversal emerges. Short-term support is at ₹89, and resistance is found near ₹98–100; a move beyond either of these could define the next trend leg.
### Fundamentals and Valuation
For FY2025, EMBDL posted revenues of about ₹2,371 crore but continued to operate at a loss, recording negative earnings with a net loss of ₹82 crore and net profit margin at -3.5%. Gross margins stand at 21.7%, and EPS is negative at -0.60. Leverage is moderate, with a debt/equity ratio near 0.5. Valuation ratios are elevated—price-to-book is about 2.8, and the trailing P/E is not meaningful due to negative earnings. Compared to peers, EMBDL is trading at a premium on several valuation metrics.
### Peer Comparison and Outlook
EMBDL’s recent performance lags sector leaders like DLF and Macrotech Developers, both on price returns and growth metrics. Although operational revenue has rebounded from earlier lows, persistent losses and expensive valuations temper the medium-term outlook. Until a structural turnaround in earnings becomes visible or price action clearly breaks above resistance, EMBDL is likely to remain in a prolonged consolidation phase with a mildly negative bias.
Short-term traders should watch the ₹89–₹98 band as key decision zones for trend change. Long-term investors may consider waiting for fundamental improvement or more attractive valuation levels before adding exposure.

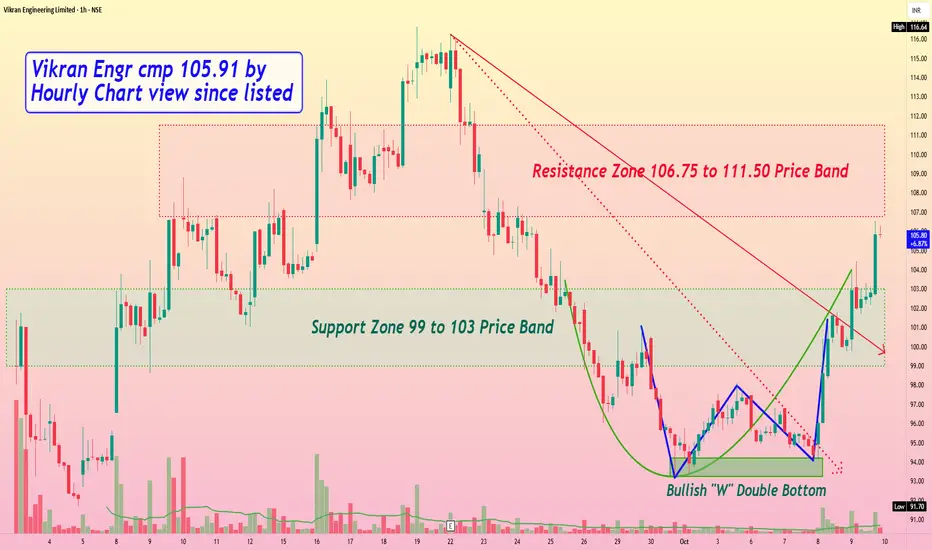
Vikran Engineering cmp 105.91 by Hourly Chart view since listedVikran Engineering cmp 105.91 by Hourly Chart view since listed
- Support Zone 99 to 103 Price Band
- Resistance Zone 106.75 to 111.50 Price Band
- Volumes are spiking well above avg traded quantity over past few days
- Subject to closure above Resistance Zone for few days, New ATH maybe anticipated
- Stock has formed bullish technical chart setup with Rounding Bottom and W Double Bottom
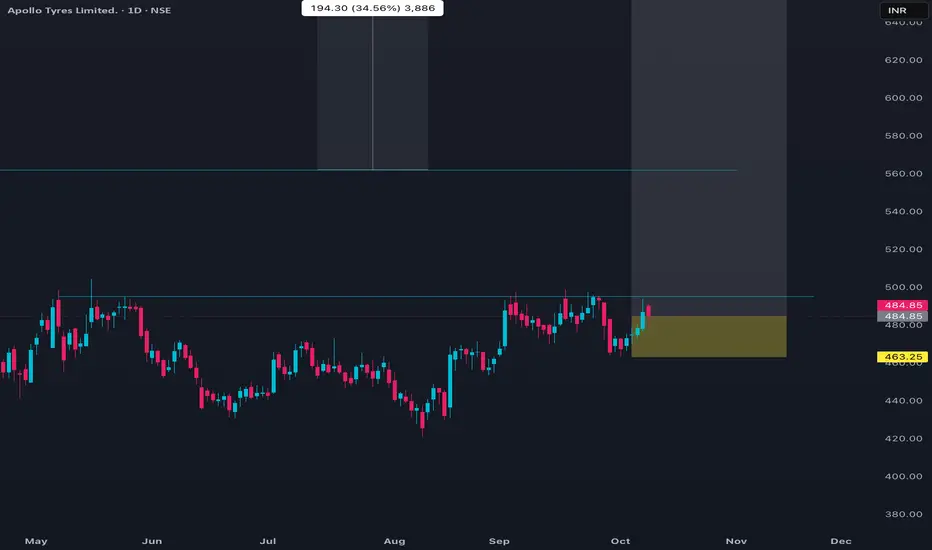
APOLLOTYRE Price ActionApollo Tyres is currently trading in the range of 479 to 492. The last recorded price was about 487, following a recent day’s high of 491.5 and a low of 479.65. The volume on the last trading day exceeded 5.8 lakh shares, with an average delivery percentage around 50%. The stock is experiencing mild upward price momentum on short-term technicals, with several recent bullish EMA crossovers on daily charts.
Financially, the market capitalisation is about ₹30,800 crore. The trailing P/E ratio stands high over 36, while the P/B is just above 2. The EPS has seen a notable YoY decline. Over the last month, price movement has been flat to slightly positive, while medium-term (six months) shows a rise of more than 20%. Returns over the past year remain negative. The 52-week high is 557, and the low is 371.
Analyst consensus is positive with several recent buy ratings and a target clustered around the ₹590 level. The overall trend is positive in the short term, supported by technical indicators, while valuation remains elevated.
Cupid Price ActionCupid Limited’s stock is trading around ₹158 as of early August 2025, having recently hit new record highs above ₹162. The share price surged over 45% in the past month and is up more than 100% year-to-date, significantly outperforming both its FMCG peers and the broader market. Volatility is high: daily moves of 5–6% are common, and intraday swings have reached as much as 8%. The stock is trading well above all major moving averages, reflecting strong buying momentum.
Long-term performance is outstanding: over 1,300% returns in three years and more than 2,100% across ten years. That said, short-term technical signals show that Cupid is “overbought” (very high RSI) and potentially due for a corrective pullback, though robust momentum could drive further gains. The high PE ratio near 104 and price/book around 21 indicate a rich valuation versus historic averages and sector norms.
Market capitalization is about ₹4,240 crore. Despite being expensive on most valuation models, the company is seen as fundamentally strong: steady operational performance, minimal debt, and no significant pledged shares. The company’s next earnings announcement is due August 8, and recent market behavior suggests results can drive significant further volatility.
Compared to other FMCG names, Cupid’s returns are exceptionally strong while most large and mid-cap sector players (like HUL, Dabur, and Colgate) have posted declines over the past year. Liquidity has increased with heavy volume spikes during rallies, supporting the uptrend.
In summary, Cupid is a high-momentum, high-volatility small-cap outperformer exhibiting extraordinary multi-year returns. The stock trades at elevated valuations and, while short-term corrections may occur, its leadership in the sector and technical strength continue to attract aggressive buyers.

BRITANNIA Price Action 2 probable entriesBritannia Industries Ltd is currently trading around ₹5,849 after opening at ₹5,882, slightly down from the previous close with a minor loss on the day. The stock’s recent 52-week high stands at ₹6,337, while the low is ₹4,506, reflecting a broad trading band throughout the year. With an annualized volatility of about 25%, the scrip has seen moderate market fluctuations. Market capitalization is robust, totaling approximately ₹1.41 trillion.
From a technical perspective, Britannia’s chart structure indicates mild downward momentum in the short term, with prices trending below the 20-day moving average but holding above the larger 50- and 200-day averages. The daily ranges have narrowed, and the price closed near the day’s low at ₹5,839, suggesting mild intraday bearish sentiment. Key support appears at ₹5,800, while resistance lies at ₹5,900 and then at the recent swing high. RSI and momentum indicators remain neutral, and trend-following tools show sideways movement, reflecting cautious accumulation.
Fundamentally, Britannia continues to deliver stable earnings even with moderate price declines. The trailing P/E is elevated at about 64, indicating a premium valuation, and the stock is currently trading at roughly 33% above its estimated fair value. The quarterly results for June 2025 showed an 8.8% year-on-year revenue increase with operating profit and net profit also marginally growing. Debt levels are moderate and promoter pledging is low, with no major concerns visible in the shareholding pattern.
Overall, Britannia holds long-term structural strength, but its short-term trend is weak. Investors are advised to wait for clear momentum signals before considering fresh positions, and any breakout above ₹5,900 may trigger a retest of annual highs, while downside risks are limited by strong support near ₹5,800.

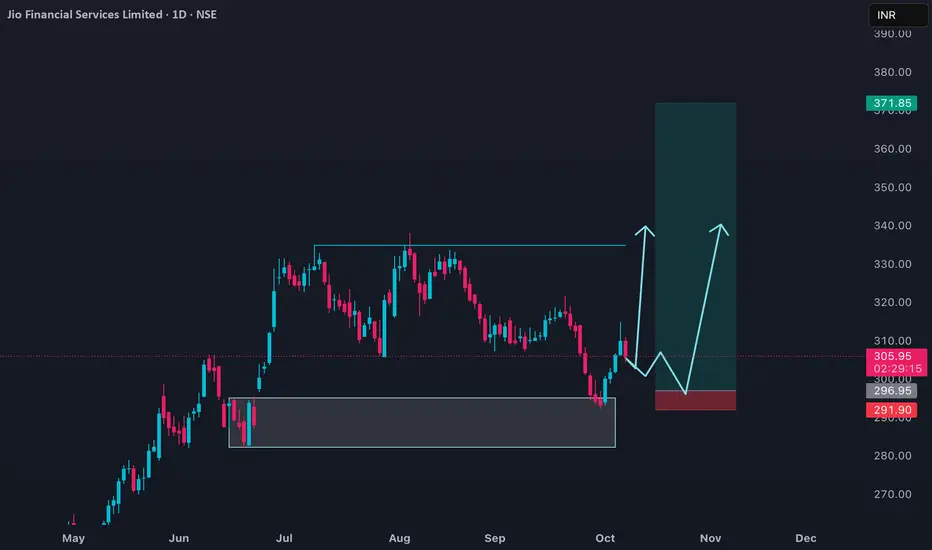
JIOFIN Price Action 2 probable entry set upJio Financial Services Ltd (JIOFIN) is currently trading just above 308, showing a modest recovery after recent volatility. Over the past year, the stock experienced a sharp swing, with its annual high near 395 and a low at 199. Despite its inclusion in NIFTY 50, price growth remains subdued, characterized by a 10% decline year-on-year and a slightly negative monthly return. The market capitalization sits around ₹1.95 trillion, positioning JIOFIN among the largest financial sector players.
Technically, the short-term trend is consolidative. Recent sessions reveal a narrow trading range with support levels established around 300 and resistance near 325. Moving average indicators on various timeframes remain bullish, while oscillators such as the RSI (near 60) and CCI signal mild upward momentum. MACD shows a positive bias, but the ADX suggests that the prevailing trend is only moderately strong. Volatility remains in check at about 2.9% daily, with beta over 1.8 signaling that JIOFIN is highly responsive to market shocks.
Fundamentally, the company reported robust quarterly revenue growth with income accelerating to ₹17,448 lakh in March 2025, and a corresponding net profit of ₹9,714 lakh. However, compounded annual profit growth for the past year is only 1%, and sales growth is at 20%. The price-to-earnings ratio is elevated, above 119, and the dividend yield is low. Operating margins remain high, but rising competition and increased sectoral scrutiny could impact future profitability.
Currently, JIOFIN demonstrates cautious optimism. Investors are tracking the upcoming earnings report on October 20 for near-term cues. While fundamentals are sound and large institutional interest remains, sustained upward movement will require a decisive breakout above the 325 level or a robust earnings beat. The risk-reward within this broad 300–325 range continues to favor patient accumulation, with downside protected by strong institutional support.
JAICORPLTD Price ActionJai Corp Ltd traded with a neutral to mildly bearish tone, hovering near 144 in the latest session after seeing notable weakness over the past year. The stock has underperformed most of its industry peers, witnessing a year-to-date drop of around 58%. Despite this steep decline, recent sessions have shown stabilization as prices consolidate within a broad range between 140 and 173.
From a technical perspective, major indicators point to a lack of clear momentum. Moving averages for short and medium terms highlight sideways price action. Oscillators signal a neutral trend with neither buyers nor sellers in clear control. The stock faced strong selling pressure after hitting its 52-week high near 401 and has since formed a prolonged downtrend, but the recent bounce from 81.5 signals possible value-based interest emerging at lower levels.
On the fundamental side, the price-to-earnings ratio remains moderate at 16 and the price-to-book ratio is approximately 2.4, with market capitalization near 2,590 crore. Earnings per share improved sharply in the latest quarter, reflecting some operational recovery. Net profit growth and revenue acceleration on a quarterly basis signal that fundamentals may be turning around, but the long-term trend still requires confirmation via fresh price breakouts or sector tailwinds.
Support is visible at 140, with short-term resistance near 173. Until a sustained close above resistance or a breakdown below support, expect continued consolidation. Current positioning suggests cautious accumulation but not aggressive buying unless technical momentum improves.

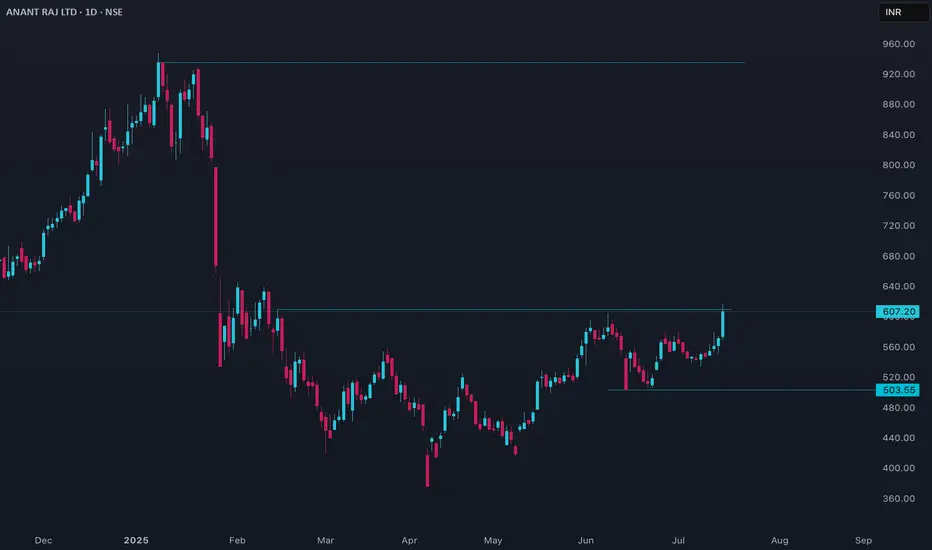
ANANTRAJ Price Action
## Current Price & Performance
- Last close was ₹607.20.
- Over the past week, the stock is up more than 10%, showing strong short-term momentum.
- Over the past year, it has gained nearly 25%, but suffered a sharp 32% drawdown over six months.
- The 52-week price ranged from ₹376.15 to ₹947.90, reflecting high volatility.
## Valuation and Metrics
- ANANTRAJ trades at a high valuation, with price-to-earnings and price-to-book ratios above typical industry averages.
- Its market capitalization puts it among the stronger players in the real estate sector.
- Key valuation multiples such as PE and EV/EBITDA are elevated, indicating investors are paying a premium for expected growth.
- The stock’s PEG ratio suggests its growth is reasonably in line with its price.
## Analyst Sentiment and Targets
- Most analysts rate the stock as a strong buy, highlighting strong upside potential with target prices higher than the current market price.
- The consensus one-year price targets suggest potential returns ranging between 24% and 49% from current levels.
## Technical & Fundamental Observations
- Compared to sector peers, its PE is lower than certain high-flyers but remains above the overall industry average, making it expensive by historical standards.
- Return on equity has hovered around 8.5% recently, with efficient operating and employee costs supporting margins.
- A modest dividend has recently been declared.
- A slight increase in promoter holding indicates management confidence.
## Risk Factors
- Substantial volatility in recent months may raise concerns for risk-averse investors.
- Both intrinsic value models and relative measures suggest the shares may be overvalued by over 20% at current prices.
- While momentum and sentiment are positive, valuation risk remains a key factor for new investors.
## Conclusion
ANANTRAJ is benefiting from strong momentum and positive sentiment, with analysts forecasting further upside. However, current valuation levels are high, and investors should carefully weigh the potential for price appreciation against the risk of overvaluation and ongoing volatility. Consider both the fundamental strengths and the elevated price multiples before making an investment decision.
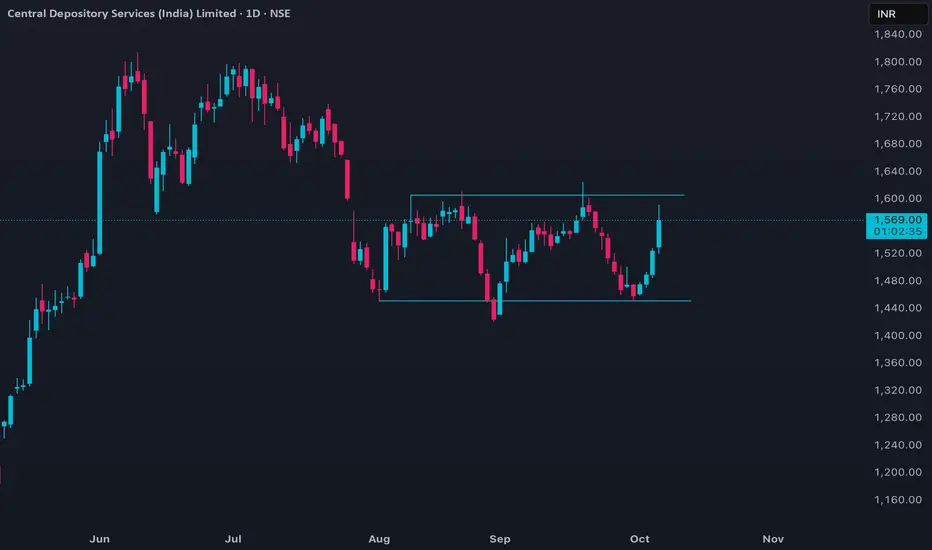
CDSL Price ActionCDSL opened the session with strong buying interest and surged nearly 3% in early trade, reflecting robust momentum and outperforming broader sector trends. The stock is currently trading around 1,570, after touching an intraday high near 1,592 and respecting support at 1,520. Volumes are significantly above the recent average, indicating active participation from both institutional and retail traders.
On the technical front, CDSL continues to trade above its 50-day and 200-day moving averages, maintaining a mildly bullish trend as confirmed by momentum oscillators. The daily charts exhibit a series of higher lows, and the stock has rebounded from its recent base near 1,450. Key resistance is seen at 1,625; a breakout above this zone could trigger a further rally toward 1,800. Immediate support for short-term traders lies at 1,535, and any dip toward this zone may see strong buying interest.
Technically, mixed longer-term indicators suggest some caution—while the RSI remains bullish and the overall trend is favorable, weekly signals like MACD show mild bearishness, indicating some volatility. Still, the overall bias remains positive as long as the price sustains above key support levels, making CDSL a favored pick in the capital market sector for the near term.
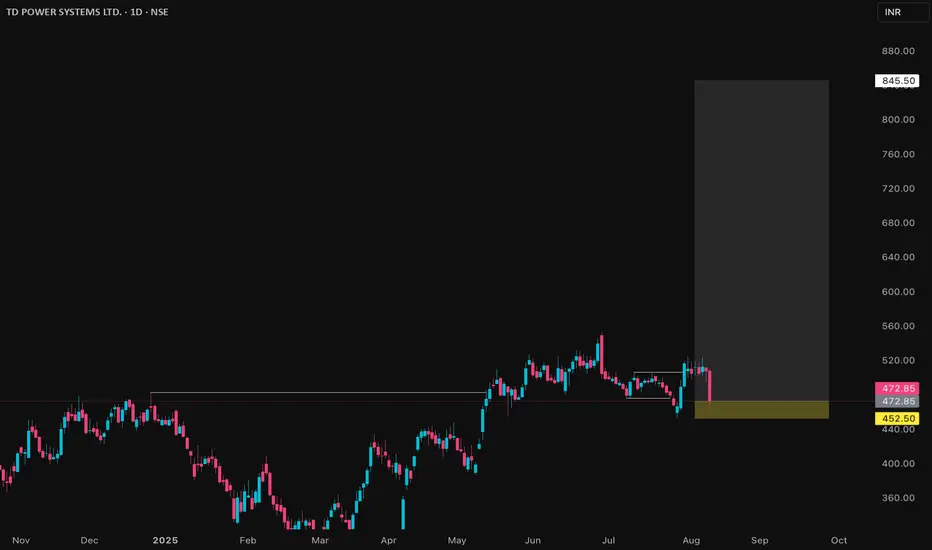
TDPOWERSYS Price Action## TDPOWERSYS Price Details (as of August 8, 2025)
### Market Metrics
- Current share price is ₹472.85.
- Market capitalization is ₹7,385crore.
- The 52-week price range is ₹293 to ₹552.75.
- Its all-time low was ₹14 in March 2020; all-time high is ₹552.75 in June 2025.
### Returns & Volatility
- 1-month return: -1.48%.
- 1-year return: about 18%-20%.
- 3-year return: over 300%.
- 5-year return: over 1,900%.
- Weekly volatility is 6%, which is above average.
- Beta is 2.04, indicating higher risk and volatility versus the overall market.
### Valuation
- Price/Earnings Ratio: 42.31, higher than sector average.
- Price/Book Ratio: 8.58, above sector average.
- Dividend yield is 0.25%.
### Company Fundamentals
- Trailing 12-month revenue: ₹13.77billion.
- Net Profit Margin: 13.75%.
- EPS: ₹12.12.
- Gross margin: 34.13%.
- Debt to equity: 1.4%, showing low leverage.
### Valuation Analysis
- Estimated intrinsic value is ₹258.02.
- Current price is about 45% over this value, meaning the stock is overvalued.
### Qualitative Notes
- Strong profitability and cash flow, but price reflects high growth expectations.
- High volatility, especially in the short term.
- Dividend policy: small but regular.
- Recent technical signals showed buy recommendations, but the stock has been correcting lately.
**Overall:** The stock is highly priced relative to its value and historical norms, with impressive growth but also increased volatility and a potential for continued price correction.
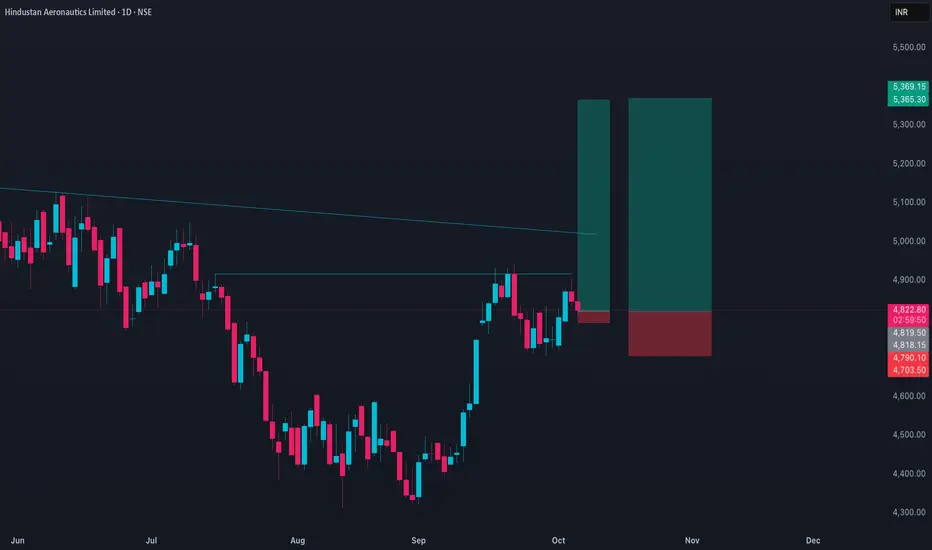
HAL Price ActionHindustan Aeronautics Limited (HAL) opened the day strong, continuing its upward momentum from the previous sessions. The stock traded above key moving averages, indicating sustained bullish sentiment. Early in the session, the price held above recent swing lows, and mild intraday retracements provided support zones for buyers.
On the technical side, HAL maintains a higher-high, higher-low structure on the daily chart, signifying that buyers are still in control. Volumes are stable, and no signs of distribution are visible so far. If the price sustains above the short-term support near recent intraday lows, further upward movement is likely. Any breakdown below immediate support could trigger a short-term pullback; however, medium-term outlook remains positive as long as the price holds above its last consolidation base.
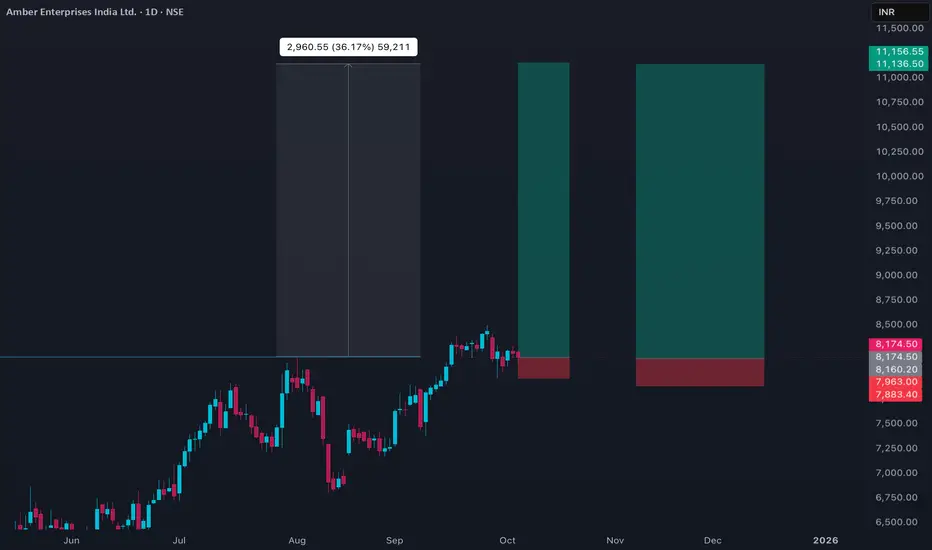
AMBER Price ActionAmber Enterprises India (AMBER) detailed price analysis as on October 7, 2025:
- The stock is trading near ₹8,172 to ₹8,175 levels on BSE and NSE with a slight decline of about 0.49% compared to the previous close.
- The day’s trading range was between ₹8,054.6 (day low) and ₹8,240.5 (day high) on BSE, and ₹8,081 to ₹8,243.5 on NSE.
- The stock opened around ₹8,214 and showed mild intraday volatility within this range.
- The 50-day moving average is near ₹7,720 and the 200-day moving average near ₹6,930, indicating a strong uptrend in the medium to long term.
- The Price-to-Earnings (P/E) ratio remains high at about 101, reflecting rich valuation.
- The stock showed moderate volume compared to average, signaling steady participation but no strong directional bias today.
- Long-term fundamentals remain solid with consistent revenue and earnings growth.
- Resistance is near the recent highs around ₹8,490, with support levels near ₹7,700 to ₹7,900.
- The overall price behavior suggests consolidation with a slight bearish tilt on the day, but medium-term bullish momentum stays intact.
This analysis captures the current sideways-to-slightly-negative price action within a broader uptrend context for AMBER on this date.
COCHINSHIP Price ActionCOCHINSHIP exhibited steady price action today, maintaining a balanced trading range through most sessions. After opening with an initial minor uptick, the stock displayed mild volatility, oscillating within a narrow band and avoiding any sharp declines. Resistance was noted near recent highs, with persistent supply seen above that level, while dips found buyers at established support zones. Volume activity remained moderate, neither confirming nor rejecting direction bias. The intraday candlestick structure suggested a neutral to mildly bullish undertone, backed by consistent demand at lower bands. Overall, price sentiment favored gradual accumulation rather than aggressive breakout or reversal characteristics.

DELHIVERY Price ActionDELHIVERY has recently displayed a stable performance, with its stock trading in a tight range after recovering from previous lows. The price trend shows higher support levels indicating accumulation, while minor pullbacks have led to renewed buying interest. The company’s operational strengths in logistics and expanding e-commerce volumes continue to support positive market sentiment.
Technically, DELHIVERY maintains momentum above key moving averages, and volumes have been steady during upticks. There is mild resistance near its recent peak, and a clear breakout could trigger additional gains. On the downside, sustained weakness below established support may encourage short-term corrections. Overall, the outlook remains constructive, driven by robust business fundamentals and positive demand for digital logistics solutions.

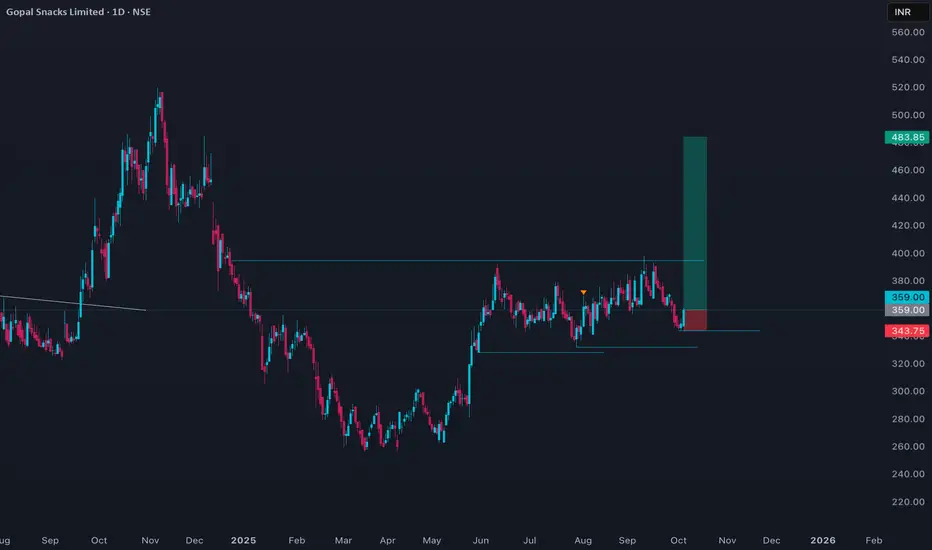
GOPAL Price ActionGopal Snacks Ltd is currently trading at around ₹348.8, having shown some recovery from lower levels over the last few months. The stock has a 52-week high of ₹520 and a low of ₹255.9, indicating significant volatility during the year. In the past week, the price remained largely stable, with minor gains, and the one-month performance is up by nearly 10%.
Despite recent price improvement, Gopal Snacks faces a relatively high price-to-earnings (P/E) ratio and trades at a premium to its book value. Its return on equity and return on capital employed are decent compared to peers, but sales growth has been modest over the longer term. Trading volumes and price action suggest continued investor interest, but profit-taking has limited any sharp upward surge. Near-term movement is expected to stay range-bound unless there is a major earnings surprise or sector catalyst. The dividend yield remains modest, reflecting its growth-focused policy. Overall, the price reflects a balance between recent recovery and ongoing valuation concerns, with technical support seen near ₹340 and resistance around ₹360–370.
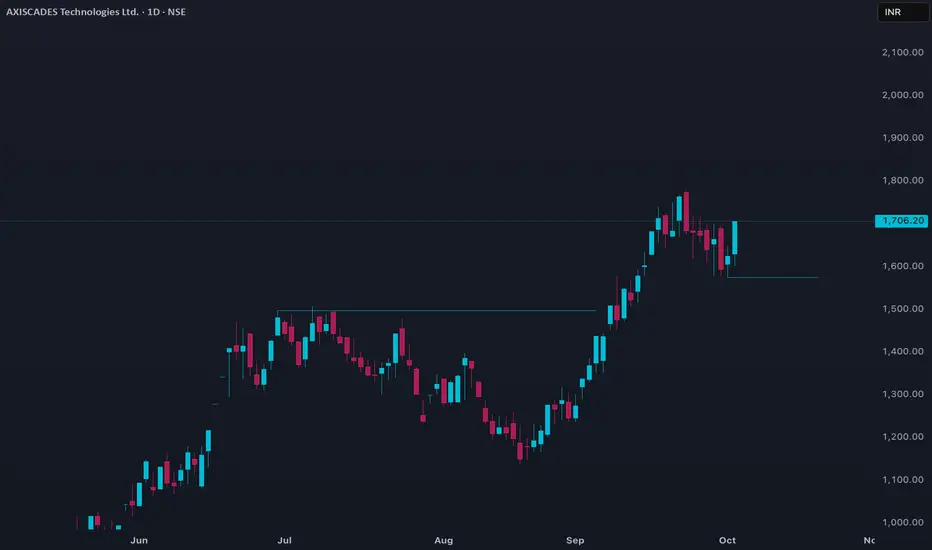
AXISCADES Price ActionAXISCADES (AXISCADES Technologies Ltd) currently shows a steady upward price trajectory, supported by consistent buy-side activity and improving sector sentiment. The stock has moved past recent consolidation phases, reflecting strong investor confidence tied to its expansion in engineering and technology services.
Recent sessions have seen AXISCADES hold above significant moving averages, suggesting momentum remains positive. Technical indicators highlight sustained volume on rallies, with the price forming higher highs and higher lows—a classic sign of bullish strength. The company’s promising contract wins and efforts to diversify into emerging industries have added to attractive valuations.
While immediate resistance is visible around its recent peak, a clear breakout could result in further acceleration. Traders may observe short-term pullbacks if profit-taking sets in, but stable support levels are expected to underpin the medium-term outlook. Overall, AXISCADES appears set for continued advances, contingent on broader market stability and ongoing operational execution.
MANORAMA Price ActionMANORAMA (Manorama Industries Ltd) recently demonstrated a resilient price movement, reflecting overall market trends and sector-specific news. The stock has managed to sustain an uptrend, with regular buying interest observed on dips, indicating continued confidence from both retail and institutional investors.
The price has been trading close to its recent highs, encountering mild resistance at key psychological levels. Momentum indicators signal positive sentiment, reinforced by robust volumes during upward moves. The company’s fundamentals, such as healthy earnings growth and strong demand for its specialty fats and oils, are contributing to market optimism.
On the technical front, the stock is showing strength above important moving averages, and higher lows have formed consistently over the past weeks. A breakout above the immediate resistance zone could open the path to further gains. However, any sudden reversal below established support areas may prompt short-term corrections. The overall outlook remains constructive, with a focus on disciplined risk management as the stock continues its upward trajectory.

CRUDE OILHello & welcome to this analysis
USOIL in daily time frame has activated a bullish Harmonic Gartley suggesting probable upside till $62 - 64.50 - 69 as long as it does not breach $59.25
Crude (MCX) is forming a bullish candlestick - Hammer also suggesting likelihood of a rally till 5575 - 5750 - 6150 as long as it does not breach 5300
After a very long time a bullish formation is giving a follow through signal in CRUDE
All the best
Regards

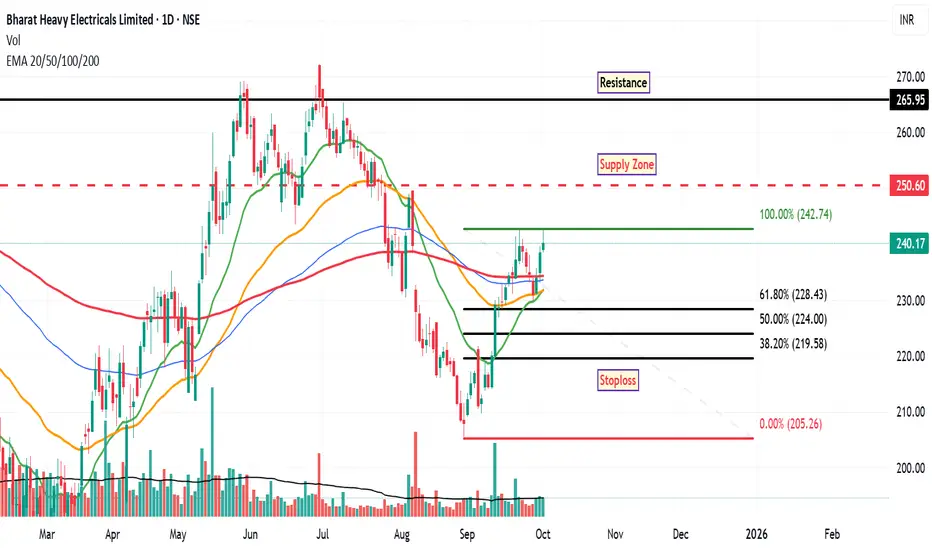
BHEL: Prospective InsightFollowing a recent retracement from a previously identified discount zone, the stock of Bharat Heavy Electricals Limited (BHEL) is exhibiting signs of potential bullish momentum. This outlook is supported by several technical indicators observed on the daily chart:
Fibonacci Retracement:
The stock has retraced to the 61.8% Fibonacci level from its recent swing high, a zone often regarded by technical analysts as a potential area of price support and reversal.
Exponential Moving Averages (EMAs):
Price action has moved above the 20-day, 50-day, 100-day, and 200-day EMAs, which may suggest strengthening bullish sentiment and a shift in medium- to long-term trend dynamics.
Golden Crossover Setup:
The shorter-term moving averages appear to be converging toward a golden crossover (typically when the 50-day EMA crosses above the 200-day EMA), a pattern that historically has been associated with bullish continuation, though confirmation is still pending.
Relative Strength Index (RSI):
The RSI has crossed above the 60 level, indicating increasing buying momentum. While not yet in overbought territory, this move may reflect growing investor interest.
Immediate Supply Zone:
Based on historical price action and volume profile, the stock may encounter resistance near the ₹250 level, with a stronger resistance band around ₹265 .
Support Zone:
Should the price face selling pressure, a potential support area lies near the 38.2% Fibonacci retracement level, approximately around ₹219 .
Disclaimer: This analysis is intended for informational and educational purposes only and does not constitute investment advice or a recommendation to buy or sell any securities. Market conditions can change rapidly, and traders should conduct their own due diligence or consult with a registered financial advisor before making any investment decisions.
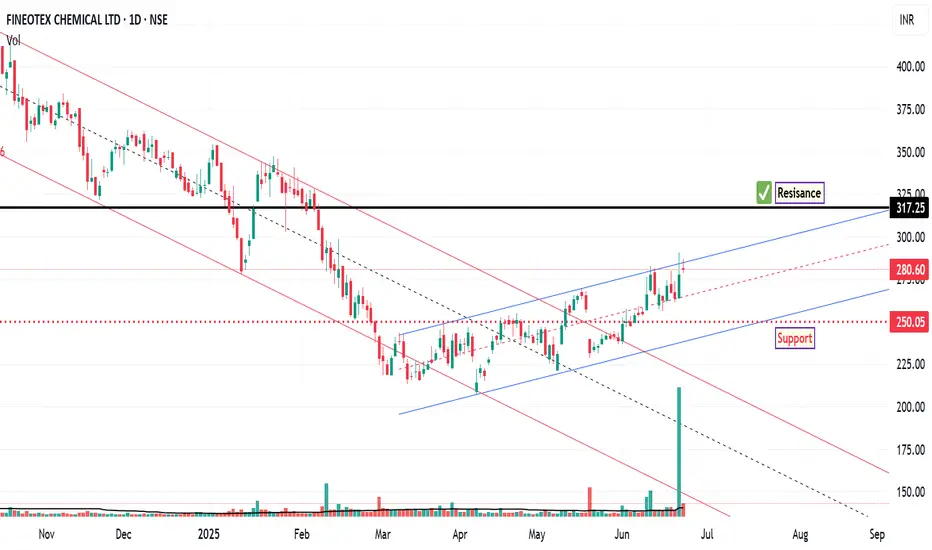
FCL: Technical Setup Signals 10% Upside Potential
The chart of FCL outlines key price levels that represent potential breakout zones, signaling shifts in market momentum. It also identifies critical support areas where buying interest may emerge, offering insight into potential entry points.
Additionally, resistance zones are clearly marked, indicating probable barriers to upward price movement. These levels are instrumental in formulating strategic entry and exit decisions based on anticipated market behaviour.
Disclaimer:
This technical analysis is provided for informational and educational purposes only. It does not constitute financial advice or a recommendation to buy or sell any security. Investors should perform their own due diligence and consult with a licensed financial advisor before making any investment decisions.
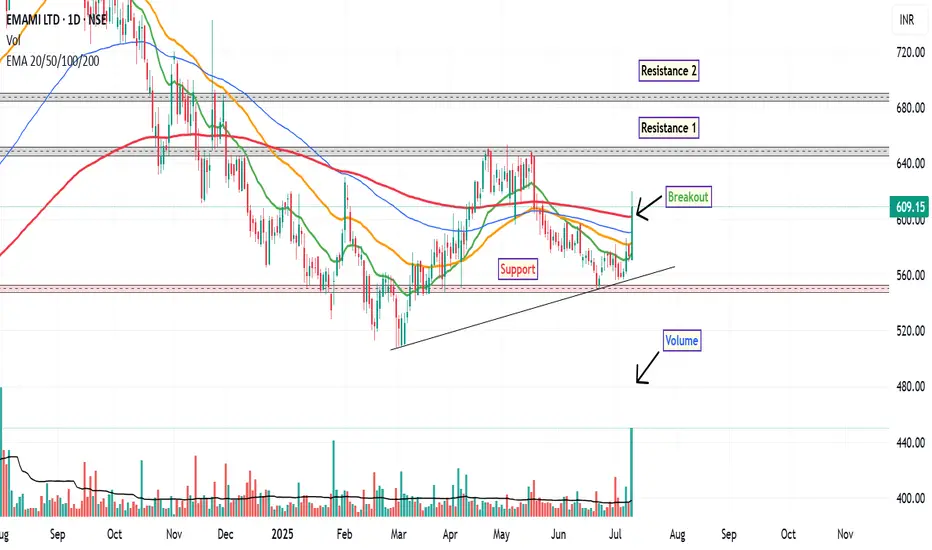
EMAMI: Technical Outlook UpdateFollowing a prolonged downtrend that began in September 2024, EMAMI Ltd. has recently exhibited signs of a potential short-term trend reversal on the daily chart. The stock has demonstrated a notable uptick in momentum, marked by several key technical developments.
The stock has decisively moved above its 200-day EMA, a level often regarded as a long-term trend indicator. This breakout was accompanied by a significant increase in trading volume—approximately 5 times the average volume of the 50-day moving average, suggesting heightened market participation. The RSI has crossed above the 60 level, indicating strengthening bullish momentum, though it is approaching the overbought zone.
A bullish crossover in the MACD was observed, further supporting the case for near-term strength.
Around ₹600, where the stock is currently consolidating post-breakout. First resistance near ₹650, Second resistance around ₹690. A technical stop-loss could be considered below ₹548, aligning with recent swing lows and support levels.
Disclaimer: This analysis is intended solely for educational and informational purposes. It does not constitute investment advice or a recommendation to buy or sell any financial instrument. Market participants are encouraged to conduct their own research or consult with a qualified financial advisor before making any trading decisions.
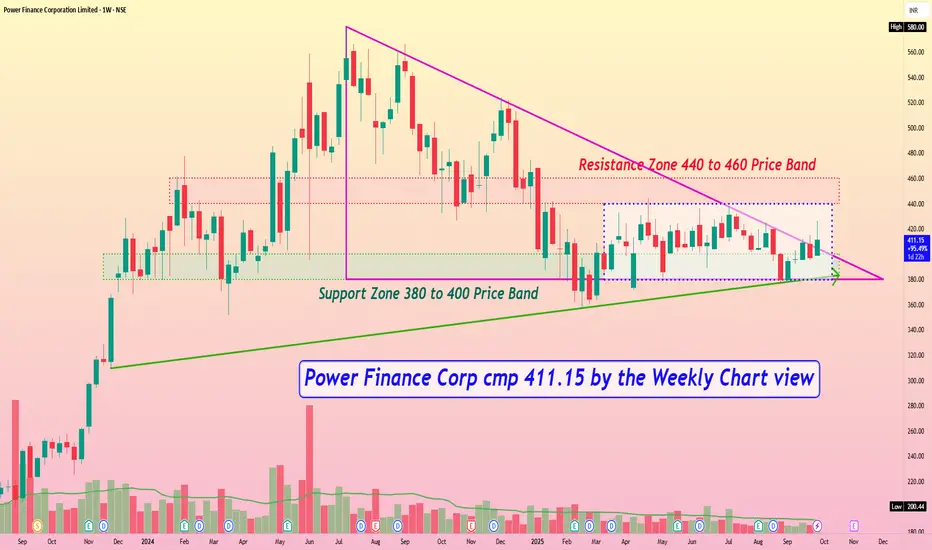
Power Finance Corp cmp 411.15 by the Weekly Chart viewPower Finance Corp cmp 411.15 by the Weekly Chart view
- Support Zone 380 to 400 Price Band
- Resistance Zone 440 to 460 Price Band
- Price traversing within Descending Triangle pattern after ATH
- Rising Support Trendline well respected by touch points since close to 2 years
- Price seen majorly trending inside Darvas Box since Mar 2025 in a range of 380 to 440
- Volumes in close sync with avg traded qty on Daily Chart and in steady stream by Weekly Chart