HERITGFOOD Price ActionHeritage Foods Ltd (HERITGFOOD) traded strongly on September 18, 2025, closing around ₹509 after hitting an intraday low of ₹496 and a high near ₹519. The stock jumped nearly 4% today, continuing its recent upward trend with robust volumes exceeding two million shares. The 52-week high stands at ₹658, indicating further upside potential if current momentum persists.
Technically, the stock trades above medium-term moving averages, supporting a bullish bias. Immediate support is seen at ₹496, while resistance levels are near ₹520 and ₹540. The price-to-earnings ratio is approximately 28, with solid return metrics and healthy profit growth. Heritage Foods remains well positioned for short-term gains unless price falls below the ₹496 support.
Bullishsetup

SANSERA Price ActionSansera Engineering Ltd (SANSERA) closed today at approximately ₹1,482, showing positive momentum with a steady intraday range between ₹1,445 and ₹1,523. The stock remains near its recent highs, supported by robust volume and favorable technical conditions.
### Technical Analysis
- The stock trades above its key short-term and medium-term moving averages, indicating a bullish trend.
- Momentum indicators like RSI are comfortably above 50, hinting at strengthening buying pressure without being overbought.
- Support is well established around ₹1,430–1,450 levels, which acted as a strong base during intraday dips.
- Near-term resistance stands around ₹1,520–1,525; a breakout above this would likely propel the stock toward the ₹1,600 level.
### Price Action Summary
Sansera Engineering has shown resilience after recent consolidation, with buyers stepping in at major support levels, confirming positive accumulation. The market outlook remains optimistic given steady fundamentals and technical strength, with room for further appreciation in the short to medium term.
Traders should monitor for sustained volumes and a decisive close above resistance to confirm the bullish breakout, while keeping an eye on support zones for any corrective pullbacks.

IPL (India Pesticides Limited) Price ActionIPL (India Pesticides Limited) closed today at ₹235.84, after trading within an intraday range of approximately ₹217 to ₹239. The stock showed strength supported by steady volumes.
Technically, IPL shows a mixed to neutral outlook. The shorter-term moving averages (10, 20, 30, 50-day EMAs and SMAs) are signaling sell, while longer-term moving averages (100 and 200-day) show buy signals, indicating some consolidation or indecision near current levels. Momentum oscillators like RSI (around 46) and MACD are neutral to slightly bearish, with some buy signals from momentum and stochastic RSI.
Support is visible near ₹220–225, with resistance near ₹240–245. Sustained trading above resistance could open bullish momentum toward ₹260, while a drop below support might trigger short-term weakness to around ₹200.
In summary, IPL sits in a cautious consolidation zone with mixed technical signals but potential for a directional move on breakout or breakdown.

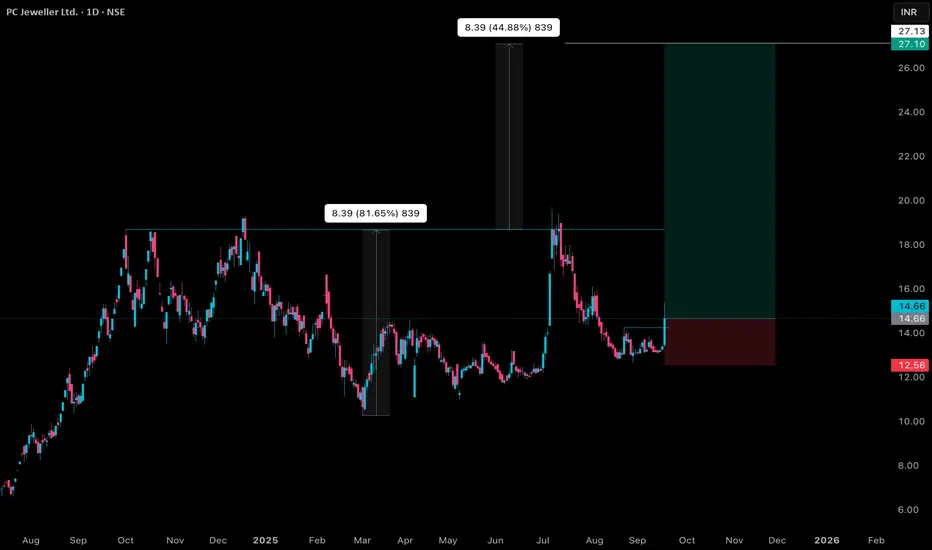
PCJEWELLER Price ActionPC Jeweller closed today at ₹14.66, up around 9.4% from the previous close. The stock traded in a range between ₹13.37 and ₹15.38 during the session, showing strong buying interest and significant intraday volatility. The price surge follows better-than-expected quarterly results, with a 4% year-on-year rise in consolidated net profit and substantial revenue growth, which supported bullish momentum.
Technically, PC Jeweller is showing signs of a bullish shift with support around ₹13–14 and resistance near ₹15–16.70. A sustained move above ₹15 could open the path toward higher levels between ₹16 and ₹17. The stock has been forming higher lows and maintaining good volume, signaling strength. However, a breakdown below ₹13–13.50 would indicate a loss of momentum and potential short-term correction.
Overall, PC Jeweller currently exhibits bullish momentum with positive fundamentals supporting the uptrend, but it remains essential to monitor key support and resistance zones closely for trade decisions.
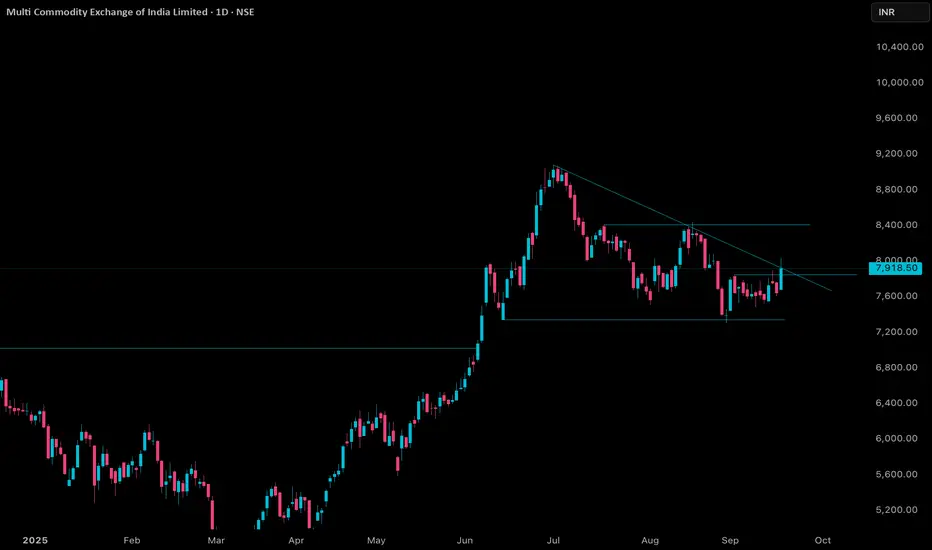
MCX Price ActionMCX closed at ₹7,918.50 today, after trading in a volatile range with an intraday low of ₹7,683.00 and a high of ₹8,035.00. The session opened at ₹7,683.00, and robust buying near the lows propelled prices upward, though profit-taking near ₹8,035 capped gains. Technicals remain bullish, with MCX trading above all major moving averages and a 14-day RSI at 56.49, indicating a healthy trend without excessive overbought conditions.
The sustained uptrend is supported by consistently higher lows and strong volume, which was notably above its two-week average. Resistance for MCX is now established around ₹8,035–₹8,040, a close above which could clear the way for a run towards the ₹8,400–₹8,700 levels. Support zones are firmly set at ₹7,680 and ₹7,645; a break below these may invite near-term profit booking. Overall, MCX remains in a positive territory, with traders watching for momentum breakouts above resistance and monitoring for any reversal signals at support.
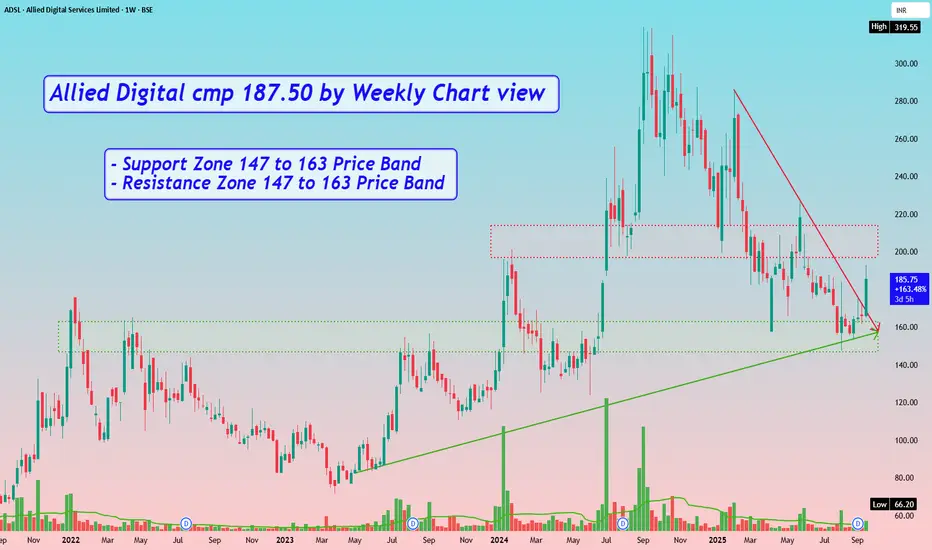
Allied Digital cmp 187.50 by Weekly Chart viewAllied Digital cmp 187.50 by Weekly Chart view
- Support Zone 147 to 163 Price Band
- Resistance Zone 147 to 163 Price Band
- Support Zone was tested retested over past few days
- Volumes are improving by demand based buying on the counter
JKLAKSHMI Price ActionJK Lakshmi Cement Ltd is trading at ₹902.20 as of September 14, 2025. The stock opened at ₹906.60 and touched a high of ₹918 and a low of ₹900.10 during the session. The company’s 52-week range is ₹660.50 to ₹1,021.20. Total market capitalization stands at about ₹10,616 crore, with sustained trading volumes and turnover indicating active investor participation.
For FY25, JK Lakshmi Cement reported consolidated revenue of ₹6,193 crore, reflecting a 9% year-on-year decline due to lower blended realizations, which averaged ₹5,100 per tonne, down 10% compared to last year. EBITDA margins contracted by 150 basis points to 14%, directly impacted by lower cement prices, though the overall cost of cement production fell 8% to ₹4,393 per tonne, mainly driven by a 20% drop in power and fuel costs. Net profit for the last four quarters stood at ₹387.42 crore, while operating profit for the year reached ₹864 crore, and trailing twelve-month earnings per share is ₹31.55. Sales volume growth in Smart Building Solutions (SBS) increased by 13% to ₹620 crore, aided by the commissioning of new putty and white cement plants, and additional readymix concrete (RMC) plants.
The company’s price-to-earnings ratio is about 28.6, price-to-book is 3, and the return on capital employed is 10.5%. Dividend yield remains solid at 0.72%, with a healthy payout ratio. On the balance sheet, equity capital is ₹59 crore with reserves of about ₹3,495 crore, and total assets as of March 2025 are ₹8,445 crore. Debt is under control, and the company continues to invest in capacity and technological upgrades.
Technical indicators show JK Lakshmi trading above its 50-day and 200-day moving averages, confirming strong momentum. The one-year stock price return is about 13%, and compounded annual growth rate for five years is 27%. The RSI and MACD are in moderate zones, indicating sustained positive sentiment without immediate overbought risk. Institutional and promoter holdings remain steady, and the outlook is constructive, backed by efficient cost management, sector demand, Smart Building Solution expansions, and new product initiatives.

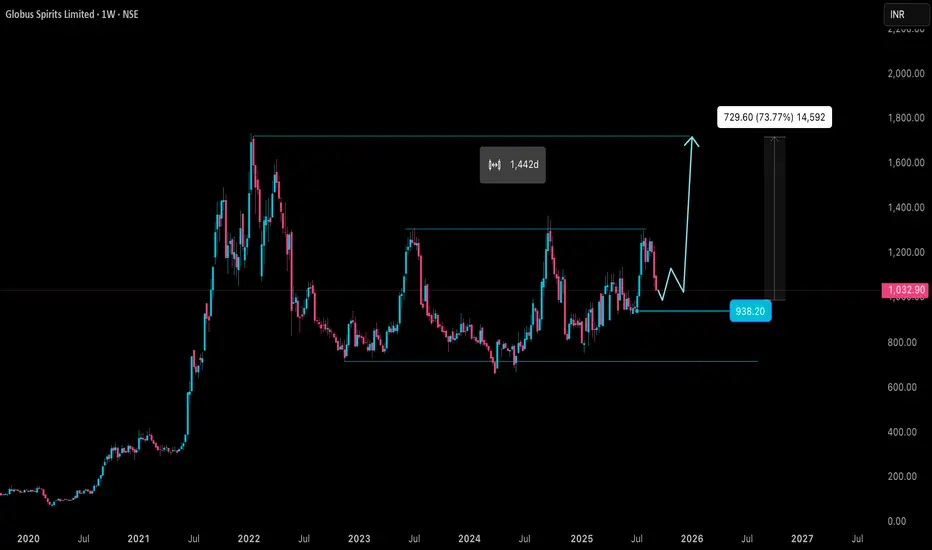
GLOBUSSPR Price ActionGlobus Spirits Ltd is trading at ₹1,203.65 as of September 14, 2025, reflecting strong price action near its annual high of ₹1,373.35 and well above its 52-week low of ₹751.05. Market capitalization stands at approximately ₹3,487 crore, with active trading volumes indicating sustained investor interest.
The company posted a total income of ₹2,537.14 crore for the latest financial year, with a net profit of ₹21.92 crore and earnings per share at ₹8.75 on a trailing twelve-month basis. Operations span branded Indian Made Foreign Liquor (IMFL) and bulk ethanol sales, driving stable revenue growth amid resilient demand from both retail and institutional buyers. Operating margins are healthy, helped by improved product mix and continued cost discipline, while net profit margin remains modest due to ongoing investments in capacity and distribution expansion.
Globus Spirits maintains a robust balance sheet with manageable debt, strong cash flows, and regular dividend payouts. Promoter shareholding is steady, supporting long-term confidence in business strategy and execution. Technical indicators show the stock trading above key short- and long-term moving averages, with momentum oscillators still in a bullish zone. However, given the recent rally, investors should watch for profit booking near resistance levels.
Overall, Globus Spirits demonstrates solid financial strength and growth prospects, supported by sector tailwinds in the alcobev and ethanol market, value-added product launches, and expanding distribution networks. The medium-term outlook is constructive, contingent on healthy demand and prudent operational execution.
SUMMITSEC Price ActionSummit Securities Ltd is trading near ₹1,914 as of September 13, 2025. The share price has seen a steady uptrend through the year, moving from its 52-week low of ₹1,226 to highs approaching ₹1,959. Market capitalization is around ₹2,080 crore, reflecting niche investor interest in this diversified investment holding company.
Financially, Summit Securities maintains a conservative approach with a strong balance sheet, minimal debt, and healthy cash reserves. The company’s core portfolio contains significant equity holdings in top Indian conglomerates, driving stable dividend income and capital gains. Operating margins and net profit margins remain high thanks to low operating costs and recurring investment returns, resulting in a robust return on equity above 8%.
Technically, the stock is trading well above its short- and long-term moving averages, indicating continued positive sentiment. Both RSI and MACD are in a neutral-to-bullish zone, showing momentum is intact without risks of over-extension. Shareholding is primarily with promoters and institutional investors, ensuring stability. Overall, Summit Securities offers a constructive outlook, anchored in prudent capital preservation and consistent portfolio value growth.

GRSE Price ActionGarden Reach Shipbuilders & Engineers Ltd (GRSE) is trading at ₹2,581.90 as of September 13, 2025, marking robust momentum after a sharp rally in recent months. The stock opened at ₹2,370 and reached a session high of ₹2,586.40, comfortably near its 52-week peak of ₹3,538. Market capitalization stands at approximately ₹29,576 crore, indicating significant institutional and retail interest following active trading volumes.
The company’s annual revenue exceeds ₹3,300 crore, propelled by sustained order flow from the Indian Navy, Coast Guard, and growing export opportunities. Net profit margins and operating margins have shown improvement, with current operating margin around 16% and return on equity above 18%, signifying strong operational efficiency and effective cost control. Recent quarterly profits have confirmed consistent earnings growth, supported by a healthy order book and streamlined project execution.
Financially, GRSE maintains a solid balance sheet with low debt and robust cash flows, enabling regular dividend payouts and reinvestment in capacity expansion. The price-to-earnings ratio is moderately higher than sector averages, reflecting market optimism about continued order wins and timely delivery of key projects. Promoter holding remains stable, and increased institutional participation underscores confidence in long-term prospects.
Technically, the stock trades decisively above both its 50-day and 200-day moving averages, indicating sustained bullish momentum. RSI and MACD readings are in a strong trend zone, but not yet in overbought territory, suggesting further upside potential if sector tailwinds persist. GRSE’s outlook remains constructive, with earnings visibility supported by a growing pipeline and ongoing modernization initiatives in naval and defense shipbuilding.

Shakti Pumps cmp 856.65 by Daily Chart viewShakti Pumps cmp 856.65 by Daily Chart view
- Support Zone 775 to 805 Price Band
- Resistance Zone 885 to 920 Price Band
- Symmetrical Triangle Breakout attempted
- Intermittent Heavy Volumes surge seen by demand based buying
- Rising Price Trendline and Channel indicating slow and steady upside momentum
- Fresh upside may be foreseen, post Resistance Zone Breakout and sustained closure above it for few days

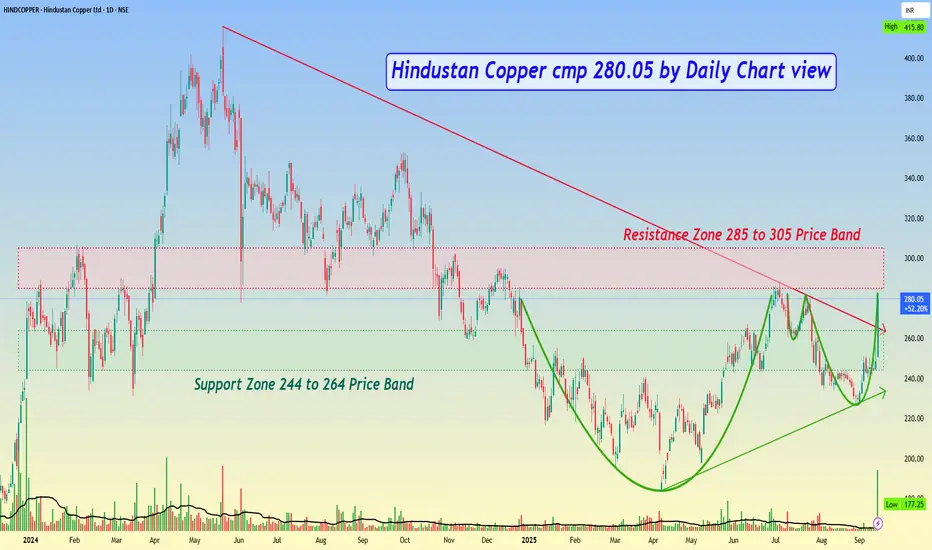
Hindustan Copper cmp 280.05 by Daily Chart viewHindustan Copper cmp 280.05 by Daily Chart view
- Support Zone 244 to 264 Price Band
- Resistance Zone 285 to 305 Price Band
- Huge Volumes surge by demand based buying
- Falling Resistance Trendline Breakout sustained closure
- Support Zone got well tested and retested over past few days
- Bullish Rounding Bottoms formed by the Resistance Zone neckline
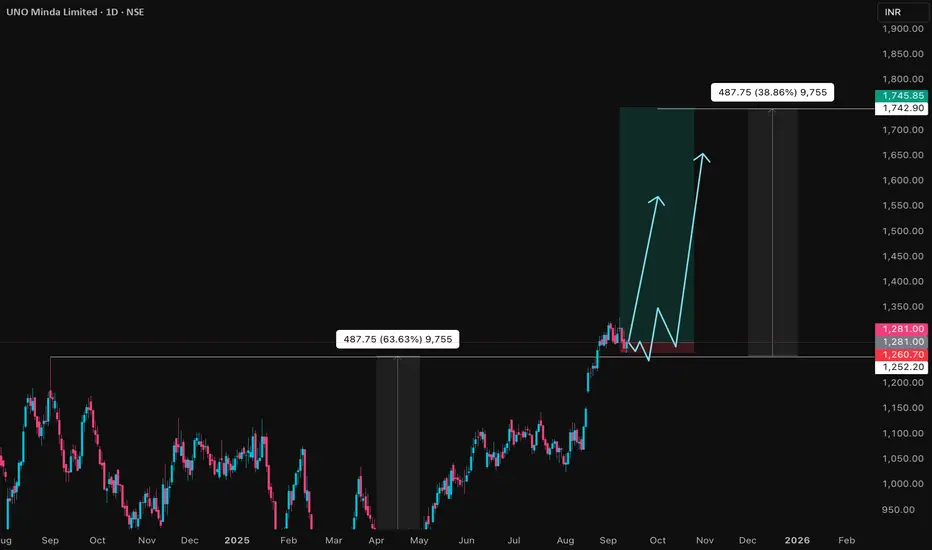
UNOMINDA Price ActionUNO Minda Ltd is trading at ₹1,282 as of September 12, 2025, delivering consistent financial and operational outperformance. For FY25, the company posted consolidated revenue of ₹16,775 crore, up 20% year-on-year, with net profit rising 9% to ₹936 crore. EBITDA grew 18% to ₹1,800 crore, and operating margins remain stable at 10.7%. Recent quarterly profit after tax is ₹289 crore, and EPS for the last twelve months stands at ₹13.97.
Expansion in premium switches, alloy wheels, lighting, sensors, sunroof products, and emerging EV technologies has bolstered top-line growth. Strategic projects—including new capacities for four-wheeler EV components and ADAS products—support a robust future pipeline, while strong cash flows enable ongoing fundraising and project commissioning.
Valuation remains at a premium to the sector, with trailing P/E around 79, price-to-book of 13, and price-to-sales ratio of 4.2, reflecting leadership in innovation and rapid growth. Return on capital employed is healthy at 15.7%, and debt remains modest, sustaining investor and institutional confidence. Technically, the stock is just below its 52-week high and continues to outperform broad market indices, maintaining an upward momentum trend.
Promoter and institutional holding are stable, affirming long-term commitment, and a final dividend of ₹1.50 per share was declared for FY25, rewarding shareholders alongside growth investments. UNO Minda’s medium- and long-term outlook remains highly constructive, anchored by strong financials, prudent capital allocation, innovative leadership, and a resilient growth trajectory.
HCG Price ActionHealthcare Global Enterprises Ltd (HCG) is trading near ₹690 as of September 11, 2025. The stock opened at ₹692, touched a high of ₹696, and a low of ₹667 during the session. Market capitalization is about ₹9,700 crore, with relatively strong volumes and current price action near year-to-date highs. Over the past year, the share has rallied from a low of ₹398 to as high as ₹708, reflecting a rapid uptrend.
Valuation metrics are elevated, with a trailing P/E ratio of 261 and P/B ratio of 10.7, much above the sector medians, reflecting market optimism for future expansion. The company’s annual revenues continue to grow, supported by increased occupancy and expanded hospital networks. Operating profit margin remains strong at 17%, while recent annualized EPS is ₹2.66. Though profit growth has been solid over the last few years, returns on equity and capital employed remain moderate, and promoters have decreased their shareholding with a high proportion pledged.
Technically, HCG trades well above its 50-day and 200-day moving averages and the 14-day RSI sits at 68, showing positive momentum but approaching overbought territory. The stock has no dividend payout history and continues to use profits to fund growth and operational expansion. Overall outlook remains constructive, contingent on continued sector demand and successful network scaling, though valuation risks and promoter pledges merit attention.

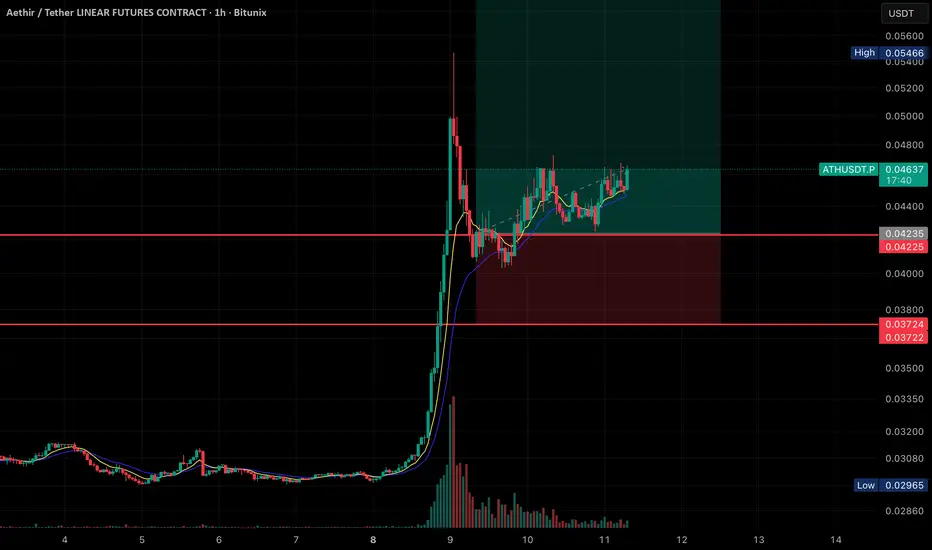
ATH/USDT Going for ATHHere’s the breakdown of what’s shown:
• Price Action:
The chart shows a massive spike in price on September 8th, followed by a retracement and consolidation phase.
Currently, the price is trading at 0.04634 USDT, with slight bullish movement (+1.58%).
• Indicators:
• Moving averages (likely EMA 9 & 21) are plotted, and the price is staying above them, showing bullish support.
• Volume spiked heavily during the breakout and has since decreased while consolidation is happening.
• Trade Setup (Highlighted Zone):
• Entry: Around the current price (0.0463 USDT).
• Stop Loss: Just below 0.0422–0.0423 support zone.
• Target Zone: Extends upward past 0.054 (previous high), indicating a long trade setup with a good risk-to-reward ratio.
• Support & Resistance:
• Support 1: 0.04225 – 0.04235
• Support 2: 0.03722 – 0.03724
• Resistance: 0.05466 (recent swing high)
👉 Overall, this looks like a bullish continuation setup after a breakout, with price consolidating in a higher range before a possible push toward the recent highs
OLAELEC Price ActionOla Electric Mobility Ltd is trading around ₹58.34 as of September 10, 2025. The stock has fluctuated between ₹57.40 and ₹60.79 through the session, with a previous close of ₹59.83. Market capitalization is approximately ₹25,700 crore. The share price has faced significant volatility, falling from a 52-week high of ₹123.90 down to a low of ₹39.60, and remains well below its all-time high.
Financially, Ola Electric continues to operate at a loss, reporting a negative trailing twelve-month EPS of -₹5.34 and an ROE of -108%, indicating unprofitable operations despite firm topline revenue. Annual net sales for FY25 are ₹4,514 crore, but operating profit and net profit remain negative due to heavy ongoing investments and interest expenses.
Key metrics on the balance sheet highlight low leverage (debt-to-equity ratio of 0.59) and a book value per share of ₹14.90, but the stock trades at 3.92 times its book value, indicating that valuation is stretched relative to fundamentals. No dividend has been declared, and recent large block stake sales from major investors have caused additional price swings.
Technically, Ola Electric is trading near its 20-day VWAP and remains highly liquid, with daily average trading volumes above 30 million shares. Momentum is subdued, and the near-term price action suggests more downside risk if selling pressure persists, with support seen near ₹55 and resistance close to ₹62. The outlook depends on the company’s ability to reverse losses and capitalize on India’s EV market growth amid challenging competitive and financial conditions.

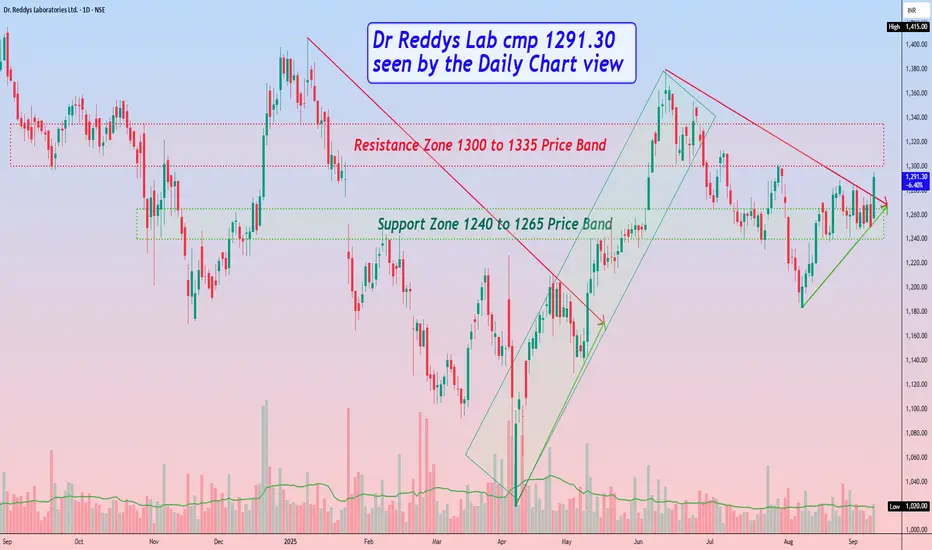
Dr Reddys Lab cmp 1291.30 by Daily Chart viewDr Reddys Lab cmp 1291.30 by Daily Chart view
- Support Zone 1240 to 1265 Price Band
- Resistance Zone 1300 to 1335 Price Band
- Breakout from Falling Resistance Trendline
- Bullish Rising Price Channel with intermittent highs and lows
- Recent history repeating by Breakout from Falling Resistance Trendline
- *Will we see a repeat Bullish Rising Price Channel with intermittent highs and lows*
WABAG Price ActionVA Tech Wabag Limited (WABAG) is trading at approximately ₹1,523 as of today, showing a slight positive movement with prices fluctuating between ₹1,502 and ₹1,527. The stock has a market capitalization nearing ₹9,477 crore and is positioned within a yearly price range of ₹1,109 to ₹1,944.
The company demonstrates robust financial health with an earnings per share of about ₹48.5 and a price-to-earnings ratio near 31.4, reflecting reasonable valuations considering its sector and growth potential. The stock price is closely aligned with its 50-day and 200-day moving averages, indicating a steady trend with balanced momentum.
Trading volumes are moderate with consistent investor interest, supported by continued investments in water infrastructure solutions and sustainable technologies. Overall, the outlook for WABAG remains positive, backed by its stable financials, solid project pipeline, and positioning in the growing water management sector.

RAINBOW Price ActionRainbow Children's Medicare Ltd is trading around ₹1,482 as of September 9, 2025, with the stock showing steady strength after a strong year for both price and operational performance. Market capitalization stands near ₹15,000 crore, and the stock remains close to the upper bound of its yearly range, which spans a 52-week high of ₹1,710 and low of ₹1,206.
Annual revenue is reported above ₹1,500 crore, backed by robust patient flow and expansion of specialty pediatric healthcare services across India. Net profit for the latest twelve months is ₹258 crore, with a profit margin of 32%. Return on equity is nearly 17.4%, with the company maintaining high efficiency in capital utilization and asset management.
The price-to-earnings ratio stands around 58.5, indicating expectations for future earnings growth compared to the sector. Working capital requirements have dropped substantially, signaling improved operational discipline. Promoter holding remains strong, and dividend yield is modest at 0.2%. Technical indicators reflect continued uptrend and strong support at current levels, with momentum and volume both favoring positive sentiment.
Rainbow's healthy financials, steady expansion, and strong management outlook point toward sustained performance, with upside potential driven by sector growth and ongoing geographic expansion.

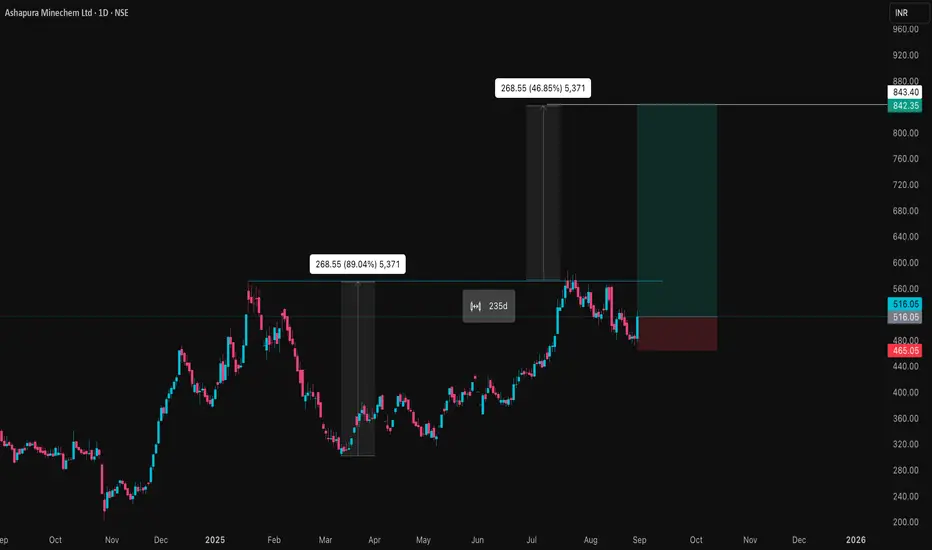
ASHAPURMIN Price ActionAshapura Minechem’s share price as of August 31, 2025, is trading near ₹514, continuing a strong uptrend that has seen a remarkable rise of nearly 49% in the past six months. The stock has moved from a 52-week low around ₹200 to a high of ₹587, driven by exceptional financial results and robust business momentum in both domestic mineral solutions and bauxite exports from Guinea.
Recently reported quarterly results show income from operations of over ₹1,355 crore and profit before tax of about ₹132 crore, up more than 100% year-on-year. Net profit and earnings per share have also seen healthy growth, and the company’s operating profit to interest ratio has hit a five-quarter high, indicating improved ability to manage debt. The debt-equity ratio is now under one, further signaling financial stability.
Valuation remains attractive with a price-to-earnings ratio of approximately 14 and a price-to-book ratio of just 0.25, suggesting there could be further room for appreciation if growth sustains. Technical signals remain bullish as the stock continues to trade above major moving averages, with strong volume supporting recent price action. Overall, Ashapura Minechem combines solid fundamentals and a positive growth outlook, appealing to investors looking for small-cap mineral sector exposure.
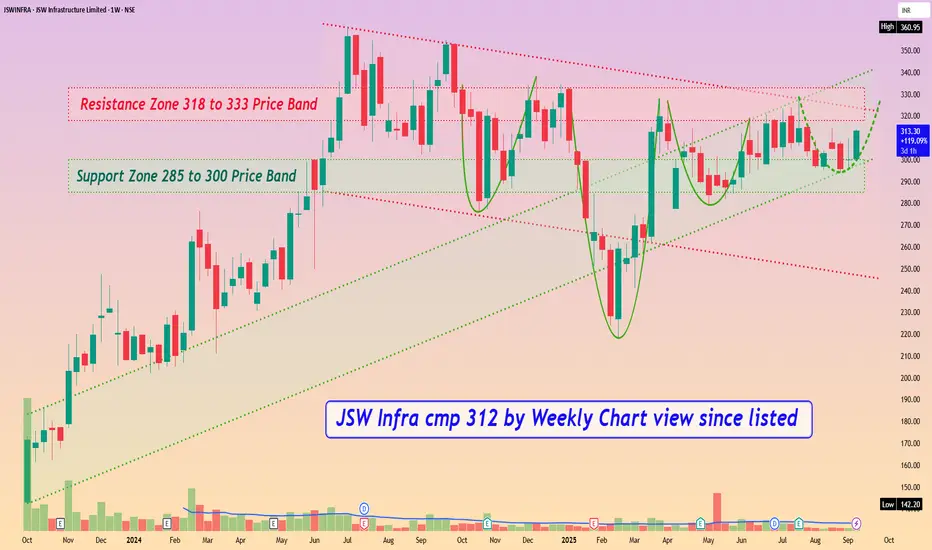
JSW Infra cmp 312 by Weekly Chart view since listedJSW Infra cmp 312 by Weekly Chart view since listed
- Support Zone 285 to 300 Price Band
- Resistance Zone 318 to 333 Price Band
- Bullish Rounding Bottoms repeated under the Resistance Zone neckline
- Stock making Higher High Lower High pattern within up-trending price channel momentum
- Stock traversing within Rising Support + Price Channel and attempting Falling Resistance + Price Channel Breakout
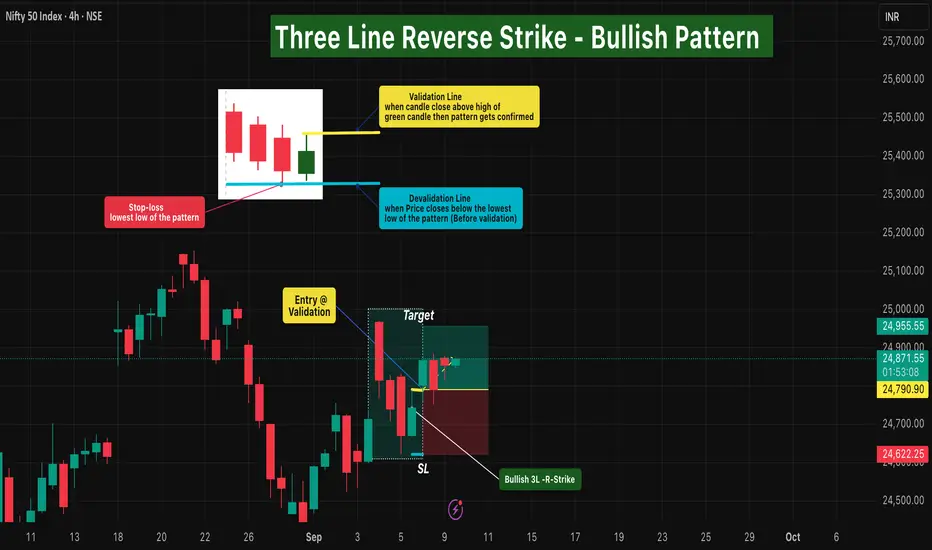
Three Line Reverse Strike - Bullish Pattern (NIFTY-4H)🔹 Intro / Overview
The Three-Line Reverse Strike (Bullish Pattern) is a rare yet powerful reversal setup.
It forms when three consecutive strong bearish candles 🟥 🟥 🟥 are immediately followed by a strong bullish candle 🟩
This sudden shift shows sellers losing control and buyers stepping in with conviction.
“3 Bears fall… 1 Bull strikes back stronger 🐂"
___________________________________________________________
📖 How to Use
✅ Validation Line → High of the Bullish candle.
❌ Devalidation Line → Lowest Low of the entire 4-candle pattern(Before Validation).
- Entry → Confirmed when any current candle closes above the Validation line.
- Stop-Loss → Lowest Low of the pattern.
- Target → 1x the stop-loss distance.
- Trailing → Remaining lots can be managed using ATR, Fibonacci levels, Box Trailing, or swing structure for extended upside.
____________________________________________________________
🎯 Trading Plan(educational only)
Entry → On close above Validation line (Bullish High).
Stop Loss → Lowest Low of the pattern.
Target → First TP at 1R (Entry–SL distance).
Remaining lots → Trail with volatility tools to capture extended trends.
____________________________________________________________
📊 Chart Explanation
- This is a positional setup 🕰️:
- 3️⃣ Strong Bearish candles show seller dominance.
- 1️⃣ Strong Bullish candle reverses momentum and forms the setup.
- Validation → High of the Bullish candle.
- Devalidation → Lowest Low of the (3 Bearish + 1 Bullish) sequence.
-Lowest Low ⛔, Target = 1R 🎯, trailing for extended move 🚀.
____________________________________________________________
👀 Observation
- Most effective after prolonged downtrends or near support zones.
- Works best with confirmation from volume and EMA trend filters.
- Provides a clear visual shift from bearish momentum to bullish reversal.
____________________________________________________________
❗ Why It Matters?
- Shows sellers exhausting after consecutive pressure.
- Buyers step in aggressively with a strong bullish candle.
- Gives a structured entry, SL, and TP framework.
- Reduces noise by relying on a clear multi-candle sequence.
____________________________________________________________
🎯 Conclusion
The Three-Line Reverse Strike – Bullish Pattern highlights a powerful momentum shift.
By applying strict Validation, Devalidation, and disciplined stop-loss rules, traders can capture strong reversals while limiting risk.
🔥 Patterns don’t predict. Rules protect.
____________________________________________________________
⚠️ Disclaimer
📘 For educational purposes only.
🙅 Not SEBI registered.
❌ Not a buy/sell recommendation.
🧠 Purely a learning resource.
📊 Not Financial Advice.
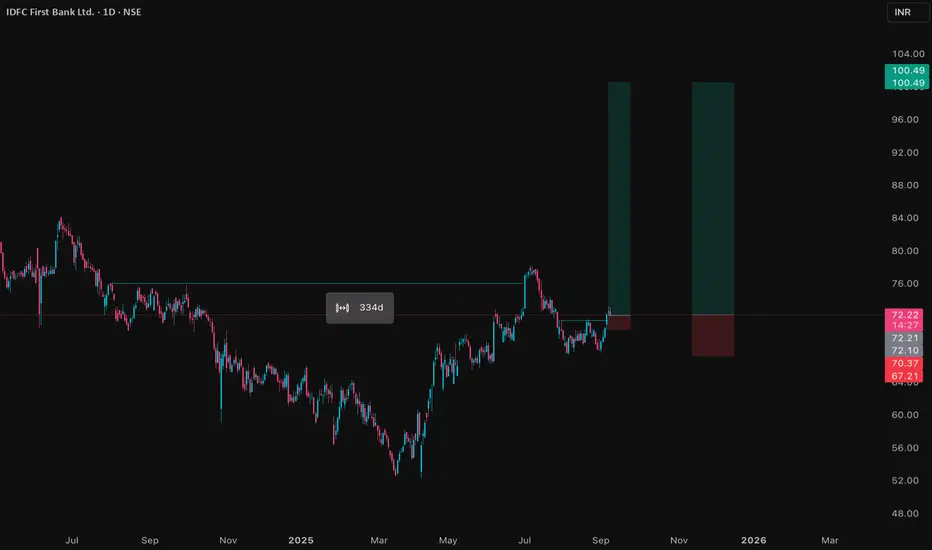
IDFCFIRSTB Price ActionIDFC First Bank is trading at ₹72.60 as of September 8, 2025, and maintains a solid presence in India’s private banking sector. The stock has a market capitalization near ₹53,264 crore, having seen an 8.7% gain over the last three months and a 25% rise over six months, while its year-on-year change is slightly negative. The share price is just below its 52-week high of ₹78.50, reflecting mild short-term consolidation after recent rallies.
Financially, IDFC First Bank continues to deliver growth: its annual operating revenue for FY25 approached ₹36,500 crore. Net interest margin remains strong at 5.6%, and the bank’s gross NPA ratio has declined to 1.87%, with net NPA at 0.53%, representing improved asset quality. Net profit for the previous year edged higher, and the latest quarter saw stable promoter holdings, a minor uptick in DII ownership, and balanced institutional participation.
The valuation remains elevated, with a price-to-earnings ratio of 40.78 and price-to-book near 1.4, as the market is factoring in future growth from retail advances, digital initiatives, and improving cost efficiencies. Technical indicators show the share trading above 50-day and 200-day averages, confirming ongoing bullish sentiment, and weekly stochastics point to strong price momentum. Dividend yield is modest but consistent, as the bank prioritizes growth and capital buffers.
Overall, IDFC First Bank offers a constructive outlook thanks to ongoing improvements in profitability, asset quality, and operational metrics. The bank is well-positioned for further gains if trends in retail lending, fee income, and digital channels remain favorable.