HFCL BY KRS CHARTS17th September 2025 / 9:21 AM
Why HFCL?
1. First of all, its second time it's in my radar, previously we had more than 40% Return on this one and still long-term Target has been still loading 225 Rs.
2. 1M TF is making Higher High with current price level previously it breaks from flag pattern and gave upside move.
3. As we cand see in chart i have mentioned FVG range for 1M tf which was expected fall to be fill that FVG and it did.
4. Further, along with FVG filling 1W & 1D tfs is showing bullish divergence within range.
5. Volume is above avg with Morning Star Candle Breakout showing more bullish signs.
SL & Target is mentioned ‼️
** Attached Previous View on HFCL also go check it out**
Buy!!

Gold Strengthening as Bullish Structure FormsOANDA:XAUUSD is beginning to present a noticeably stronger bullish tone as the underlying price structure shifts upward.
The most recent market interaction is particularly noteworthy as an early recovery phase has emerged, bearish momentum has weakened, and a series of low-volume candles highlights clear seller exhaustion. These characteristics often signal the early stages of a new bullish movement.
From the current structure, my upside target remains the 4,330 region, a logical and well-aligned level within this developing trend. If price continues to build on this momentum, the next leg could become a clean and convincing extension of the broader bullish narrative we have been following on Gold.
This setup stands out as highly compelling. The story is unfolding, yet it still requires patience and a confirmed signal to validate the upward potential.
Although a deeper pullback cannot be completely ruled out due to the defined support zone below, I continue to favor bullish continuation as the forming structure clearly supports the upside scenario.
Wishing you a strong and profitable trading session.

Gold’s Next Move: 4,350 Within Reach – Are You Ready?Hello everyone, it's Luiss_Miguel here!
Gold is looking pretty interesting right now. As mentioned in the previous analysis, the price has shot up. But guess what? Right now, it's slightly pulling back, moving in the opposite direction to the previous uptrend, which looks like a familiar bullish flag pattern. In this case, there’s only one scenario that could play out, and when the price breaks out from the top of the bullish flag, it’s usually a buy signal, and the price could continue to rise.
My target is 4,350.
Do you agree? Leave a comment below. Joining the TradingView community is always helpful to improve and develop your trading skills.

Bullish Structure Locked In — Gold Eyes 4,405Hello everyone, this is Luiss_Miguel!
At the moment, XAUUSD is a textbook example of a market moving within a well-defined ascending channel, with price consistently respecting both the upper and lower boundaries of the structure.
Recently, we observed a clear breakout above a key resistance zone, followed by a high-quality retest. This area aligns perfectly with the Golden Pocket of the previous bullish leg, making it a highly significant level to watch.
If this zone continues to hold as support, it would provide a strong structural confirmation of the bullish trend, increasing the likelihood of price extending toward 4,405, which represents the upper boundary of the channel.
As long as price remains above this supportive region, the bullish scenario remains intact. However, if price dips below it, short-term bullish momentum could weaken, potentially opening the door to a deeper corrective move.
Always remember to apply strict risk management to protect your capital.
Wishing you all the best — and trade wisely.

XAUUSD: The Bullish Pennant That Could Trigger the Next RallyHello everyone, what is your take on XAUUSD right now?
The 2 hour chart is becoming quite interesting. Price action is shaping a clean bullish pennant, a pattern that often suggests the market is building pressure for its next major move. After completing its corrective pullback, XAUUSD is beginning to show signs that buyers may be preparing to re-enter and push the trend higher again.
If momentum returns, my outlook targets a break above 4265, followed by an extension toward 4430. This zone aligns perfectly with the Fibonacci 1.618 projection, which adds strong confluence to the bullish scenario.
Share your thoughts and your targets in the comments. I would love to hear how you are interpreting this setup.

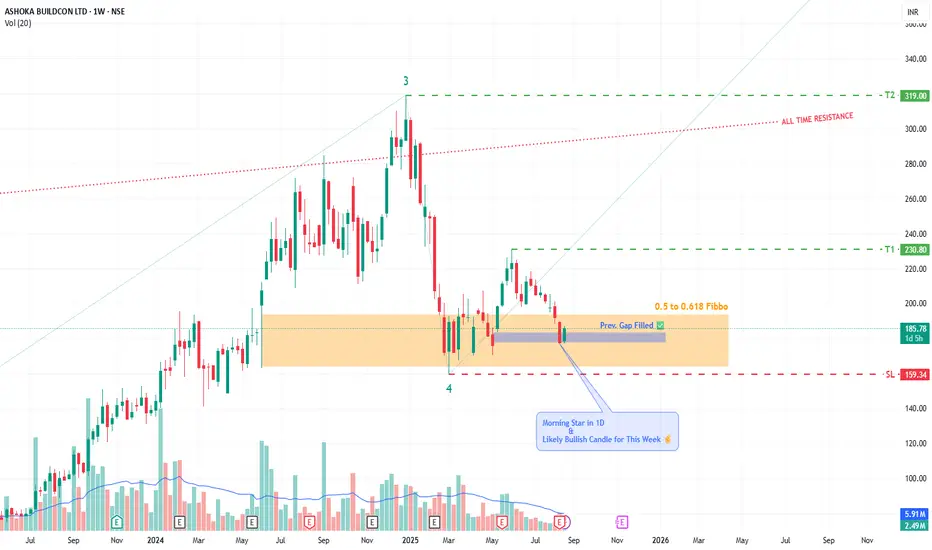
VIEW ON ASHOKA BUILDCON BY KRS CHARTSDate - 21st August 2025 / 10:35 AM
Why ASHOKA ?
1. All-time Bullish Stock technically making HHs & HLs.
2. Further, Price is already in Fibbo Golden Reversal Zone for quite a few times and showing bullish traits again.
3. I was eagerly waiting for to retrace down little bit for 1D previous gap-up needed to be filled it & it's Done!
4. 1D it is showing Morning Star Candle sticks Cluster s with more green Candles and this week likely to be closing with bullish candle stick.
5. Wave Theory wise we are in 4th Wave last upside 5th is loading.
All in All, this is good level to look ASHOKA as a good opportunity 👍✅
Targets and SL are Marked in Chart.
XAUUSD is skyrocketing after the Adam & Eve pattern!OANDA:XAUUSD is really interesting right now. The price seems likely to rise further after the formation of the Adam & Eve pattern. With such an easy-to-remember name, the Adam & Eve pattern is one of the most memorable. Below, I’ll explain the reasons and how to easily recognize it.
The Adam pattern is characterized by a sharp drop, followed by a quick recovery, forming a "V" on the chart. High, sharp, and aggressive! You could say it's more "masculine."
On the other hand, the Eve pattern develops more slowly. The price becomes more rounded, forming a wider and smoother base before rising again, creating a shape similar to the letter "U." Softer, more curved, and more "feminine."
Combining these two elements gives us the Adam & Eve pattern, which often signals a potential trend reversal. Especially when accompanied by fundamental analysis or other strong technical indicators.
This pattern will stick in your mind when you connect its shapes to the male and female aspects. A pattern that's truly hard to forget.

CADJPY could keep rising furtherOANDA:CADJPY The market has been on a clear upward trajectory for some time, with each swing reaching higher peaks and forming higher lows. The rising trendline has been the driving force behind this momentum.
Following the recent surge, the price has pulled back slightly, forming a textbook bullish flag pattern.
This is the kind of price action you want to see in a strong uptrend—a controlled retracement with a minor dip, without any aggressive selling pressure.
The bears have failed to break the low, and the bullish momentum remains intact. As a result, the overall trend continues to hold steady.
Right now, the price is breaking out of the flag pattern, and it looks like this trend is poised to continue.
As long as the price stays above the trendline and doesn’t breach the flag's low, my outlook remains bullish.
My target is set at 113.150.

XAUUSD Outlook: Recent Gains Have Been Quite Steady!The market outlook for XAUUSD remains clearly optimistic. The latest price movement has shown a steady recovery, pushing towards the upper boundary of the newly forecasted price channel. This presents another excellent opportunity to get involved.
The market may be in the early stages of a strong new bullish leg. We could also see some consolidation or a short-term pullback before continuing towards the upper boundary, but I believe the second scenario is more likely.
My target would be 4,350.

A Short Gold Sell Opportunity You Can't MissLooking at the chart, gold continues to move steadily within a clear downtrend channel, with each peak and trough forming progressively lower levels over time. Currently, the price is approaching the upper boundary of the channel and interacting with the same resistance area where sellers have stepped in multiple times before, forcing the market to reverse. This behavior strongly indicates that the potential for a continued corrective move downward, in line with the main trend, remains intact.
With this in mind, I believe a price decline toward the 4,080 level is a reasonable and logical target for the current correction. As long as the price hasn’t clearly broken through the upper boundary of the channel, I will continue to favor the scenario where the bearish trend remains dominant, viewing any upward movement as a mere pullback within the overall structure.
This is not financial advice, but simply my personal perspective based on the current price action.

Gold Trading Strategy for 500 Pips!Hey traders,
As we roll into a brand-new week, gold is showing some impressive stability. XAUUSD is hanging right around the 4,050-dollar mark, and despite the quiet price action, there’s a lot happening beneath the surface that’s worth paying attention to.
The market right now is in “wait-and-see” mode as everyone watches the Federal Reserve’s next moves. Over the past few days, expectations have started to shift—more traders believe the Fed may slowly pivot toward a softer stance and potentially move closer to cutting rates by the end of the year. Because of that, bond yields have been drifting lower, the dollar is losing some of its strength, and demand for safe-haven assets like gold is starting to rise again. All of these elements together create a strong backdrop for potential upside in the short term.
On the technical side, XAUUSD is tightening inside a clean triangle structure, and for those who follow price action closely, you know what that usually means: the market is building pressure. When price consolidates this way, it often sets the stage for a strong breakout. If buyers can push through the upper boundary of this triangle, the next logical target sits up near the 4,500-dollar zone — right in line with the momentum we saw during the last bullish move.
How about you? What’s your take on this setup? Are you leaning toward another leg up, or do you think the market is prepping for a pullback first?
Wishing you a great week of trading—focused, confident, and full of solid opportunities.

Gold at a Crossroads: Up or Down?If we zoom in and carefully observe how the GOLD price is moving, it becomes immediately clear:
The market has just shown a very strong upward impulse, but now something interesting is happening. The price is tightening and forming a small, narrow triangle, which indicates that the market is accumulating energy. In these situations, there are usually two possible directions, but given the clearly bullish context, I feel that a breakout to the upside is much more likely.
What do you think? Do you agree with me?
Leave your thoughts in the comments. And trust me, being part of the TradingView community will help you improve every day as a trader.
Of course, this is not financial advice, just my personal view on the chart.

The Gold Bullish Setup You Can't Miss!OANDA:XAUUSD The price is clearly approaching a critical support zone, one that has previously triggered positive reactions in the market. This zone also aligns closely with the psychological level of $4,000, which tends to capture the market’s full attention.
Given the current momentum, there’s a strong possibility that buyers will step in and push prices higher. A confirmation, such as a solid rejection pattern, a bullish engulfing candle, or a long lower shadow, would significantly increase the likelihood of a rebound. If my analysis proves accurate, and buyers regain control, we could see the price rise to around $4,070.
However, if the price breaks below this key support, it would negate the bullish outlook and could lead to further declines.
Please note, this is not financial advice!

Cup and Handle Detected: A Bullish Outlook for XAUUSDOANDA:XAUUSD is forming a very clear Cup and Handle pattern. Price previously dropped toward the 4000 region, rounded out, and then climbed back toward 4080, completing the cup structure. At the moment, the market is making a mild pullback and shaping a tight and well controlled handle.
If price can break this resistance with strong momentum, the next target I expect is around 4150. Until a confirmed breakout appears, patience remains essential. No breakout means no trade.
This is a classic bullish formation, and market expectations are gradually strengthening.

XAUUSD: Likely continuation following pullbackXAUUSD has surged into a strong uptrend, and I predict that this momentum will continue, with a potential target around 4,150, as shown on my chart.
The current price level may be a critical turning point. Here, the price could find support and continue to rise, or if it breaks below, we might see an extension of the downward trend.
If I had to choose a direction, I would lean towards more upside, but the final decision should be based on price action to determine the next move.
However, if the price breaks decisively below the trendline, it would invalidate the bullish scenario, indicating that the uptrend could pause or even reverse in the short term.
These are just my personal views based on chart analysis, not financial advice. Always verify your setups and manage your risk carefully.

XAUUSD Double Bull Flag — Danger AheadHello my dear traders, Laura here.
This week, the market has been extremely tense, and the price action reflects it well.
As I mentioned before, we are currently seeing the formation of a large bull flag. Just above it, a smaller flag is developing, and this smaller structure is the key trigger for any potential continuation. The bullish outlook remains valid only if this smaller flag breaks cleanly.
The recent pullback dipped deeper than expected, which signals hesitation from buyers. When confidence fades, even a promising breakout can turn into a sweet trap that lifts briefly before falling sharply.
Because of this, patience becomes essential. Before entering, we need a clear and decisive breakout that confirms strength. Specifically, we should look for a candle that breaks through resistance with firmness and clarity. If such a confirmation appears, the path toward the 4,300 level becomes structurally supported.
On the other hand, if the price falls below the lower trendline, the bullish scenario is invalidated immediately. At that point, the setup no longer holds and should not be traded.
For now, the principle is straightforward.
No breakout means no entry. Stay disciplined and avoid letting the market pull you into unnecessary risk.

XAUUSD: Continuing Uptrend with Potential Expansion to $4,280OANDA:XAUUSD has shown strong performance in the ascending channel, and I expect this trend to continue as shown in my chart, with a target price of $4,280.
The current area represents a key turning point, where prices could find support allowing them to rise, or they may break down, which could lead to a further downward movement.
If I were to choose the most likely direction, I would lean towards upward price movement. However, only market action will determine whether the channel will continue or not.
If the downtrend line is breached strongly, it will invalidate the bullish scenario, meaning that the bullish momentum could weaken or even reverse in the short term.
These are just my personal forecasts based on technical analysis, and they do not represent financial advice. Always make sure to verify your setups and manage risks wisely.
Wishing you successful and profitable trading!

EUR/USD – Growth Opportunity After Positive DataThe EUR/USD pair is currently trading around 1.1612, up by 0.2% ahead of the September industrial production data from the Eurozone. This data is expected to show a 0.7% recovery for the month, following a sharp 1.2% decline the previous month. This is a positive signal for the Euro and could create a strong growth opportunity for EUR/USD.
Technical Analysis: The chart shows that EUR/USD is attempting to break the 1.16500 level, which indicates a test towards 1.16800 in the short term. If the pair continues to maintain this trend, it may break through strong resistance and target 1.17000. However, this may require additional support factors, such as weak data from the U.S. or more positive macroeconomic signals for the Euro.
Conclusion: With the factors from industrial production data and technical signals , I believe EUR/USD has the potential to continue increasing in the short term, but further confirmation from economic data is needed for a stronger breakout. If the price holds above 1.160 and breaks resistance, 1.170 will be the next realistic target.

XAUUSD – When the Market Starts to “Smell” a Bullish MoveLooking at the current price action, it’s quite clear that gold is entering a new bullish phase supported by both fundamental catalysts and smart money flow . With the U.S. government preparing to reopen and key economic data returning, investors are increasing their bets on the possibility that the Fed may cut interest rates next month . In a climate where political and economic uncertainty is still lingering, gold naturally becomes a preferred safe-haven asset.
On the chart, XAUUSD is maintaining a clean and steady uptrend , consistently bouncing from the trendline and forming higher highs and higher lows. These precise retests show that buyers are firmly in control . Price is now moving towards the 4,300 zone, where some short-term volatility may appear before heading further into the 4,380 resistance.
As long as gold holds above the trendline support , the market can continue its bullish momentum in the coming sessions. Every pullback at this stage acts like a fresh boost , giving buyers more strength to push the market higher.

Gold Holds Firm Near $4,180 as Markets Await Fed Signal Gold prices are holding steady around $4,184 per ounce, maintaining strong momentum after last week’s sharp rebound of nearly $250 from the $3,930 low. On the 4-hour chart, the uptrend remains intact with multiple Fair Value Gaps acting as key support zones. The nearest support is seen between $4,150–4,120, while resistance lies at $4,220–4,260.
According to Kitco and Reuters, the rally is largely supported by growing expectations that the Federal Reserve may cut rates in December, amid signs of a cooling U.S. economy. The reopening of the U.S. government after a 35-day shutdown means crucial data such as CPI, NFP, and GDP will soon be released — which could reinforce the market’s belief that a dovish shift is near.
Adding to the intrigue, the U.S. Supreme Court is set to review former President Donald Trump’s authority to dismiss Fed Governor Lisa Cook in early 2026. Analysts warn that if this threatens the Fed’s independence, it could trigger a sharp decline in the U.S. dollar and push gold up by as much as $500 per ounce.
Meanwhile, UBS forecasts global gold demand in 2025 could reach its highest level since 2011, as central banks continue increasing reserves. Heightened geopolitical risks — including the upcoming U.S. election in 2026, the Middle East conflict, and renewed U.S.–China trade tensions — are further strengthening gold’s appeal as a safe haven.
In the near term, gold could correct slightly towards $4,150–4,120 before resuming its advance towards $4,260. A decisive break above that level could open the path to $4,300–4,340. With a weakening dollar, potential rate cuts, and global uncertainty, gold appears well-positioned for the next medium-term bullish cycle.

XAUUSD Forms a Cup and Handle PatternOANDA:XAUUSD has been steadily rising, maintaining strong and consistent upward momentum. If you’ve been following my previous analyses, you’ll notice a familiar pattern developing on the chart — the classic Cup and Handle formation.
Looking closer, the left side of the chart reveals a strong supply zone, forming the cup. Then, we see the market building a potential handle on the right, indicating that the price is accumulating strength for the next move.
Now, here’s where things get interesting: if buying pressure aligns with Dow Theory waves and the Fibonacci retracement levels at 0.786 and 0.618 hold steady, with the price breaking through the neckline, this setup could push gold to 4500 USD.
However, if selling pressure comes in stronger than expected, the pattern may fail, and we could see a price pullback.

YES BANK BY KRS Charts2nd Sept 2025 / 10:01 AM
Why Yes Bank ?
1. last few years YES BANK is making HH & HLs in Monthly & Weekly TFs . It has potential technically, but will check our patience.
2. Above Chart it fills up all the FVGs - Fair Value Gaps and bounced back in Month of April. As we can see in Chart mentioned recently also same FVG reversal is visible.
3. Also Potential of Reversal chart pattern at bottom of trend is also visible.🤞
4. Less than 2 Rs Risk and Almost 5 Rs Reward is making this trade Safe 👍
5. Point to be noted 20.25 Rs is nearest Resistance and Pattern Target of 28 Rs unlock After breakout of neckline at 22 Rs.

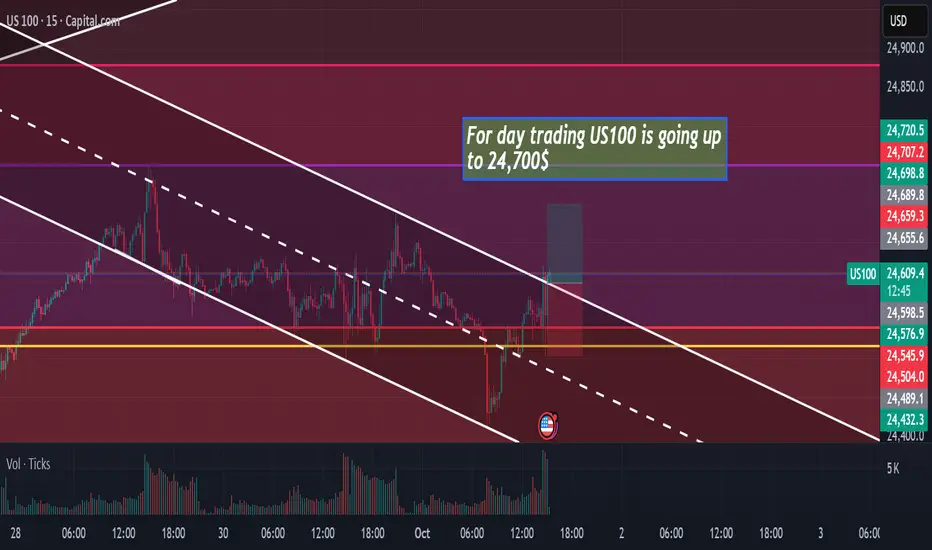
US100 is going UP TO 24,700$hello.
US100 is going up to 24,700$ in few minutes !! it's a buy opportunity on 15MIN time frame