XAUUSD Facing Downward PressureHello traders, XAUUSD is currently facing downward pressure following recent economic news. The lower-than-expected unemployment claims data suggests economic stability, reducing the demand for gold. The higher-than-expected PCE core index increases the likelihood that the Fed will maintain high interest rates, putting pressure on gold prices. While the US GDP remains stable , there is no strong breakthrough.
Technically, XAUUSD is in an uptrend but has encountered resistance at $3,790 . The price of gold is currently testing support at $3,700. If this level is broken, gold could fall to the $3,635 region.
Given the current fundamental and technical factors , the likelihood of XAUUSD continuing to decline is high. If support doesn't hold, gold could continue to drop.
Wishing you successful trading!
Buy!!

BTC/USD: Bearish Trend After Flash Crash and Key NewsThe BTC/USD chart shows a strong bearish trend following the "flash crash" event and contract liquidations. Currently, BTC is moving within a downward channel with support levels at 110,300 USD and 108,000 USD.
News Impact:
Morgan Stanley to Offer Crypto Trading: Morgan Stanley’s partnership with Zerohash to provide crypto trading on E*Trade could boost cryptocurrency acceptance, but it's not enough to reverse the bearish trend in BTC.
Fed Chairman Jerome Powell on Interest Rates: Jerome Powell's statements regarding the possibility of maintaining high interest rates have increased uncertainty, negatively impacting the cryptocurrency market.
Conclusion: The bearish trend of BTC/USD may continue. Traders should pay attention to support levels and stay updated with economic news to make informed trading decisions.

Gold Soars: Will a Weak USD Open the Door for New Highs?Hello traders, it’s clear that gold is rising sharply, supported by the weakening of the USD. Can gold continue to conquer new highs?
On the chart, the price is moving within a clear upward channel. The key support level at 3,750,000 has been tested multiple times, and if the price holds above this level, gold could continue rising towards 3,827,000. The areas near recent highs also show an increase in trading volume, reinforcing the bullish trend.
Forecasts indicate that the U.S. labor market is slowing down, with 233K jobs created, slightly higher than the previous 231K. This weakens the USD, creating an opportunity for gold to continue its rise, as gold typically benefits from a weaker USD.
With strong technicals and a weakening USD, XAU/USD could continue its upward momentum. Get ready for some exciting opportunities!

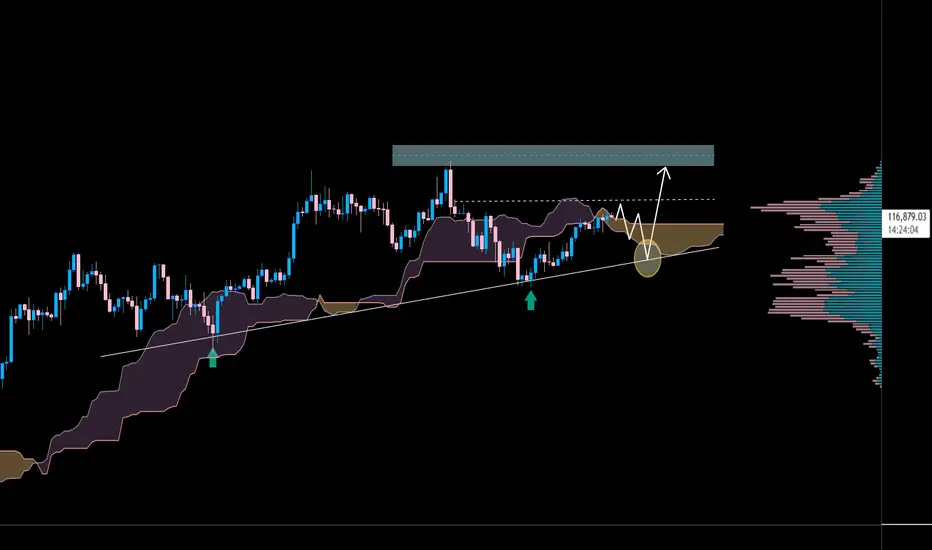
BTCUSDT Set to Explode: Strong Uptrend Ahead!Hello everyone, today we’ll analyze an exciting opportunity with BTCUSDT, evaluating its strong uptrend and the potential to reach new highs.
BTCUSDT is trading on a strong upward trendline , with support levels at 110,500 and a high target of 123,700. The chart shows a breakout from an important resistance zone, with the price also positioned above the Ichimoku cloud , reinforcing the bullish trend.
Capital inflows into Bitcoin ETFs and the Fed’s decision to cut interest rates have created a favorable environment for Bitcoin , making the possibility of reaching new highs even stronger.
With favorable technical signals and macroeconomic factors , BTCUSDT is likely to continue its strong upward movement. However, always check support levels to manage risk effectively.
Wishing you successful trading!
Gold Prices Continue to Rise Amid Rate Cuts and Geopolitical RisGold prices today are being strongly supported by growing expectations that the Federal Reserve (FED) will continue to cut interest rates and the increasing demand for safe-haven assets amid rising geopolitical instability.
Last week, the FED made its first rate cut of 0.25% since December, causing gold prices to surge. While some investors took profits, most experts believe the uptrend is not over yet.
This week, investor focus will be on the U.S. Personal Consumption Expenditures (PCE) data for August, the FED's preferred inflation measure, which may provide further clues about future rate cuts. Many forecasts predict a slowdown in core PCE, reinforcing the case for continued rate cuts by the FED.
Additionally, safe-haven flows are further supported by prolonged geopolitical risks, including the Russia-Ukraine conflict and concerns over economic impacts from U.S. tariffs.
Furthermore, strong gold buying activity from global central banks plays a crucial role in strengthening the bullish outlook for the precious metal.

XAU/USD: Sideway or Waiting for a Breakout?Hello traders, gold is currently in a clear sideways phase , moving within a narrow trading range between support at 3,652 USD and resistance at 3,700 USD. The chart shows that gold continues to fluctuate in this area without any signs of a strong breakout.
Although there is no major immediate news impact, the recent Fed rate cut has created a slight bullish bias for gold, as it continues to be viewed as a safe-haven asset in a low-interest-rate environment. This may support gold in holding within the current range, with a slight upside potential if price stays above the 3,652 USD support level.
If gold breaks above the 3,700 USD resistance , the uptrend could continue. However, if it breaks below current support levels , the market may see a correction. We need to monitor market signals closely to determine any trend shift.

XAUUSD: Sideway Trading Opportunity Before Further Decline?Hello, fellow traders! Today, we will analyze XAUUSD and identify a great trading opportunity in the sideway trend before gold could potentially continue its downward adjustment.
Yesterday, although the Fed cut interest rates to 4.25% as expected (4.25% compared to 4.50% previously) , the cut did not exceed expectations, reducing the outlook for further policy easing. The USD may no longer weaken , putting downward pressure on gold.
In addition, the unemployment claims data came in lower than forecast (231K vs. 241K) , indicating a strong labor market, which will support the USD. When the USD strengthens, gold typically faces downward pressure, meaning gold prices could fall further if the USD continues to strengthen.
Gold is facing strong resistance at 3,700 , showing signs of a decline. The 3,660 zone is a key rebound level, and if support at 3,600 is not broken, gold could trade sideways before continuing the downward trend. Low trading volume and flow of funds suggest that the sideway trend could continue in the short term.
Don’t forget, our trading strategy needs to be flexible, seizing opportunities, and never missing any market changes.

GOLD SHOWING A GOOD UP MOVE WITH 1:10 RISK REWARD GOLD SHOWING A GOOD UP MOVE WITH 1:10 RISK REWARD
DUE TO THESE REASON
A. its following a rectangle pattern that stocked the market
which preventing the market to move any one direction now it trying to break the strong resistant lable
B. after the break of this rectangle it will boost the market potential for break
C. also its resisting from a strong neckline the neckline also got weeker ald the price is ready to break in the outer region
all of these reason are indicating the same thing its ready for breakout BREAKOUT trading are follws good risk reward
please dont use more than one percentage of your capitalfollow risk reward and tradeing rules
that will help you to to become a bettertrader
thank you

XAUUSD Gold Trading Strategy September 15, 2025XAUUSD Gold Trading Strategy September 15, 2025: Weekly trend outlook, gold still has enough conditions for the possibility of continued price increases.
Basic news: After surpassing the 3670 USD/ounce mark, the highest level in history, the gold price has entered a correction phase, in the context of the market focusing on monitoring the policy moves of the US Federal Reserve (Fed). According to CME's FedWatch tool, investors are almost certain that the Fed will cut interest rates by 25 basis points, bringing the margin to 4 - 4.25%. However, the scenario of the Fed cutting 50 basis points is still considered, because this could cause the USD to plummet and push gold to skyrocket.
Technical analysis: The sideway range of 3600 - 3660 is still holding. Currently, we will wait for trading points at the 2 edges of the sideway range, but the priority is still mainly trading according to the trend.
Important price zones today: 3600 - 3605 and 3660 - 3665. Today's trading trend: Sideway.
Recommended orders:
Plan 1: BUY XAUUSD zone 3600 - 3602
SL 3597
TP 3605 - 3615 - 3635 - 3665 - OPEN.
Plan 2: BUY XAUUSD zone 3618 - 3620
SL 3615
TP 3623 - 3630 - 3650 - 3665.
Plan 3: SELL XAUUSD zone 3663 - 3665
SL 3668
TP 3660 - 3650 - 3640 - 3630 (small volume).
Wish you a new week of safe, effective and profitable trading.🥰🥰🥰🥰🥰

XAUUSD Gold Trading Strategy September 12, 2025XAUUSD Gold Trading Strategy September 12, 2025: Gold rebounded strongly, fully supported by US economic data and trend technical conditions.
Fundamental news: On Thursday (September 11) in the New York trading session, gold prices fluctuated strongly due to the influence of the US CPI index and initial data on unemployment claims. Gold prices recovered strongly in today's Asian session and are currently trading at $3,650/oz.
Technical analysis: Gold prices increased sharply after the CPI news was released. Currently, gold prices have increased sharply but are still fluctuating in the 3,600 - 3,660 range and there are no signs of a breakout. We still prioritize trading according to the main trend and waiting for trading at the confluence of MA and FVG.
Important price zones today: 3635 - 3640, 3600 - 3605 and 3660 - 3665.
Today's trading trend: BUY.
Recommended orders:
Plan 1: BUY XAUUSD zone 3635 - 3637
SL 3632
TP 3640 - 3650 - 3660 - 3690.
Plan 2: BUY XAUUSD zone 3600 - 3602
SL 3597
TP 3605 - 3615 - 3635 - 3665 - OPEN.
Plan 3: SELL XAUUSD zone 3663 - 3665
SL 3668
TP 3660 - 3650 - 3640 - 3630. (small volume).
Wish you a successful, effective and profitable weekend trading day.🌟🌟🌟🌟🌟

Gold Breaks Out: Rising Buying Power Amid USD WeaknessMarket Context:
The higher-than-expected Unemployment Claims data (263K vs 235K) has weakened the USD, providing favorable conditions for gold to rise. The University of Michigan Consumer Sentiment and Inflation Expectations remain stable, but they do not significantly impact gold’s trend.
XAUUSD is showing a strong upward trend, with gold trading within a solid ascending channel. The support at 3,615.000 USD has been tested and confirmed, providing a stable foundation for further gains. After breaking the 3,650.000 USD resistance, gold has the potential to continue its breakout towards 3,700.000 USD, supported by strong buying sentiment and technical indicators backing the bullish trend.
We continue to see strong investor preference for gold as the USD weakens, especially amid expectations of economic stability.

XAUUSD Gold Trading Strategy September 10, 2025XAUUSD Gold Trading Strategy September 10, 2025: Gold stabilized after falling from yesterday's new high, the market will focus on US inflation data in the final period of the week from today.
Fundamental news: Investors will now turn their attention to US inflation data, scheduled for release on Wednesday and Thursday. Inflation data will be of particular interest following weak employment data ahead of the Federal Reserve's monetary policy announcement next week.
Technical analysis: After gold prices made a new all-time high at $3,675/ounce, prices corrected to the 362x area and increased again as we predicted earlier. The MA lines still maintain support for the price, however, yesterday's correction has reduced the previous strong increase. We continue to trade according to the main trend: waiting for a trading point at the support area combined between MA and FVG. In addition, the next profit-taking phase may occur unexpectedly, to avoid this risk we must ensure to maintain the trading principle.
Important price zones today: 3615 - 3620, 3595 - 3600 and 3660 - 3665.
Today's trading trend: BUY.
Recommended orders:
Plan 1: BUY XAUUSD zone 3615 - 3617
SL 3612
TP 3620 - 3630 - 3650 - 3660.
Plan 2: BUY XAUUSD zone 3595 - 3597
SL 3592
TP 3600 - 3610 - 3630 - 3660.
Plan 3: SELL XAUUSD zone 3663 - 3365
SL 3668
TP 3660 - 3650 - 3630 - 3600. (small volume).
Wish you a safe, effective and profitable trading day.💯💯💯💯💯

XAUUSD: Breaking Through ResistanceXAUUSD is currently trading within a clear uptrend channel, with strong support at 3,620. The 1-hour chart shows that gold has bounced strongly from this support level, confirming that the uptrend remains intact. With support from EMA 34 and EMA 89, XAUUSD is likely to continue its upward momentum and target higher levels.
The current uptrend channel shows the price is moving within a clearly defined range, with higher lows consecutively forming. The next resistance is at 3,680, and if gold breaks through this level, it could extend its rise toward higher targets. The 3,620 level remains a crucial support, and as long as the price stays above this level, the chances of further increases are high.
Impact of News
With the forecasted PPI dropping from 0.9% to 0.3%, this could reduce inflation expectations and weaken the USD, providing favorable conditions for gold to continue rising.

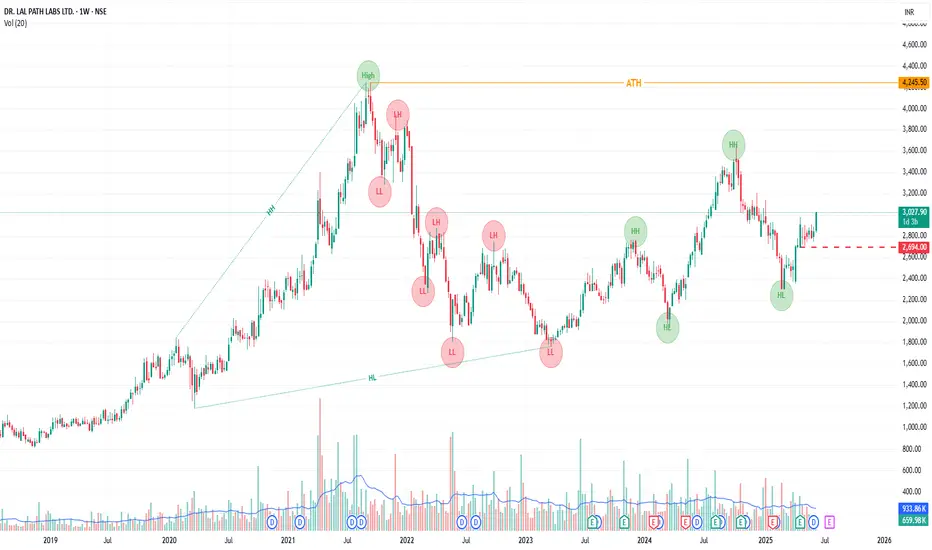
LALPATHLAB By KRS Charts12th June 2025 / 12:44
Why LALPATHLAB?
1. Fundamentals are good company's figures are stable and giving Dividends too.
2. Technically, All Time Bullish Stock making Higher Highs and H.Low.
3. Today in 1D timeframe it broke neckline of invt. Head & Shoulder chart pattern.
4. NSE:CNXPHARMA is also looking good which is one more reason to be bullish on one of a good company.
Targets will be New High Point 3750+ Rs.
SL is mentioned in Chart.
USD/JPY(202509008Today's AnalysisMarket News:
Non-farm payroll growth fell significantly short of expectations, with June's data revised downward to negative territory, marking the first contraction since 2020. The unemployment rate hit a nearly four-year high.
Technical Analysis:
Today's buy/sell levels:
147.57
Support and resistance levels:
149.28
148.64
148.23
146.92
146.51
145.87
Trading Strategy:
On a breakout above 148.23, consider a buy entry, with the first target price being 148.64.
On a breakout below 147.57, consider a sell entry, with the first target price being 146.92

Gold Trading Strategy XAUUSD September 5, 2025Gold Trading Strategy XAUUSD September 5, 2025: Gold rebounds after correction, market eyes on NFP data and Donald Trump's surprise statement for the week.
Fundamentals: Spot gold prices experienced extreme volatility on Thursday, with intraday swings reaching $53 before closing lower, currently trading at $3,557/oz, representing a gain of about $11 on the day. Gold's slight decline also reflects traders taking profits from the recent incredible rally. Investor focus now shifts to today's Non-Farm Payrolls report, which is expected to provide clues on the Federal Reserve's policy direction.
Technical analysis: Yesterday's strong decline showed investors' short-term profit-taking, but the current gold price is still trading above 3500. We continue to trade according to the main trend, waiting for support areas for long-term trading.
Important price zones today: 3525 - 3520 and 3495- 3500.
Today's trading trend: BUY.
Recommended orders:
Plan 1: BUY XAUUSD zone 3515 - 3517
SL 3512
TP 3520 - 3530 - 3550 - 3580.
Plan 2: BUY XAUUSD zone 3498 - 3500
SL 3495
TP 3503 - 3513 - 3530 - 3550.
Wishing you a safe, effective and profitable weekend trading day.🥰🥰🥰🥰🥰

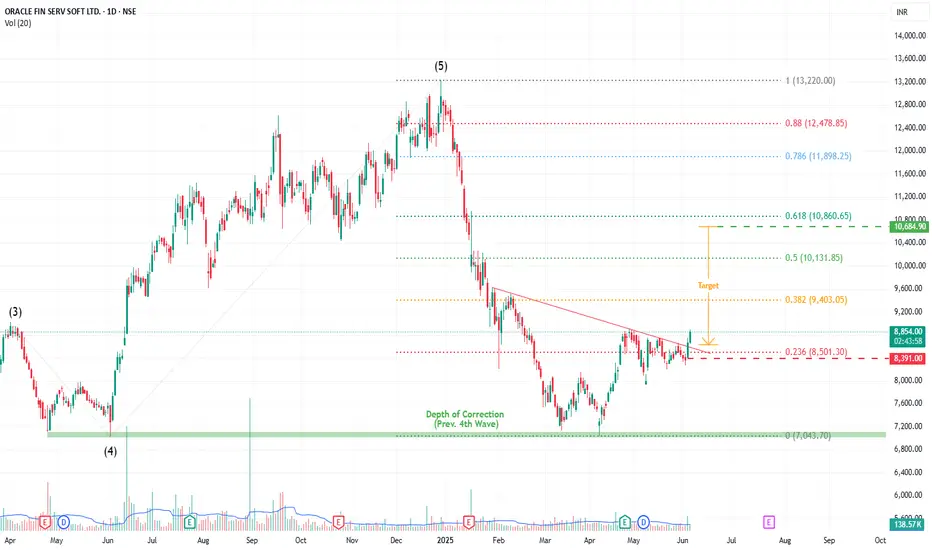
OFSS (ORACLE FIN SERVICE) By KRS Charts5th June 2025 / 12:35 PM
Why OFSS?
1. Fundamentally Good Company.
2. Technically, Bullish Stock for a long time and here again made higher low on bigger time frame.
3. Wave Theory vice it bounces back from 4th impulsive wave (Depth of Correction).
4. After that it has formed few bullish charts pattern like Invt. Head & Shoulder and Flag and Pole is also visible within.
5. Yesterday it Broke Neckline with good volume green candle.
Targets & SL (1D Closing Basis) is mentioned in Chart
Gold Trading Strategy XAUUSD September 4, 2025Gold Trading Strategy XAUUSD September 4, 2025: New all-time high of $3,578, gold eases to $3,536/oz as US ADP data takes center stage.
Fundamentals: Spot gold hit a record high on Wednesday as weaker-than-expected US jobs data weighed on the US dollar. Gold bulls are betting on further gains. The US Department of Labor's Bureau of Labor Statistics released its Job Openings and Labor Turnover Survey (JOLTS) report on Wednesday, showing that job vacancies, an indicator of labor demand, fell by 176,000 to 7.181 million on the last day of July. Economists surveyed by Reuters had previously forecast the number of vacant jobs in the United States at 7.378 million in July.
Technical analysis: After creating the latest ATH of 3578, the gold price corrected strongly to the 3511 area and then continued to increase; this can be considered a short-term profit-taking wave of the gold price. However, the selling pressure is still not strong. The multi-frame RSI is in the overbought area and shows signs of entering the buying zone. We continue to wait at the support areas combined with MA, Fib and FVG zones.
Important price zones today: 3495 - 3500 and 3475 - 3480.
Today's trading trend: BUY.
Recommended order:
Plan 1: BUY XAUUSD zone 3495 - 3497
SL 3492
TP 3500 - 3510 - 3530 - 3550 - OPEN.
Plan 2: BUY XAUUSD zone 3475 - 3477
SL 3472
TP 3480 - 3490 - 3520 - 3550 - OPEN.
Plan 3: SELL XAUUSD zone 3549 - 3551
SL 3554
TP 3546 - 3536 - 3516 - 3500. (small volume, effective before US session).
Wish you a safe, effective and profitable trading day.🌟🌟🌟🌟🌟

XAUUSD – Gold Stalls as USD Regains StrengthThe ISM Services PMI was reported at 50.9, higher than the previous 50.1 and still above the 50 threshold – indicating that the U.S. services sector remains in expansion. This is a sign that the U.S. economy is still resilient, and the USD immediately benefited. With a stronger dollar, it’s natural for gold to come under corrective pressure.
On the 8H chart, after a sharp rally, XAUUSD was capped at the 3,579 USD resistance . From there, price showed a reversal signal and started to retreat. The nearest support lies around 3,465 USD, and if this level is broken, the probability of a deeper decline increases significantly – especially as the fundamentals continue to favor the greenback.
In the short term , I favor a bearish scenario: sell while price stays below 3,579, targeting 3,465. Only a clear close above 3,579 would bring the bullish outlook back, but for now, gold looks set for a correction.

XAUUSD Gold Trading Strategy September 3, 2025XAUUSD Gold Trading Strategy September 3, 2025: Gold prices are stable, heading towards the $3,550 mark with ETF capital flows boosting and the market is also waiting for employment data and developments from the FED.
Basic news: Spot gold prices remained stable in today's Asian trading session, after rising sharply in the previous session. The current international gold price is around $3,531/ounce, according to CMC Group's FedWatch Tool, the market is pricing in nearly 92% of the possibility that the Fed will cut 25 basis points at the meeting on September 17.
Technical analysis: Spot gold prices continue to increase strongly. The rising price channel remains. Currently, the MA lines and the Fib frame are still very good support areas for prices, however, the RSI is in the overbought area; we should be careful that prices will have a correction first and then increase again. We limit FOMO, continue to wait at support zones combined between MA, Fib and FVG zone.
Important price zones today: 3500 - 3505 and 3475 - 3480.
Today's trading trend: BUY.
Recommended orders:
Plan 1: BUY XAUUSD zone 3500 - 3502
SL 3497
TP 3505 - 3515 - 3530 - 3550.
Plan 2: BUY XAUUSD zone 3475 - 3477
SL 3472
TP 3480 - 3490 - 3500 - 3530.
Wish you a safe, effective and profitable trading day.💯💯💯💯💯

SAIL (Bird view) By KRS Charts28th May 2025 / 10:17AM
Why SAIL??
1. As we can see from above chart, it clearly turning Bullish Trend stock from Berish .
2. Fundamentally its Durable and is at decent valuation right now.
3. Technically, in 1D TF fake selling and Gap Down is visible showing sellers got trapped. Such move market gives when they need liquidity, and this can happen both the side.
4. Further Bullish traits Sell candles volume is getting lower and allover lower than bullish candles. which usually noticed when Stock turned bullish on bigger cycles.
5. 100 EMA is underneath in many significant timeframes which also indicates buyers had shown more interest in past and likely this time as well.
Targets and Stop Loss is mentioned in Chart.
Note: This is 1M TF view will be Medium to Long Term

NMDC By KRS Charts9th June 2025 / 19:01
Why NMDC?
1. Dow Theory , it turned into Bullish Trend with Higher Highs & Higher lows.
2. Huge Accumulations since many Years and as I said above HHs & HLs.👆
3. In major timeframes stock is above 100EMA which is sign that more upside might possible.
4. Wave counts are picture perfect with more than 0.618 retracement for wave(2) and Reversed to upside from 0.5 Retracement between wave(2) & wave4 bottom points.
Targets & SL is mentioned in Chart.
NSE:NMDC NSE:CNXMETAL
