Breakout Ready Stock | Keep On watchThe technical setup for SCILAL is currently one of the most compelling "value unlock" stories on the board. After a painful period of sideways consolidation near its 52-week lows, the stock is finally showing signs of life, breaking out from a tight ₹43–₹45 range with renewed momentum. Your marked targets of ₹52 and ₹60 align perfectly with historical resistance zones and previous swing highs. As long as the stock stays comfortably above the ₹42.80 support level, the bullish thesis remains intact, suggesting that the "bottom is in" and the next leg of the rally is just beginning.
Supporting this breakout is a wave of fresh fundamental news that provides the "why" behind the price move. Just this past week (February 4, 2026), SCILAL reported its Q3 results showing a 10% YoY growth in net profit, largely driven by its rental and interest income. Even more significant for long-term holders is the Union Budget 2026 announcement regarding dedicated REITs for PSU land assets. This provides a clear, professional framework for SCILAL to finally monetize its massive land bank—something the market has been waiting for since the demerger from SCI.
With the government extending the CMD’s leadership for another year to ensure continuity and a 48% increase in the shipping ministry’s budget allocation, the macro environment has shifted from "uncertain" to "supportive." We are looking at a debt-free company trading at an attractive price-to-book ratio, right as the technicals signal a major trend reversal. If the volume continues to pick up, the move toward ₹60 could happen much faster than the previous consolidation period
Buyopportunity

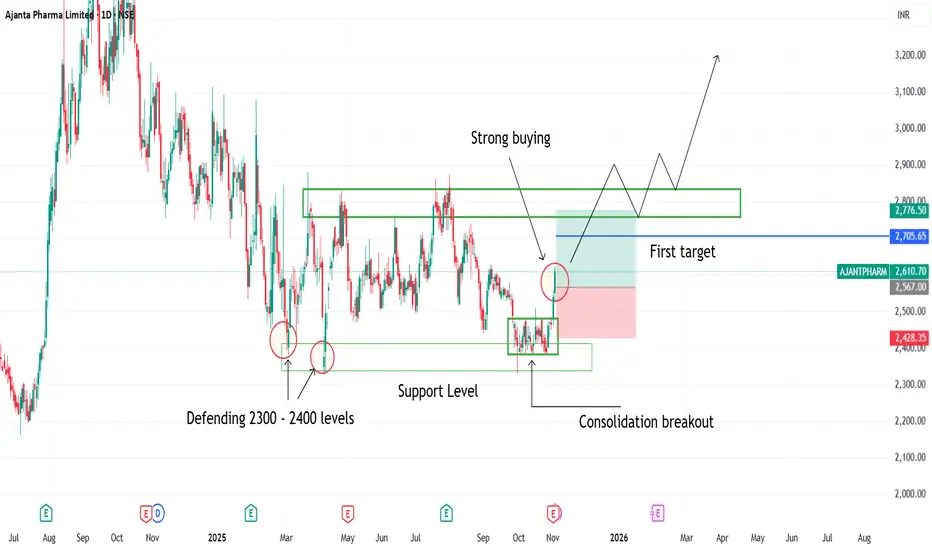
Consolidation breakout seen in ajanta pharma1. Consolidation breakout seen in ajanta pharma
2. Buyers defending 2300 2400 levels
3. Strong Bullish candles indicating strong buyers strength
4. Consolidation breakout has been happened on support levels
Petronet LNG weekly price action analysis for Feb-Mar 2026Analysis date: 31-Jan-26
Please note: This analysis is for education purpose only for those who seek to understand price action.
Forthcoming Budget/Qtrly Results may render this analysis invalid.
Please consult with your financial advisor before taking any decisions.
Petronet LNG seems to have formed a good base/support in 285-265 region spending almost 6 months forming a cluster of HH/HL/LH/LL as seen on the charts.
If the stock comes near 285 to 265 region it may take support for targets near 305/320 levels. Keep SL at 260
Happy Trading!

Eternal (Zomato) price action analysis for Feb-Mar 2026Analysis data: 26-Jan-26
Zomato had a good runup from 240 levels to 360 levels from May 2025 to Oct 2025.
Stock is currently at 258. It is likely to take support as buyers are expected in the 240-250 region again. However this time the targets would be 280, 290 & 300 levels.
Keep SL at 230
Happy Trading!

iifl finance 5min chart pe clean bullish breakout iifl finance 5min chart pe clean bullish breakout dikh raha hai
price ne descending trendline ke upar strong breakout diya hai with volume support. consolidation ke baad higher highs & higher lows ban rahe hain, jo bullish continuation signal hai.
🔹 trade plan (intraday / short-term swing)
buy above: 651
stop loss: 639
targets:
t1: 6500
t2: 6530
🔹 technical view
trendline breakout confirmed
price vwap ke upar sustain kar raha hai
volume spike breakout candle pe visible
retest zone near 645–647 holding strong
jab tak price 639 ke upar hold karta hai, bullish bias intact rahega. below 639 close aane par setup invalidate ho jayega.
risk reward approx 1:2+

BUY NATIONAL ALLUMINIUMNational Aluminum gives all time high breakout and than retest the level which become strong support and stoploss for a trade, so long on national aluminum or hold as a trade as well long term investment with strict stoploss. Do your own research this is only for education purpose not any buy or sell recommendations. i am not expert in market because market is the king. Enjoy the Ride.

360One WAM breakout pattern IIFL all companies are in trend, 360one in capital market section is also doing wonders. risk reward mentioned on the chart, strong breakout expected. pattern is very good

Piramal Enterprises – Swing Trade Idea🟢 Trade Setup (Swing)
Buy Zone:
➡️ Near ₹1640 (support + demand area)
Targets:
🎯 T1: ₹1783
🎯 T2: ₹1840
Stop Loss:
⛔ ₹1600
🔍 Technical Reasons
Price respecting 20 & 50 EMA
Recent pullback with low selling volume
RSI holding above 50 → strength intact
Previous resistance now acting as support
Risk–Reward ≈ 1:4

For AU Small Finance Bank (AUBANK), the technical setup as of DeFor AU Small Finance Bank (AUBANK), the technical setup as of December 30, 2025, shows the stock is testing a critical psychological and technical resistance zone. The price is hovering near its 52-week highs, suggesting a "buy on breakout" or "buy on dips" strategy.
Technical Snapshot
• Current Price: ~₹975 – ₹986
• Trend: Bullish (Trading above short-term and long-term moving averages)
• RSI: Entering the overbought zone but showing room for a final leg up toward the ₹1,000 mark.
• Key Resistance: ₹985 (Immediate) | ₹1,007 (52-week High)
• Key Support: ₹965 – ₹970 (Strong immediate base) | ₹945 (Major Support)

MIDHANI — Base Breakout After Prolonged Consolidation seing this from 13nov First entry @1120 50-60% gain
thinking to hold untill big green or red candel apears indicating operator exit what do you think about this

Neogen Chemicals Ltd — Base Breakout After Capitulation Sell-OffNeogen Chemicals witnessed a sharp capitulation decline followed by high-volume demand emergence, signaling potential exhaustion of sellers. After forming a V-shaped recovery from the lows, the stock is now reclaiming a key demand zone near ₹1,150–1,165, which earlier acted as strong support.
Price has successfully closed above the base, indicating:
✔️ Change in character (ChoCH)
✔️ Short-term trend reversal
✔️ Acceptance above demand
The structure suggests a range expansion move toward the next supply zone if the breakout sustains.
📊 Technical Highlights
Strong volume spike near the bottom → institutional absorption
Higher low formation → buyers gaining control
Break & hold above base → low-risk entry zone
Upside projection toward ₹1,300–1,360
Risk well-defined below ₹1,100
🧠 Fundamental Context
Neogen Chemicals operates in the specialty chemicals and lithium-based intermediates space, catering to high-value, niche segments with export exposure. The company benefits from:
Growing demand from pharma, agrochemicals, and advanced chemistry
Strong positioning in custom synthesis
Long-term tailwinds from EV and battery chemistry themes
While short-term price volatility existed, the business fundamentals remain intact, making this technical base formation more meaningful.

Titan breaout sustained above levelsTitan breaout sustained above levels it is an evergreen stock to buy for investing and for stort term also

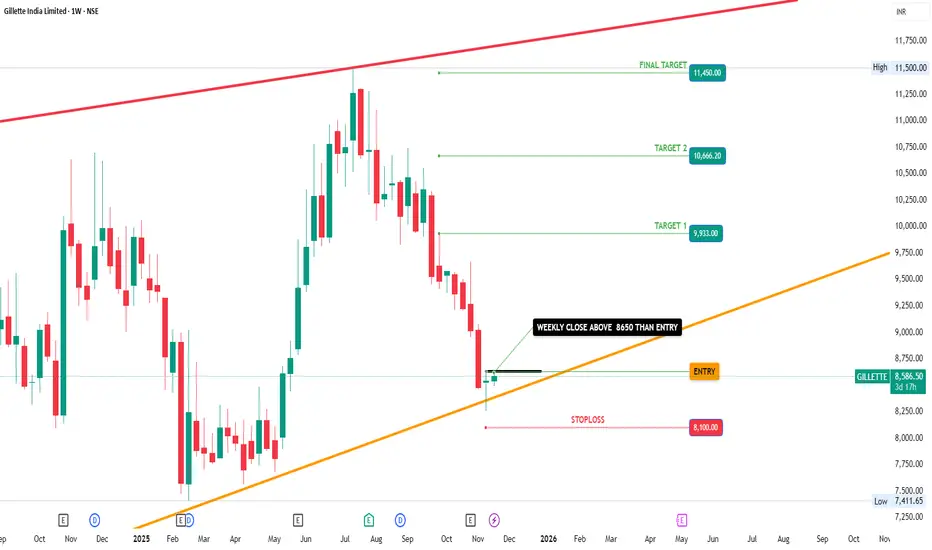
GILLETTE INDIA IN KEEP IN RADARGILLETTE now at strong trend line support on weekly time frame. Very small risk and good reward levels almost 1:4 to 1:5 so its good stock for investment for long term. So keep on watchlist for investment purpose.
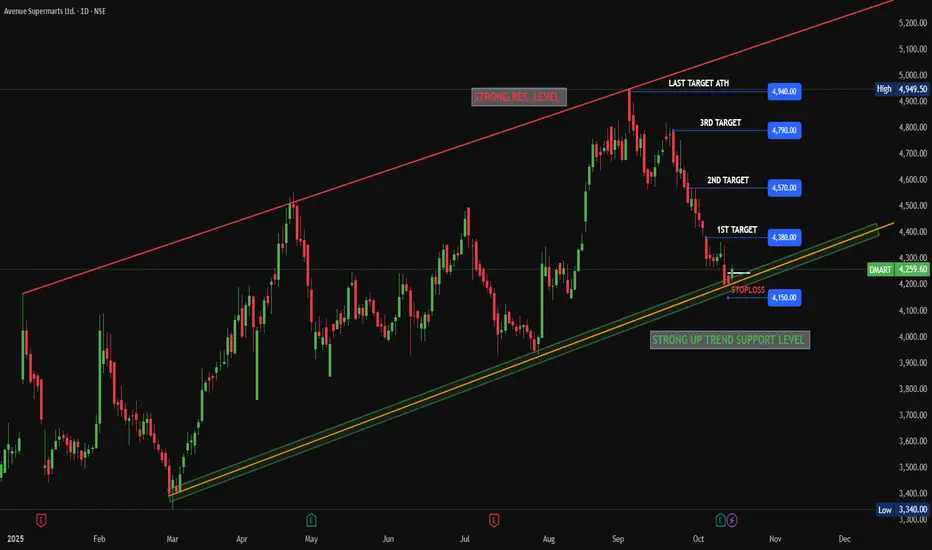
DMART LONGDMART (Avenue Supermarts) has reached a strong trend support level. Additionally, in the daily timeframe, the current candle closed at the previous day's candle level.
Therefore, we can go long in DMART for a swing trade. Fundamentally, the quarterly results are already out, so there is no immediate issue regarding upcoming events.
Go long on DMART, but make sure to manage your trade quantity, risk, and reward based on your risk appetite. This is for educational purposes only and does not guarantee returns.
BUY HITACHI ENERGY INDIA LIMITEDHitachi energy India limited on strong support level as well as breakout on candlestick pattern, very small size stoploss for good amount of reward, so make a position current price and wait for fun in few days. Go long and enjoy. No Guaranteed return assured.

GLENMARK PHARMA LONG SETUP FORMATIONKeep eye on Glenmark Pharma closing above 1845 than make long position with small stoploss and wait for the reward. No guaranteed return assured. Do your analysis from your side than made an entry.

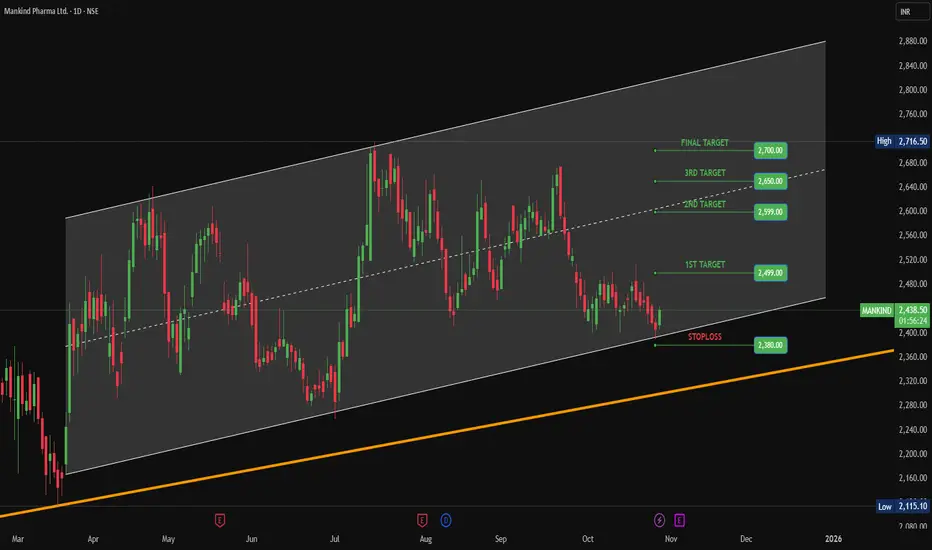
BUY MANKIND PHARMAMankind pharma at trend support level and already gives a strong breakout on candle stick pattern. Taking small Risk for big reward.
BUY MAX HEALTHCARE FOR TRADINGMax healthcare gives a breakout on weekly as well as daily time frame to consider a buy call for short term trading perspective with strictly stoploss. 1:2 Risk Reward Ratio. if All Time High break out than i repeat my targets in next few days. Stay Tuned. This is only for educational purposes do not consider as a recommendation. do your home work first not guarantee return.

BEL (Bharat Electronics Ltd) – Ascending Triangle Setup 🟢 BEL (Bharat Electronics Ltd) – Ascending Triangle Setup | Breakout Watch 🚀
📊 Chart Setup:
BEL is forming an ascending triangle pattern on the daily chart — a bullish continuation setup. The breakout level is around ₹435. Confirmation will come with a daily close above ₹435.
🔹 Targets: ₹455 / ₹480
🔹 Support: ₹408
🔹 Pattern: Ascending Triangle (yet to break)
🔹 View: Wait for confirmation candle close above the resistance zone for sustained momentum.
💼 Fundamental Update – Q2 FY25 Results 🛰️
BEL posted strong Q2 numbers beating estimates across all metrics:
• Net Profit: ₹1,285 Cr ↑ vs Est ₹1,143 Cr — Beat
• Revenue: ₹5,764 Cr ↑ vs Est ₹5,359 Cr — Beat
• EBITDA: ₹1,695 Cr ↑ vs Est ₹1,482 Cr — Beat
• EBITDA Margin: 29.42% ↑ vs Est 27.7% — Beat
➡️ Strong all-round performance with robust revenue growth and healthy margins, adding confidence to the bullish setup.
📈 For educational purpose only. Not a buy/sell recommendation.

NVDA UP TO 214$Hello
According to my analysis on the NVDA daily chart, I can confirm a high-probability buy opportunity that could reach $214 within the next few days.
Ibrouri Abdessamad

IRB trendline breakout on support level1. trendline breakout on support level
2. Inverse head and shoulder pattern on support level
3. good for swing upside movement

Double bottom W pattern in LIC housing financeDouble bottom W pattern in LIC housing finance
may test its resistance zone
good for upside movement

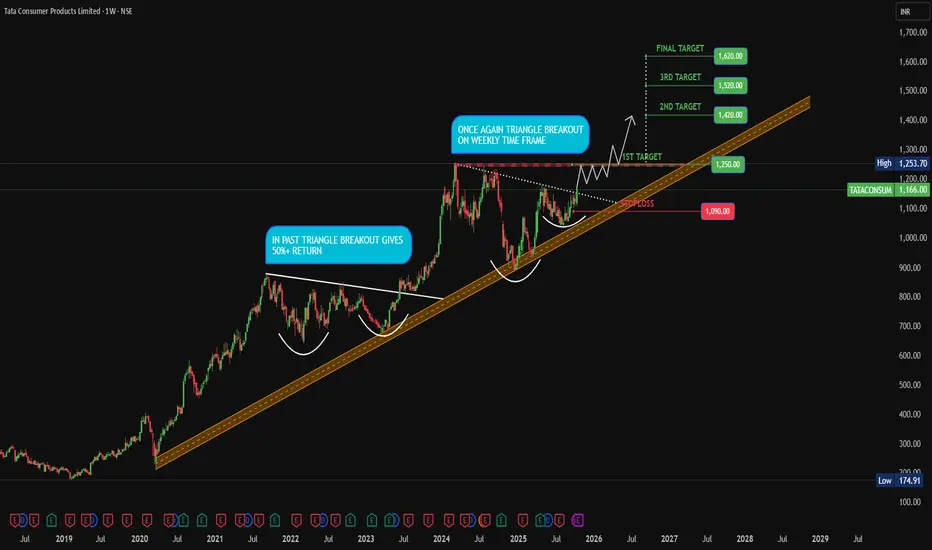
BUY TATA CONS HISTORICAL BREAKOUT in past TATA CONS stock make same triangle structure and gives a breakout than consolidated for 6 to 7 week for accumulation and than gives 52%++ return in a year. Last week its gives same breakout with strong support and good to consider for long term with good risk return. Do your own study and research before entering any position. No guarantee return.