Gold retraces after surge – trend remains intact.Quick Context
Recent geopolitical uncertainty continues to support safe-haven flows. Gold has already delivered a strong bullish impulse, and the current move looks like a healthy correction, not a reversal.
Technical Snapshot (H1–H4)
Strong bullish impulse already completed
Current price action = controlled retracement
No bearish CHoCH, no structural breakdown
Market is resetting momentum after expansion
This is typical impulse → retrace → continuation behavior.
Key Levels to Watch
Buy Zone: 5,180 – 5,160
Invalidation: H1 close below 5,120
Upside continuation targets:
5,300
5,360
Extension toward 5,440+
If – Then Logic
If price holds above 5,160 → expect continuation higher
If price sweeps into 5,180–5,160 and reacts → buy-the-dip opportunity
Only if H1 closes below 5,120 → bullish bias weakens
Bottom Line
Gold is not reversing — it is reloading.
Pullbacks are part of trend strength.
Wait for reaction, not confirmation at the highs.
Buythedip

XAUUSD Pullback to Demand Zone @ 4400 - 4390Gold (XAUUSD) faced a strong rejection from the 4500 supply zone, triggering a healthy corrective move. Price is now approaching a key demand area between 4400 – 4390, where buyers are expected to step in.
If this support holds, we anticipate a bullish bounce with upside targets at 4425, 4435, and 4450.
This zone could offer a high-probability buy setup for short-term to intraday traders, provided bullish confirmation appears.
📌 Disclaimer:
This analysis is for educational purposes only and is not financial advice. Always manage risk and follow your trading plan.
Your feedback drives our content and keeps everyone trading smarter. Let’s make those pips together! 🚀
Happy Trading,
– The InvestPro Team

Gold Structure Update – Bulls Still in Control next 4518++Hello everyone, gold is trading inside a clear rising channel, and the structure remains bullish with higher lows intact. After the recent upside move, price has pulled back toward the lower side of the channel, which is a normal and healthy move in a strong trend.
This pullback is happening exactly where buyers are expected to step in. As long as price holds above the marked support zone, the probability still favors upside continuation, not breakdown. Strong trends usually pause, shake out weak hands, and then continue.
For now, there is no sign of trend failure. Only a clean break and acceptance below support would change the view. Until then, this remains a buy-on-pullback market, not a place to panic or chase.
Key Levels to Watch
Buy Zone: 4466–4463
Stop Loss: Below 4445
1st Target: 4480
2nd Target: 4500
3rd Target: 4518
Bias: Bullish above support
Disclaimer: This analysis is for educational purposes only and should not be taken as financial advice. Please do your own research or consult your financial advisor before investing.
Analysis By @TraderRahulPal | More analysis & educational content on my profile.
If this update helped, like and follow for regular updates.

XAUUSD Bullish Continuation | Buy the Dip @ 4400 - 4375Gold (XAUUSD) has delivered a strong bullish impulse following heightened geopolitical tensions involving the US and Venezuela. Price is holding firmly above the 4400 key support zone, signaling sustained bullish strength.
As long as gold maintains acceptance above this level, the bias remains bullish, with upside targets at 4440 and 4470.
We are patiently waiting for a healthy pullback toward support to look for high-probability buy opportunities in line with the prevailing trend.
📌 Disclaimer:
This analysis is for educational purposes only and is not financial advice. Always manage risk and follow your trading plan.
Your feedback drives our content and keeps everyone trading smarter. Let’s make those pips together! 🚀
Happy Trading,
– The InvestPro Team

NIFTY Buy-on-Dips | 26,000 CE Opportunity for Jan 6NIFTY continues to show bullish strength, and the broader structure favors a buy-on-dips approach for today, 2nd January 2026.
📌 Trade Setup (Options):
Instrument: NIFTY 26,000 CE (6th Jan Expiry)
Buy Zone: ₹180 – ₹170
Target: ₹240
Risk Level: ₹140 (must hold on closing basis)
As long as ₹140 remains intact, the bullish momentum stays valid. A dip into the mentioned buy zone could offer a low-risk, high-reward opportunity aligned with the current trend.
⚠️ Trade with strict risk management and adjust position sizing accordingly.
📌 Disclaimer:
This analysis is for educational purposes only and is not financial advice. Always manage risk and follow your trading plan.
Your feedback drives our content and keeps everyone trading smarter. Let’s make those pips together! 🚀
Happy Trading,
– The InvestPro Team

GOLD READY FOR A BULLISH REBIRTH | Pullback Buy Setup Inside🧭 DAILY TRADING PLAN — GOLD (XAU/USD)
Date: Oct 30, 2025
Main timeframe: H1 – M30
Strategy: SMC + EMA Confluence + Trendline Reversal
🧩 MARKET CONTEXT
Gold has just completed a liquidity sweep below 3920 and is forming a bullish corrective structure along the rising trendline.
The short-term structure shows CHoCH → BOS confirmation around 3950–3970, signaling a potential reversal phase.
Price is currently testing the EMA zone (H1) and approaching the key supply at 4026–4028, where short-term profit-taking might appear.
Overall, market sentiment remains bullish toward 4020–4030, but a short retracement could occur before the next leg up.
🎯 TRADE PLAN
BUY SETUP #1
Entry: 3950 – 3948
SL: 3943
TP: 4018 → 4026
(R:R ≈ 1:3)
If price fails to hold above 3948, wait for a deeper liquidity grab:
BUY SETUP #2
Entry: 3921 – 3919
SL: 3913
TP: 3980 → 4020
(Liquidity sweep + trendline confluence)
SELL SETUP (Counter-trade)
Entry: 4026 – 4028 (rejection zone)
SL: 4033
TP: 3970 – 3950
(Only valid if bearish BOS appears on M15)
🔍 TECHNICAL INSIGHT
Structure flipped bullish after CHoCH & BOS on M30
Trendline support remains intact
EMA 34 crossing upward on H1 – confirming short-term momentum
Main liquidity pools sit around 3919 (below) and 4028 (above)
Expect pullback → bullish continuation as long as price stays above 3948

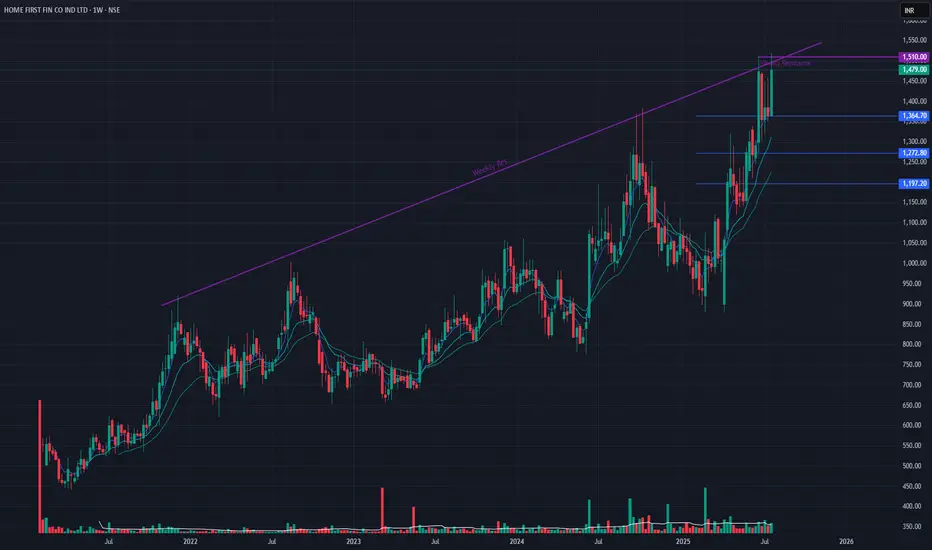
Home First Fin Co Ind Ltd (Weekly Timeframe) - Bearish SignsThe stock has been in an uptrend since Feb 2025 and since last few weeks, it has gone sideways showing some exhaustion. This week, it made an All Time High, breaking a Long-term resistance and Short-term resistance . There may be some profit booking in the coming weeks and may see the stock going down to the levels indicated, if it cannot maintain the upside momentum.
When to Buy the Dip & When to Stay Away!Hello Traders!
We’ve all heard the phrase “Buy the Dip” — but blindly following it can be a dangerous trap. Not every dip is a buying opportunity. Some are just the beginning of a deeper fall! So how do you know when to step in — and when to step aside?
Let’s decode smart dip buying vs. risky dip chasing so you can make better entries and protect your capital.
When to Buy the Dip
Uptrend Structure Intact:
Price is still forming higher highs and higher lows. The dip is just a healthy pullback.
Approaching Strong Support Zones:
Previous swing lows, demand zones, or trendlines are holding. Add confluence with Fibonacci or moving averages.
Volume Confirms the Bounce:
Look for decreasing volume during the dip and increasing volume on bounce or green candle formation.
No Negative News Trigger:
Dip is technical, not caused by bad news or earnings shocks. Sentiment is still positive.
When to Stay Away from the Dip
Trend Has Reversed:
If the market structure is broken and lower highs/lows are forming, it's not a dip — it's a downtrend.
Dip on Negative News or Fundamentals:
Sharp fall due to weak results, downgrades, or global cues? Better to wait for stabilization.
No Price Action Confirmation:
Don't buy just because it “looks cheap.” Wait for confirmation like bullish candles or reversals at key zones.
High Volatility & No Base Formation:
If price is free-falling without structure, it’s not a dip — it's a trap.
Rahul’s Tip
Every dip looks tempting — until it dips more! Wait for structure, confirmation, and signs of demand. Let the price prove itself before you commit.
Conclusion
Buying the dip is a powerful strategy — but only when used wisely. Combine trend analysis, support zones, price action, and volume to separate healthy pullbacks from risky crashes.
Do you buy the dip often? What’s your filter for safe entries? Let’s discuss below!

DMART at a support level and at a discount.
✅It is at a support level and available at a discount.
✅For long-term investors, Dmart is at a decent
value.
✅Decent Fundamentals/Good Management
✅Positional or Swing traders can look for long entry
above 3985, provided it gives a good candle with
good volume.
Remember:
❌Stock is beaten down with the advent of digital shopping platforms.
❌Stock is Trading way below 200 DMA and 50 DMA
❌As of now it lacks momentum.
❌A breakdown of 3180 can bring in more weakness
and stock may test 2683.
Entry(Positional/Swing)- 3984
SL-3189- Closing Basis
Risk: 20%
Reward: 38%-50%
This is more apt for the long term. Buy this dip only if you understand the company and believe in its fundamentals and management.
This is just my view and please do not treat this as a Buy/Sell recommendation. Please do your due diligence.

SPIC long term investmentMulti year breakout stock : SPIC 🚀
Stock has broken out of its resistance trendline connecting the highs during ipo of the stock in 1999 , pattern looks more of like a breakout retest in 12months time frame
Fundamentals of the stock are also good :
# Low debt co
# Stock trading at a very low PE ratio of 4.5
# Constant growth year on year , boosting EPS
# Promoter holding of 50%
# Excellant cash flow , CFO/PAT of 2.3
# Reserves and Assets increasing
👉 Overall the stock is both fundamentally and technically very strong , looking very good to me for a multi bagger returns in long term , will be buying the stock on every dip as long as its trading above 50rs , no targets in the stock , upside is completly open

HOME FIRST FINANCE CO LTDThe stock HOME FIRST FINANCE is looking good for an upmove , stock has given breakout of its double bottom structure and any dip towards 780-800 is buying oppertunity , expected targets of 960/1100

3P LAND HOLDINGSFundamentals are decent ,charts showing big breakout
High risk stock
Buy on dips until trading above 20rs SL 13
# Multi year breakout stock breaking out of resistance of 2008
# Breaking out with good volumes
# 0 debt company
# 75% promoter holdings (GOOD)
# Company net profitable
# Reserves increasing

METROPOLIS HEALTHCAREMetropolis healthcare is looking good for a long , bears seems to be exhausted in this stock with structure changing towards bullish and also RSI divergence giving hints of an upside in the stock in coming days , SL of max 7% so RR is good , Will enter only if weekly candle closes above my level of 1290 , else ignore

COFORGE analysisThe stock COFORGE is buy on every dips as long as its above 4100 levels , keep sL at 4000 levels and buy gthe dips , risk reward is highly favourable and can give good targets of 4900/5100/5500 in coming days if view goes right

INDIA CEMENTSPossible bottom formation in the stock INDIA CEMENTS , with chart making a higher low cleary showing new buyers coming inthe stock looks good to be bought above the resistance levels of 190-195 for targets of 215/230 in coming days . PS : Price has to breakout above and sustain above the resistance , view changes if breakout fails

NIFTY50 trend analysisNIFTY50 index has approximately fallen 1500 points from all time highs of 18900 levels and a possible reversal is coming from major support areas of 17200 to 17000 , there maybe a start of another rally towards all time highs and also towards 20k levels in the index . A good bottom formation and a breakout of highs can give confirmation of a trend change , so for now nifty is highly possible to reach levels of 17200 from current price and am expecting a rally from 17k-17200 levels NSE:NIFTY

RELIANCEIs RELIANCE INDUSTries ready for another major rally on the upside , RR looking great with downisde risk of just 3-4% , if idea goes right reward can even be 30%

BANKNIFTYBanknifty future intraday setup buy above 43350 levels for targets of 43440/43630 , price has to break above and sustain above the resistance , invalid if theres a fakeout

Long MGLShort to Long term Pick.
Stock is at cheaper price at Monthly Demand Zone.
Entry already active. Hovering around the monthly zone. Accumulate in minor quantity in ranges 700 / 660 / 617.
Stop loss will be weekly close below 590.
Good to hold for a target of 819 / 883 / 1000.
Long term tgts of 1105 / 1200 +

Cardano to moon again!Hey everyone,
We are currently in our buying zone of Cardano, which I discussed in the previous idea. If you haven't viewed it yet, go chack it from the link below.
As discussed in the previous idea, $ADA went bearish after a consolidation of 1 month. Now, it is nearing a very strong demand zone, which can result in a trend reversal. The trend reversal might come with the formation of reverse head and shoulders pattern, which might end up in breaking the red trendline, and the pullback to the trendline will be the main place to enter the long position.
But, if it breaks the demand zone, we might a further move downwards. Many things depend on the move of Bitcoin too.
Trade safe, be alert to add some positions in the next dip.
Thank you!

2 POSSIBILITIES OF BITCOIN!Bitcoin has broken its all time high and now it is taking a pullback, it might bounce back from the 0.382 level on the Fibonacci retracement or it may go till the golden zone (between 0.5 to 0.618 level), after the higher low is formed, it might form a new high near 76k.
SORRY FOR THE MESSY CHART!

DOGE coin forming a huge triangle! ELON MUSK to tweet again?!I know that the DOGE coin is not good fundamentally, but if we look from TA point of view, this coin is about to give massive returns! The triangle is huge, it might give huge returns. But, on the other hand, never trust meme coins. Invest only that much, which you're ready to lose.

BTC movement in continuation to update dated 21 Sep 2021
Time frame- 4H
Exchange- Binance
Coin- BTCUSDTPERP
Chart includes the following Indicators
1. My own Custom Indicator - " Raptor Super Indicator "
As per the above indicator composition:
The current price level is already below EMA-13, EMA-21 & EMA-200 => Highly Bearish
The current Parabolic Support and Resistance levels shows downward movement => Bearish
2. Yellow thick trendlines shows a breakout from the downtrend of yesterday, now moving sideways in a range bound manner as depicted in a Rectangular region. => still bearish as in downtrend movement.
3. Gann Fan Indicator Support area in which the current candles lies - at support of (line 8/1)
=> In negtive zone(bearish), if it's price breaks this Gann Fan support Line price along the move, then BTC will enter in a Highly Bearish zone that is below line 8/1 and can further go down till the price Support level S2- $36192 as shown in the chart by PIVOT indicator (Horizontal Support and Resistance Lines)
4. Fibonacci Retracement Indicator: The last Price support level - $ 37291. The current movement shows that the Bitcoin price might come to this level, if not may be retraces back upward from - $ 37500.
My overall Technical Analysis says highly bearish , I may be wrong, but it may have a chance to go upward from current Gann support line otherwise doom is here tonight. We know the expected scenarios, now just have to be safe in this dump if it comes.
Not a financial advice. Do your own research before investing . Do not trust me as the username says.
Cheers and Happy Trading Fellas....
