CADILAHC

Cadila bullish in weely chartCadila is moving in an ascending channel and given a brkout in upside making it bullish
#positional
Buy cadila at 490
Tgt: 512, 545, 600+
Sl: 425
Timeframe: 1 month

CadilaHC Long(Swing trade)Above 481
SL-460
Target-491-496-502
Waiting for BO candle with volume
above all important moving average in all timeframe
already in positional trade

#CADILAHC-SYMMETRICAL TRIANGLENSE:CADILAHC IS FORMING A SYMMETRICAL TRIANGLE.WE CAN EXPECT A BREAKOUT FROM THE PATTERN.NORMAL RED LINES ARE LONG TERM S&R AND DOTTED RED LINES ARE SHORT TERM S&R.
CONSIDER THESE POINTS BEFORE ENTERING INTO TRADES;
WAIT FOR A PROPER CONFIRMATION BREAKOUT BY VOLUME AND MOMENTUM
SET STRICT STOPLOSSES OR ON PREVIOUS SWING AS PER YOUR RISK APPETITE
FOLLOW NIFTY & SECTORS FOR DOUBLE CONFIRMATION
ENTER ONLY ON PROPER POINTS.AVOID TRADE IF YOU ARE NOT ABLE TO ENTER ON THE CORRECT POINT
FOLLOW FOR MORE TRADE IDEAS AND INFORMATIONS

#CADILAHC-PERFECT BREAKOUT YESTERDAY I SHARED AN IDEA WITH YOU OF CADILAHC.IT WAS A SYMMETRICAL TRIANGLE CHART PATTERN.TODAY IT BROKE OUT OF THE TRIANGLE AND GAVE A RALLY NEAR PERCENT.HOPE YOU ALL MADE PROFITABLE TRADES TODAY
FOLLOW FOR MORE IDEAS AND INFORMATION

CADILAHC - RANGE BOUND MOVEMENT - MAY BREAKA RANGE BOUND MOVEMENT is a clear cut indication of consolidation followed by a breakout. A BIG BREAKOUT...........
Note:
Avoid the stock if a big gap up or gap down is seen
Enter after the breakout happens and not before it
Do not chase the market, i.e., do not get involved in late entries
Only enter with strict stop-loss and target
This is not a recommendation and is for educational purposes only.
always follow risk-reward and quantity management for the 100% of the times
The above mentioned idea may not work, so beware of the risk you are taking
Follow me to Learn and Earn with me.
Happy Trading!!

CADILAHC TRENDLINE BREAKDOWN & HEAD & SHOULDER 15MCADILAHC has given a breakdown to it's short term trendline in 15mins. It has also formed a pattern at the top which is called HEAD & SHOULDER PATTERN. The bias for this trade is negative. It is a intraday trade which can give you easy profits. But always remember that market is unpredictable. Sometimes some trades go wrong even when you are 100% confident. So you should always trade with a Stoploss. Stoploss limits your risk and you can hold onto your winning trades longer by tightly trailing the SL. Risk management is the key. Happy Trading!


CADILAHCIm not an expert im just sharing my views on CADILAHC
Im not responsible for any profit or loss this is not a recommendation

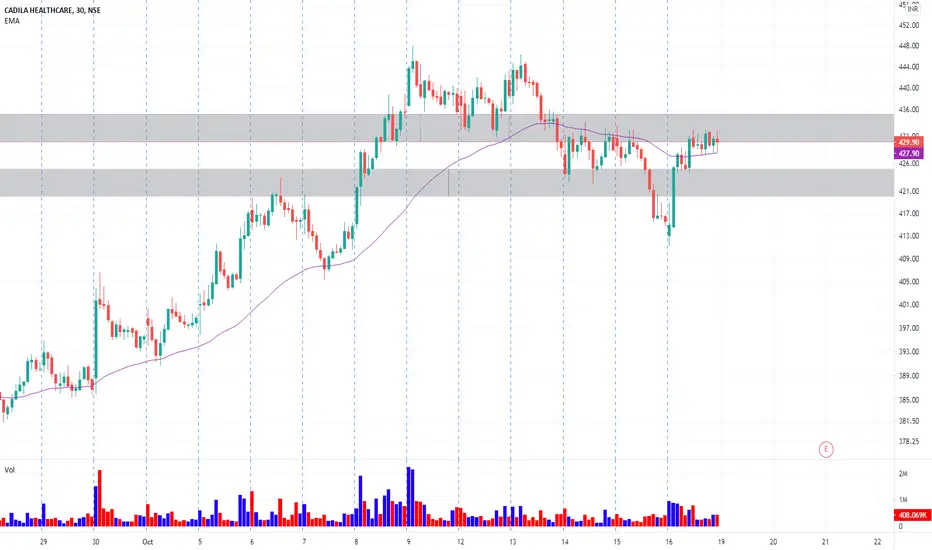
CADILAHC LOOK OUT FOR THESE LEVELS!!! ALL THE LEVELS ARE MARKED ON CHART, RED ZONES DENOTES SUPPLY ZONES AND GREEN IS FOR DEMAND ZONE .
STOCK HAS EARLIER TAKEN SUPPORT FROM 50 DAILY EMA - GRAY; BUY NEAR 423 IF THE PRICE IS SUPPORTED BY FIBO LEVEL.
The indicator used:
1) Daily Lines plots Daily 20 (BLACK) & 50 EMA(GREY) on lower time frame charts
2) TE-REKAB
- PB : PULLBACK
If you like the analysis, do leave a like and follow for more such content coming up.
The analysis is my POV, hope you got bucks in your pocket to consult a financial advisor before investing :P :)
HAPPY TRADING!

CADILA - 3 DAYS RANGECADILA HC - IN RANGE FOR 3 DAYS
TRADE OUTSIDE THE RANGE
WITH PROPER HIGH VOLUME BREAKOUT & PULL BACK


Swing/Intraday SetupSwing/Intraday Setup: There seems 2 entry points:
1. As soon as price breaks out the box we can enter around 448 but SL would be too deep for intraday however if you are looking for a good swing trade you can enter at CMP or between 438-442 with SL of 428 for target of 475/ 514.
2. Wait for price to do a break out and confirmation above 453 and take enter for the target of 475 with SL of 445. Keep trailing your SL with every 5 points for safe trade.
Note: I am not a SEBI register and view is only for educational purpose as well as personal, always consult your financial advisor before investing or trading.

#DRREDDY Triangle almost ending - Sharp rally should followDRREDDY should complete its Wave 4 triangle in the next few hours and head a few hunder point up to 5600 area. Watch the risk level for managing risk if entering. A good Risk Reward trade.

CADILAHC - W pattern bullish breakoutNote: This is for educational purpose only.
There seems to be W bullish breakout with high volume. There seems to be a breakout in RSI as well. RSI above 70 indicates bullish momentum. However, RSI indicates overbought so there might be a consolidation.

Cup and Handle, CadillaCadila Healthcare seems to have given Cup and Handle Breakout.
we have long view on stock from 383 level.
support at 405 level.
PS: Chart is only for purpose of education, please consult financial advisor before investing


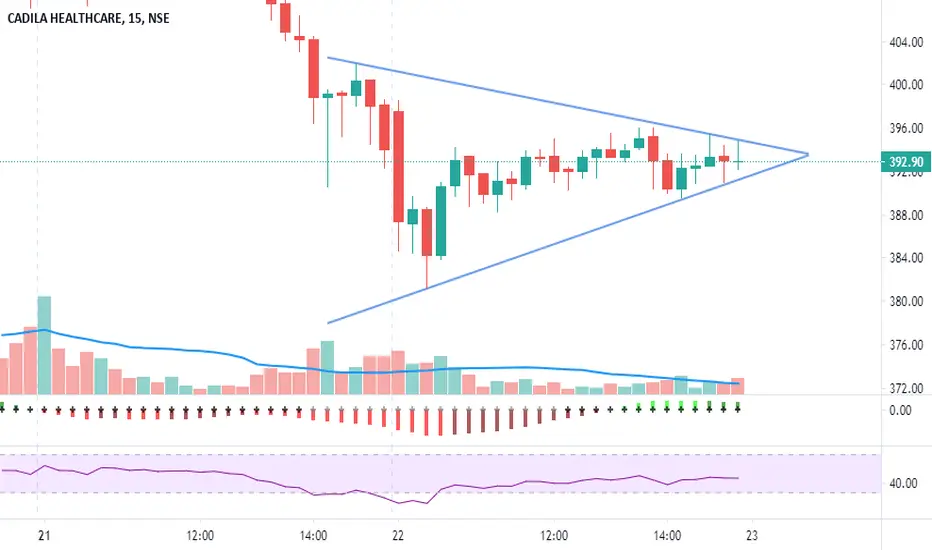
CADILAHC is Making Symmetrical Triangle Pattern (Breakout Trade)Cadila Healthcare Limited : Pharmaceutical Company ( NSE:CADILAHC ) is Making Symmetrical Triangle Pattern (PATTERN BREAKOUT TRADE).
This can become a very good trade for iNTRADAY Traders.
Target + StopLoss: There is no target here. You keep the first target as much as the StopLoss you put. And the StopLoss will be the Low/High of the candle that BROKE this pattern. Or Low/High swing backward inside the pattern.
And as soon as you get a profit of 0.70% of your TARGET , you will trail your StopLoss and bring it to the entry point. And as soon as your first target is hit, you will release half of your total quantity and continue to trail your StopLoss above the last swing Low/High.
Target and StopLoss are never already FiXED in the chart pattern.
You always have to trade only by M oney Management, P osition Sizing, S topLoss Trailing. This is the way to stay in PROFiT .
If you want to get something good like this EVERYDAY then follow me here on TradingView now.
Chart Published By Ravinder Sharma
Thank U.

CADILAHC is Making Symmetrical Triangle Pattern (Breakout Trade)Cadila Healthcare Limited : Company ( NSE:CADILAHC ) is Making Symmetrical Triangle Pattern (PATTERN BREAKOUT TRADE).
This can become a very good trade for INTRADAY traders.
Target + StopLoss: There is no target here. You keep the first target as much as the StopLoss you put. And the StopLoss will be the Low/High of the candle that broke this pattern. Or Low/High swing backward inside the pattern.
And as soon as you get a profit of 0.50% of your target, you will trail your StopLoss and bring it to the entry point. And as soon as your first target is hit, you will release half of your total quantity and continue to trail your StopLoss above the last swing Low/High.
Target and StopLoss are never already fixed in the chart pattern.
Thank you.
You always have to trade only by money management, position sizing, StopLoss trailing. This is the way to stay in profit.
Chart Published By Ravinder Sharma