CADILAHC

CadilahcPlay accordingly...pharma sectors...Lots of oi build up in bullish side...pull back trade also happen...
Best buy recent high close candle only...
Do your own analysis....


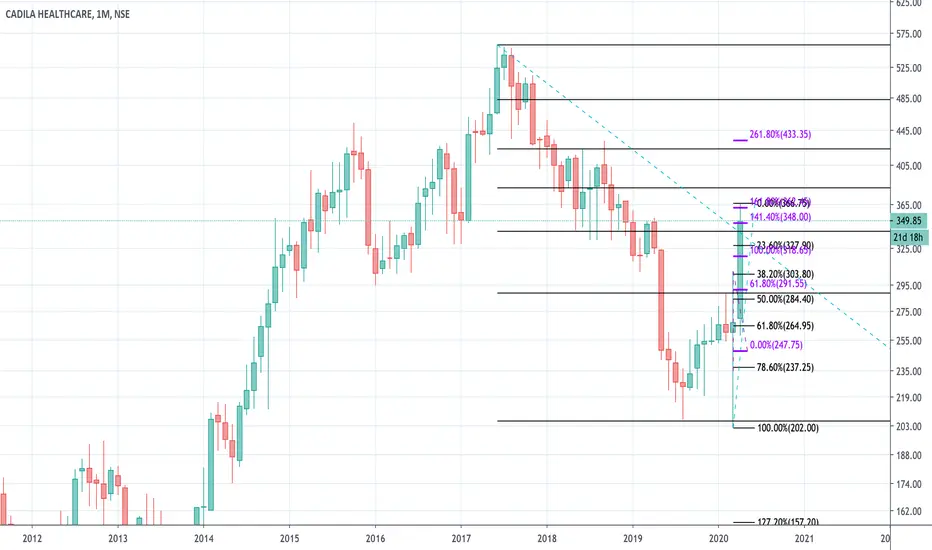

CADILAHC Weekly Analysis 05 Apr 2020RS is Rising.
Stock in range. (Accumulation or Distribution phase)
Price > 40W EMA.
Next trading range is 400-300.
Currently taking support @ 255.


Idea Mid Term BuyIdea share price has been following trend within trend with ascending triangle. Hope it will touch level Rs 20 to 30. then sudden down or range bound possible.
Short term target Rs 10 to 12
Mid term target Rs 20 to 30
Duration 20 to 90 Days
Disclaimer: Stock Market Is Subject To Market Risk. Buy Sell Is Your Choice.
Cheers!
Vikas Gupta

Cadila Healthcare (4 hrly chart)1. Taking Resistance at trendline.
2. Bearish engulfing Chart pattern.
3. Negative divergence on MACD

Cadila healthcare... Rising Wedge Pattern****POSITIONAL VIEW******
Short Below 269.5, SL 274.5,
Target 265/263/258
Long Above 274, SL 270,
Target 279/282/284


CADILA HEALTH (Cadila Healthcare Ltd) SELL BELOW 226CADILA HEALTH (Cadila Healthcare Ltd) SELL BELOW 226

Victor Sperandeo 2B Reversal Pattern RSI Diverg Small Risk TradeThe stock is in deep downtrend but has made a Victor Sperandeo 2B Reversal Pattern with RSI Divergence therefore it looks good for trading/investment. Traders can enter a long at current level with SL of recent low which is quite affordable. One can easily fetch 2.5 - 3 times reward of the risk being taken into this trade. I know that following the trend is better but sometimes taking small calculated risk for reversal also rewards well.
Disclaimer : All ideas are my personnel view. Please take financial consultancy for trading decision.

supports and resistance for lupin lupin positional looks good on charts for long
levels mentioned !!!


Again I came with this stock CADILAHCBuy this stock 242-245 and stoploss 240 and go for targets 255-259 intraday and positional targets 268-276

Try it out for intraday : CADILAHC BUY CADILAHC intraday cash 273.5-271 and stoploss will be 270 below and 286-294 intraday if close above 285.. then hold it 301-314.
No worry for weekly chart for long in deeper.
For the daily chart, above 270 is good for long at bottom.
