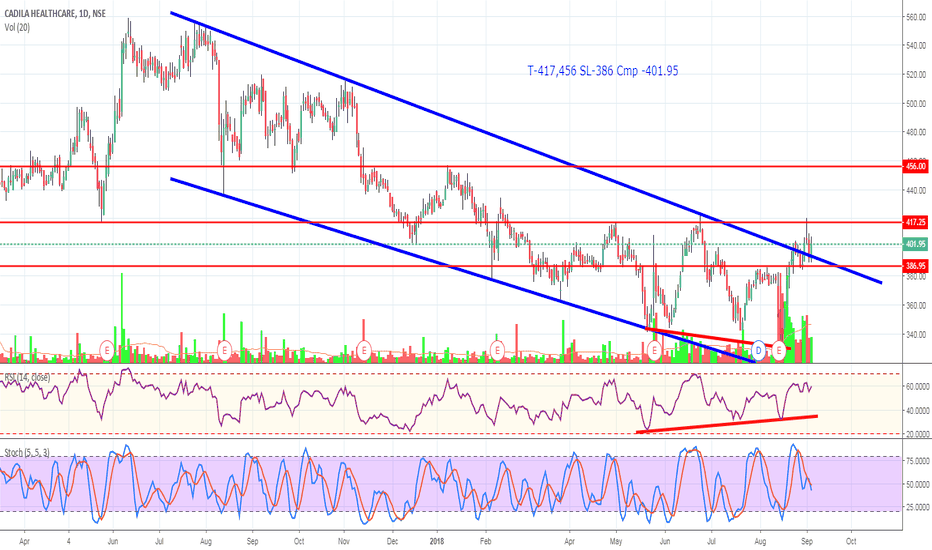
CADILAHC
CADILA daily downtrend at demand zoneCADILA, daily downtrend, at all time demand zone, expected to reach the resistance once again as indicated in arrow.
CADILA at multiyear demand zone. HNS???CADILA at multiyear demand zone. Will it break?
Does this weekly chart of cadila looks like a HNS?
Waiting zone for confirmation.
Cadila Bearish GartAvoid long in Cadila, Idea share here is for educational purpose only not recommending for trade. Please do contact your financial advisor.
Cadila healthcare Double Bottom...CADILAHC makes the double bottom keep watch the red line if break enter the trade
In this trade get two ways of profit
Buy now or wait for breakout then enter the trade...
Disclaimer:
The information contained in this presentation is solely for educational purposes. Does do not constitute investment advice. I may or I may not take the trade.
The risk of trading in securities markets can be substantial. You should carefully consider if engaging in such activity is suitable for your own financial situation.
I am not responsible for any liabilities arising from the result of your market involvement or individual trade activities.
Hope this idea will inspire some of you! Don't forget to hit the like/follow button if you feel like this post deserves it
CADILA HealthCare weekly chart studyCADILA HealthCare weekly chart study shows that its at a trendline support and a breakout above 416 could take it higher towards 500/540. At the same time a breakdown below 330 could take it towards 290/220
My Predictive Engine's Intraday call (23-Mar) - CADILAHC - ShortOff-late I started investigating more on predicting the next candle for the day and seeing enough success by using the patterns of various indicators. Pine scripting in tradingview has helped a lot to automate everything and create necessary signals. Based on the engine's call, tomorrow (23-Mar-2018) will be a super "RED" for NSE:CADILAHC
Sell below: 376.3
Target-1: 373.5
Target-2: 371.8
Target-3: 370.1
Stop loss: 379.8
Note: These calls are based on my own analysis. It may or may not work well for you. So please carefully consider whether it is suitable for you and please do your own research before attempting any. The profit/loss made by you due to this call, is solely your own responsibility. Thanks, All the best. Happy Trading. :-)
CADILAHC buy setupCADILAHC aftre a rounding bottom failure and an inverted H&S failure is now forming a cup and handle pattern.
Buy CADILAHC above 446
T1: 480
T2: 500
SL: 431
Cadilla - on reboundNSE:CADILAHC has consolidated from its highs and made dogi at bottom. As expected it started its recovery from there. Gave confirmation and broke the falling trend-line. RSI and MACD are favorable making it a good candidate for buy
Buy it at current price
CMP 422
Tgt 450 / 475
SL 410 on closing basis and 403 strict
It can be a slow candidate though and can show some drama in between, but I expect to reach target latest by jan end
Raising Wedge on CADILAHCRaising Wedge on CADILAHC and its lead to fall.
Trade:
Short below - 493.00
Target Zone - 473.00 to 466.00
Stop loss - 513
Symmetric Triangle on CADILAHCSymmetric Triangle on CADILAHC and it may break either side.
Trade Long:
Buy - 545
Target - 551
Stop loss - 540
Trade Short:
Short - 543
Target - 537
Stop loss - 547
CADILA Healthcare:An opportunity rarely comes when the fundamentals and technicals point to the same direction- up or down - in this case a strong upside
Cadila has formed a flag over the last few days as the big green candle seemed unbreachable.
This night, Jul 12, 2017, Sharvil Patel takes over as managing director of Cadila Healthcare.
A press release of Cadila getting USFDA nod to market anti-dementia tablets
Bollinger bands have tightened a lot and indicate upcoming volatility.
All these FA and TA factored in, this is a high probability, low risk call.
Disclaimer:
I am not responsible for your losses on the suggested trades posted by me.


