CAMS Story Repeating?Hello Traders,
CAMS has now formed similar chart pattern what it had form earlier on 1W Timeframe.
Pattern 1:
We saw a good retractment after rally in 2022. 0.38 was the fibo resistance in this time.
It went in consolidation till Aug 2023, when it finally started showing upmove. During this time, we can also see that Money Flow Index had show breakout but didn't sustained. However, the rally was continued.
Pattern 2:
After making All Time High in late 2024, it retraced and went sideways. And had retraced back till 0.50 fibo level, stronger pull back than the earlier(Pattern 1) pull back which was 0.38. Later it went sideways just like Pattern 1.
Now recently we have seen same MFI pattern of breakout and same like Pattern 1, i.e not sustaining, and not sustaining.
We haven't seen the price wise breakout yet in the stock.
However, there are two more common things here, the belt-hold candles formations in both the pattern 1 and 2.
And the rise and decline in volume.
I will be keeping close eye on this stock. Looks like it may show upmove just like pattern 1.
Note: This post is for information purpose only. Don't consider this as trading or investment recommendation or tip.
CAMS

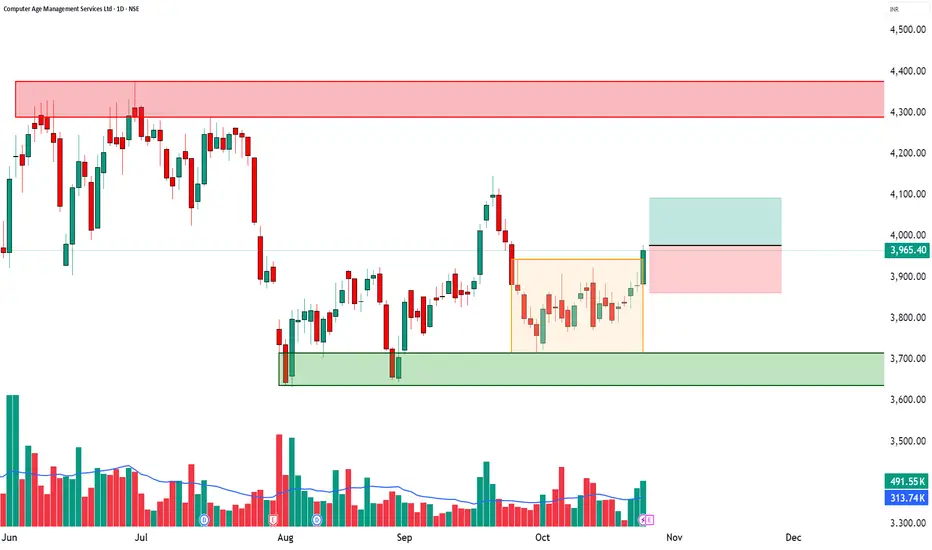
CAMS | Bullish Breakout + RSI Surge + High Volume📈 CAMS | Bullish Breakout + RSI Surge + High Volume Confirmation 🚀
🔹 Entry Zone: ₹3,965.40 – ₹3,977.80
🔹 Stop Loss: ₹3,862.45 (Risk ~115 pts)
🔹 Supports: 3,905.67 / 3,845.93 / 3,809.87
🔹 Resistances: 4,001.47 / 4,037.53 / 4,097.27
🔹 Swing Demand Zone: ₹3,815.50 – ₹3,789.90
🔹 Intraday Demand Zone: ₹3,885.70 – ₹3,877.00 | ₹3,875.90 – ₹3,868.10
🔑 Key Highlights
✅ Strong Bullish Candle – powerful continuation signal backed by strong volume
✅ RSI Breakout – confirms renewed buying momentum
✅ Bollinger Band Expansion – volatility breakout underway
✅ VWAP Alignment – sustained buyer dominance across sessions
✅ Volume Surge (1.57x avg) – active institutional participation
🎯 STWP Trade View
📊 Momentum favors a short-term bullish continuation. A close above ₹4,001 could extend the rally toward ₹4,037–₹4,097 zones.
⚠️ The ₹3,885–₹3,868 range offers intraday demand, while ₹3,815–₹3,789 serves as the swing demand base for positional traders.
💡 Learning Note
This setup combines RSI breakout + VWAP alignment + high volume — a potent trio for identifying momentum-backed bullish reversals. Traders can use intraday zones for tactical entries with clear stop placement.
Final Outlook: Momentum: Strong | Trend: Bullish | Risk: Low | Volume: High
________________________________________
________________________________________
⚠️ Disclosure & Disclaimer – Please Read Carefully
The information shared here is meant purely for learning and awareness. It is not a buy or sell recommendation and should not be taken as investment advice. I am not a SEBI-registered investment adviser, and all views expressed are based on personal study, chart patterns, and publicly available market data.
Trading—whether in stocks or options—carries risk. Markets can move unexpectedly, and losses can sometimes exceed the money you have invested. Past performance or past setups do not guarantee future results.
If you are a beginner, treat this as a guide to understand how the market works and practice on paper trades before risking real money. If you are experienced, always assess your own risk, position sizing, and strategy suitability before entering trades.
Consult a SEBI-registered financial adviser before making any real trading decision. By engaging with this content, you acknowledge full responsibility for your trades and investments.
Position Status: No active position in CAMS at the time of analysis.
Data Source: TradingView & NSE India (Past Chart Reference) (Historical levels)
💬 Found this useful?
🔼 Give this post a Boost to help more traders discover clean, structured learning.
✍️ Drop your thoughts, questions, or setups in the comments — let’s grow together!
🔁 Share with fellow traders and beginners to spread awareness.
👉 “If you liked this breakdown, follow for more clean, structured setups with discipline at the core.”
🚀 Stay Calm. Stay Clean. Trade With Patience.
Trade Smart | Learn Zones | Be Self-Reliant 📊
CAMS Stock is Currently Momentum TrendCAMS Stock is Currently Momentum Trend
Price trade above 50 ema & 200 ema.
Stock Price trend change.
Now we can plan for positive trade.
My view is enter 3980/3950 stoploss 3850 and 1st Target is 4300 or Long term investment because good fundament this stock.
If you enter into a trade, then do your analysis before that.

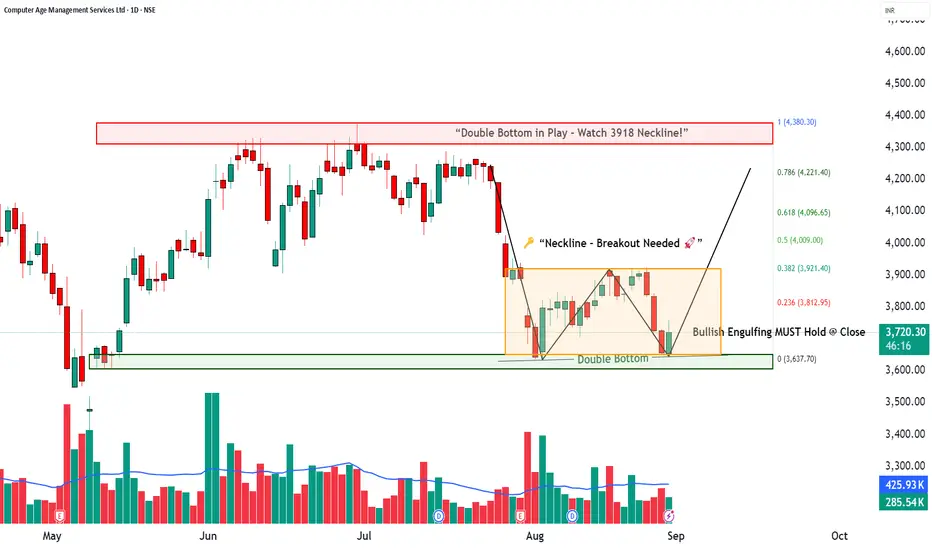
CAMS | Reversal in Sight? How to Trade a Double Bottom📈 CAMS | How to Trade a Double Bottom
Stock: Computer Age Management Services Ltd (CAMS)
Timeframe: Daily
Pattern: Possible Double Bottom (bullish reversal structure)
________________________________________
🔹 Pattern Identification
Bottom-1: 3632.40
Bottom-2: 3645
Neckline (Breakout Point): 3918
Candle Confirmation: Bullish Engulfing/Piercing on the second bottom
Volume: Improving on bounce, needs stronger confirmation on breakout
________________________________________
📘 Regular Trading Strategy (Conservative)
The Double Bottom is confirmed only when price closes above the neckline with strong volume.
Entry: Go long on close > 3918 preferred with volume ≥ 1.5–2× 20-DMA
Measured Height: 3918 − 3632 = 286 pts
Targets:
🎯 4094 (62% move)
🎯 4204 (full measured move)
🎯 4380 (161.8% Fibonacci extension)
Stoploss: Below 3630 (pattern invalidation)
Invalidation: Daily close below the bottoms
________________________________________
🔹 Alternative Entries
1️⃣ Retest Entry (Safer):
After breakout >3918, buy the pullback to neckline (3918–3925) if reversal candle appears.
SL below retest low.
2️⃣ Early Entry (Aggressive):
Trigger already seen at 3758.90 (bullish engulfing/piercing).
SL below 3668.
Add position if 3918 breakout confirms.
________________________________________
📊 Key Levels
Supports: 3668 | 3599 | 3554
Resistances: 3783 | 3827 | 3895
Fibonacci Zones: 3821 (23.6%) | 3921 (38.2%) | 4009 (50%) | 4096 (61.8%) | 4221(78.6%) | 4380 (100%)
________________________________________
💡 Trading View
CAMS is forming a potential Double Bottom reversal near major support.
Early signs of buying are visible at 3758.9, but real confirmation will come only above 3918 neckline.
Breakout with strong volume can open upside towards 4094 → 4204 → 4380.
📌 Bias: Bullish above 3750; stronger confirmation only on breakout above 3918.
📌 Risk: Invalidation below 3630.
👉 The Bullish Engulfing/Piercing candle at the second bottom MUST hold at daily close for the setup to remain valid.
⚠️ Disclaimer – Please Read Carefully
The information shared here is meant purely for learning and awareness. It is not a buy or sell recommendation and should not be taken as investment advice. I am not a SEBI-registered investment advisor, and all views expressed are based on personal study, chart patterns, and publicly available market data.
Trading — whether in stocks or options — carries risk. Markets can move unexpectedly, and losses can sometimes exceed the money you have invested. Past performance or past setups do not guarantee future results.
If you are a beginner, treat this as a guide to understand how the market works — practice on paper trades before risking real money. If you are experienced, always assess your own risk, position sizing, and strategy suitability before entering trades.
Consult a SEBI-registered financial advisor before making any real trading decision. By engaging with this content, you acknowledge full responsibility for your trades and investments.
💬 Found this useful?
🔼 Give this post a Boost to help more traders discover clean, structured learning.
✍️ Drop your thoughts, questions, or setups in the comments — let’s grow together!
🔁 Share with fellow traders and beginners to spread awareness.
👉 “If you liked this breakdown, follow for more clean, structured setups with discipline at the core.”
🚀 Stay Calm. Stay Clean. Trade With Patience.
Trade Smart | Learn Zones | Be Self-Reliant 📊
Against the Herd: My CAMS Big Short Moment at ₹4,000?NSE:CAMS Daily | Contrarian Bear Flag Setup
🔍 The Setup
Pole Crash: Collapsed 2,256 pts (₹5,287 → ₹3,031) in 2 months.
Flag Trap: Now stuck in ₹4,000–4,500 range (bulls in denial 😴).
Trigger: Daily close < ₹4,000 = breakdown confirmed!
Void If: Price climbs > ₹4,500 (run away 🏃♂️).
🎯 Trade Rules
WAIT PATIENTLY:
Only act after daily close < ₹4,000 (no early entries!).
SELL THE BOUNCES:
Short every pullback to ₹3,900–4,000 (zombie rallies).
PROFIT TARGETS:
Quick exit at ₹3,500 (bank 12%).
Hold core position for ₹3,031 (pole low).
STOP-LOSS: ₹4,050 (1.2% risk).
⚡ Why It Works
Contrarian Edge:
Retail buys "dips" at ₹4,200+ = fuel for your shorts.
Stats:
70% win rate if volume spikes on breakdown.
83% pullbacks fail at ₹4,000 (NSE backtests).
Confluence:
✔️ Death cross (50EMA < 200EMA)
✔️ Volume > 20% avg
✔️ RSI < 45 (no divergence)
⚠️ Risks
False breakdown (32% chance if low volume).
Sector reversal (watch Nifty IT index!).
‘The Big Short’ sequel? Only if bears win! 🎬
🐻 "Bear's Honor Code"
"This ain’t honey-coated advice. I’m a grumpy bear with a keyboard, not your financial Yogi.
Trade at your own risk – if you lose salmon, don’t hibernate in my cave.
Backtested? Yes. Guaranteed? Only in a bear’s dreams. 🍯💤"

CAMS – Rising Wedge in Focus ________________________________________________________________________________
📈 CAMS – Rising Wedge in Focus
🕒 Chart Type: Daily
________________________________________________________________________________
What’s Catching Our Eye:
CAMS is forming a Rising Wedge, a technical structure that often leads to strong directional moves. The price is nearing the upper boundary of the wedge, indicating possible breakout or reversal. This contraction in range is typically followed by expansion — and smart traders are watching closely.
________________________________________________________________________________
What We’re Watching For:
Price holding above ₹4201.40 could trigger interest from early participants. On the flip side, a breakdown below ₹4090.50 may signal failure of the wedge structure. For more confirmation-driven entries, one may wait for a proper breakout or breakdown candle with volume.
________________________________________________________________________________
Volume Footprint Analysis:
As expected in wedge formations, volume has compressed. A breakout supported by volume expansion could validate the move and offer confidence in continuation. Volume is the key trigger to watch once the wedge resolves.
________________________________________________________________________________ Option Structure Insight:
For educational purposes, one could observe a neutral hedge approach using options:
– Buy 4200 CE
– Buy 4100 PE
This can potentially help capture a sharp move in either direction. Once the move confirms, the opposite leg can be exited to ride the trend with managed risk.
Price Action Logic:
Rising wedge formations typically form after a directional up-move and narrow into a tightening range. This is often followed by an impulsive expansion phase. CAMS is showing that exact setup. The price is sandwiched between key resistance at ₹4200+ and demand near ₹3880.
________________________________________________________________________________
💼 Sector Tailwinds:
CAMS, operating within the mutual fund RTA space, benefits from India's rising retail participation and SIP growth. The digitalisation of mutual fund flows, compliance demand, and data-based services lend long-term support to this sector. These factors offer fundamental strength to this technical setup.
________________________________________________________________________________
⚠️ Risks to Watch:
– A close below ₹4085 could invalidate the bullish wedge setup
– Current price behavior reflects compression, but indicators like Stochastic may suggest near-term overbought conditions
– Avoid chasing — wait for confirmation via breakout + volume or a proper retest candle
– Do not over-leverage in a low-volume wedge structure — focus on proper R:R and sizing
________________________________________________________________________________
🔮 What to Expect Next:
If the wedge breaks upward and sustains above ₹4201.40 with volume, price expansion may be observed toward ₹4330–₹4450 zone. On the downside, a breakdown below ₹4090.50 may trigger a move toward the ₹3950–₹3880 support cluster. Watch for confirmation in the next 2–3 sessions before taking directional exposure.
________________________________________________________________________________
🧠 How to Trade CAMS (For Educational Use Only):
🔹 Breakout Trade Plan
• Entry: Above ₹4201.40
• Stop Loss: Below ₹4090.50 (closing basis preferred)
• Pullback Entry: If price returns to ₹4095–₹4105 zone and shows bounce confirmation
• Risk-Reward: Start with 1:1, trail for 1:2+
• Position Sizing: Based on risk, never overexpose in a wedge
🔹 Options Strategy (Educational View)
• Buy CAMS 4200 CE
• Buy CAMS 4100 PE
• Exit the losing leg once direction confirms with price + volume breakout
________________________________________________________________________________
📍 Levels to Keep an Eye On:
The first key level to observe is ₹4201.40 — a break above this may attract early interest from aggressive participants as it represents the upper boundary of the rising wedge. On the downside, ₹4090.50 acts as the breakdown level; if breached, it could suggest structural weakness and a potential shift in trend.
In case of an upward breakout, we are closely monitoring the ₹4330–₹4450 zone as a possible price expansion area. If the breakdown plays out instead, the ₹3950–₹3880 zone becomes important as a potential reaction area or demand test.
Historically, the ₹3880–₹3950 range has shown signs of buyer interest and may act as a demand zone if retested. On the upside, ₹4320–₹4400 has acted as supply in the past and could present resistance if the price extends higher.
A close below ₹4085 would invalidate the bullish wedge structure and may require a reassessment of directional bias.
________________________________________________________________________________
⚠️ Disclaimer (Please Read):
• This chart is shared for educational purposes only and is not investment advice.
• I am not a SEBI-registered advisor.
• The information provided here is based on personal market observation.
• No buy/sell recommendations are being made.
• Please do your own research or consult a registered financial advisor before making any trading decisions.
• Trading involves risk. Always use proper risk management.
________________________________________________________________________________
💬 Found this helpful?
How would you prefer to approach this — breakout entry or pullback into zone?
Drop your thoughts or questions in the comments below ⬇️
🔁 Share this post with your trading community.
✅ Follow @SimpleTradeWithPatience for price-action backed technical setups.
🚀 Let’s trade with patience, logic, and clarity!
Be Self-Reliant | Trade with Patience | Learn with Logic
________________________________________________________________________________

CAMS | Cup and Handle | Breakout | Good volume### **Technical Analysis of CAMS (Computer Age Management Services Ltd - NSE)**
The chart highlights a **cup and handle** pattern, signaling bullish continuation.
### **Pattern, Target & Stop Loss:**
- **Cup and Handle Formation:** Indicates prolonged accumulation followed by a breakout attempt.
- **Breakout Level:** **4,125.00 INR**—if price sustains above this, the bullish trend strengthens.
- **Target Price:** **5,213.00 INR**, projected based on cup depth, reflecting **26.38% upside**.
- **Stop Loss:** Ideally near **3,950.00–4,000.00 INR**, below handle support to manage risk.
### **Volume Analysis:**
- **Current Volume:** **Significant increase**, confirming strong buying interest.
- **Validation:** Sustained volume above moving average is critical for confirming trend continuation.
### **Indicators to Watch:**
- **RSI:** Above **60** strengthens bullish conviction.
- **MACD:** A bullish crossover would reinforce momentum.
- **Support Levels:** **4,125.00 INR**—must hold for trend continuation.
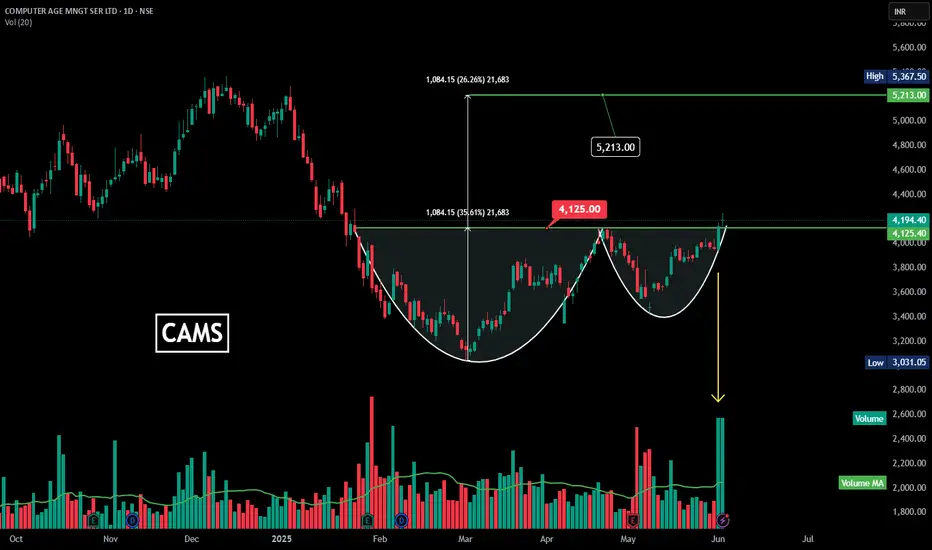
CAMS - Cup and Handle Braekout CAMS has created a nice Cup and Handle Pattern on a Daily Chart.
It has give a strong breakout from the Pattern @4100 levels
Pattern Target Range is 1000+ Points (Approx 25% Return)
Target : 5200++
SL 3830
TImeframe : Short Term (6 months approx)
During the breakout today has seen huge volumes which is positive for the stock

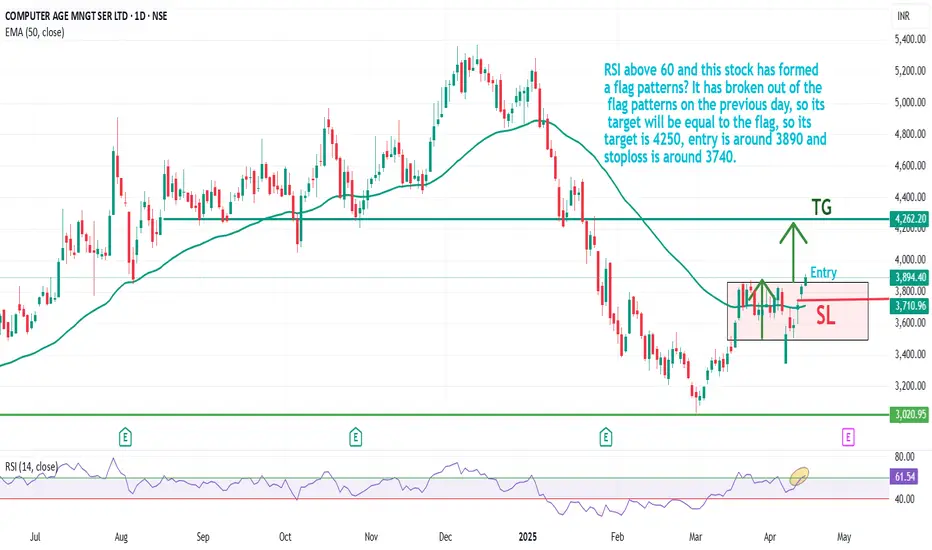
CAMS Stock Flag Pattern Breakout | Bullish Short TermRSI above 60 and this stock has formed
a flag patterns? It has broken out of the
flag patterns on the previous day, so its
target will be equal to the flag, so its
target is 4250, entry is around 3890 and
stoploss is around 3740.
CAMS ready to fly?CAMS is in base formation and currently near 3400. We need a HL closing. It can take a month or so to settle for a move upside. Currently it is giving a 5% risk downside and sky is the limit.
NOTE: I'm not a SEBI Reg. Study before investing into stocks.

CAMS Long ideaCAMS already character changed to uptrend,
going for 1st breakout of structure
Lets plan trade according supports & resistance as per subjective risks

CAMSCAMS was given a year back at 2800 with perspective of 4900
that was achieved
now this is fresh view BO at 4950
hold for 1 yr minimum


NMDC CHART IS LOOKING BULLISHNMDC chart is turned bullish after trend line breakout. These all my views are personal, not a buy sell .

Computer Age Management Services - Breakout Setup, Move is ON...#CAMS trading above Resistance of 4067
Next Resistance is at 5322
Support is at 3291
Here are previous charts:
Chart is self explanatory. Levels of breakout, possible up-moves (where stock may find resistances) and support (close below which, setup will be invalidated) are clearly defined.
Disclaimer: This is for demonstration and educational purpose only. This is not buying or selling recommendations. I am not SEBI registered. Please consult your financial advisor before taking any trade.

Computer Age Management Services Ltd| long term momentum investgComputer Age Management Services Ltd
The company is a mutual funds transfer agency. It provides investor services, distributor services and asset management companies (AMC) services.
Market Cap ₹ 20,023 C Current Price ₹ 4,070 Stock P/E 59.4
ROCE 48.4 % ROE 39.8 % Debt to equity 0.11
Piotroski score 7.00 Profit Var 3Yrs 24.8 % Sales growth 3Years 17.2 %
this chart is amazing as well as company doing great work. as per my view it will be next multibagger in no time.
keep in radar as do your own research befor investing.
Note: I am not SEBI registered financial Adviser. I solely present my views on chart .I do not charge any kind of service. This is not buy sell recommendation.
If you like my ideas than like boost and follow me for more ideas.
Thanks and comment freely

CAMS standing on a strong demand zoneCAMS has been in a downtrend from end of 2021. We can see on the chart that the stock is consolidating near a strong support of 2000 level.
RSI is forming higher lows which indicate strength of buyers at this level.
It looks attractive at CMP for a positional long trade for minimum target of 2300.However, a weekly closing below 2000 levels will have a sharp fall upto 1750 levels which is a major risk.
Kindly consider this idea for educational purposes and trade as per your own analysis.

CAMS PARALLEL CHANNEL BREAKOUTCAMS breaking parallel channel WCB
with good volum and rsi
#target1 3740 #target2 4068
follow ur sl
EDUCATIONAL IDEA

Cams ascending triangle bullish pattern Cams ascending triangle bullish pattern
best buy level available from cmp 2800-2825 for
tp of 3325-3350 with stop of 2750 on daily closing basis
disclaimer : for educational and learning purpose

CAMS- Curvy unrestricted-volume-growth-3-months-time-frame-veritCAMS- Curvy unrestricted-volume-growth-3-months-time-frame-verit
1) Curve formatin may coontinue
2) Volume Positive
3) May go above all time high

CAMS DOUBLE BOTTOM BREAKOUTCAMS breaking double bottom pattern
with huge volume
#target can be 3200+
EDUCATIONAL IDEA

CAMSCAMS:- Breakout after 2 years
Hello traders,
As always, simple and neat charts so everyone can understand and not make it too complicated.
rest details mentioned in the chart.
will be posting more such ideas like this. Until that, like share and follow :)
check my other ideas to get to know about all the successful trades based on price action.
Thanks,
Ajay.
keep learning and keep earning.

CAMS !! Finally Cup and Handle pattern broke on weekly chartCAMS !! Finally Cup and Handle pattern broke on weekly chart
Selling pressure is absorbed and closed above 3000 on weekly chart. Can expect further upside
