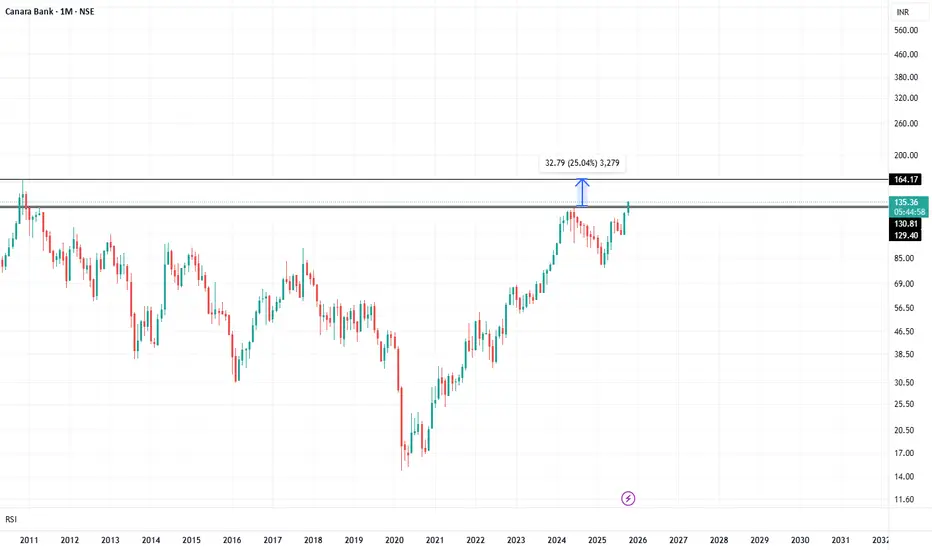
Canara Bank cmp 154.87 seen by the Monthly Chart view since listCanara Bank cmp 154.87 seen by the Monthly Chart view since listed
- Support Zone 129 to 142 Price Band
- Resistance Zone 155 to ATH 164.22 Price Band
- Bullish Cup and Handle Breakout done above Support Zone
- Stock Price ready for New ATH beyond current ATH 164.22 level
- Double Bullish patterns of Rounding Bottom inclusive of Cup and Handle
- Basis both Technical Chart patterns, the logical target price comes to +/- 300
Canarabank

Canarabank - Short Term BuySImple Technical Analysis.
Multiple PSU stocks are forming Flag&Pole pattern.
Canarabank - Hovering around Prev ATH.
Pattern BO will lead to 139.
Prev High Breakout will lead the Stock to 139/143/152/169.
Target Levels Based on Pattern target and Fibonocci Levels

CANARA BANK ANALYSISTHIS IS MY CHART OF THE WEEK PICK
FOR LEARNING PURPOSE
CANARA BANK- The current price of CANARA BANK is 136.99 rupees
I am going to buy this stock because of the reasons as follows-
1. It made a 15 year high by breaking avery strong resistance and volume is good too.
2. It got a great buying force and moved up by 760% from COVID lows till June 2024(which clearly shows smart money)
3. It is showing better relative strength as it stood strong in volatile times including last few weeks.
4. The risk and reward is favourable. The good part- It got a great consolidation before breaking out.
5. The stock can do great if it breaks its ATH resistance around 165 rupees.
6. The stock has got a good catalyst and that is- Mutual Funds have increased their stake in this stock. Also, FIIs have increased very small stake.
7. Another good part- The sector is looking bullish. Banking sector is getting better.
I am expecting more from this in coming weeks.
I will buy it with minimum target of 35-40% and then will trail after that.
My SL is at 117.65 rupees.
I will be managing my risk.

#CANBK looking bullish on monthly timeframe#CANBK has given a breakout at 131 on a monthly timeframe. Upside potential: 25%+ (i.e. 164 which is the stock's all-time high). Stop loss: 127. A few things to note:
The sector is bullish. NIFTY PSU BANK recently gave a breakout at 8070
The stock is undervalued at a PE ratio of under 7. Company has delivered good profit growth of 61.0% CAGR over last 5 years
This is not a buy/sell recommendation. Research carefully and invest at your own risk.
CANARA BANK BREAKOUTCANARA BANK
ADD ON YOUR WATCHLIST
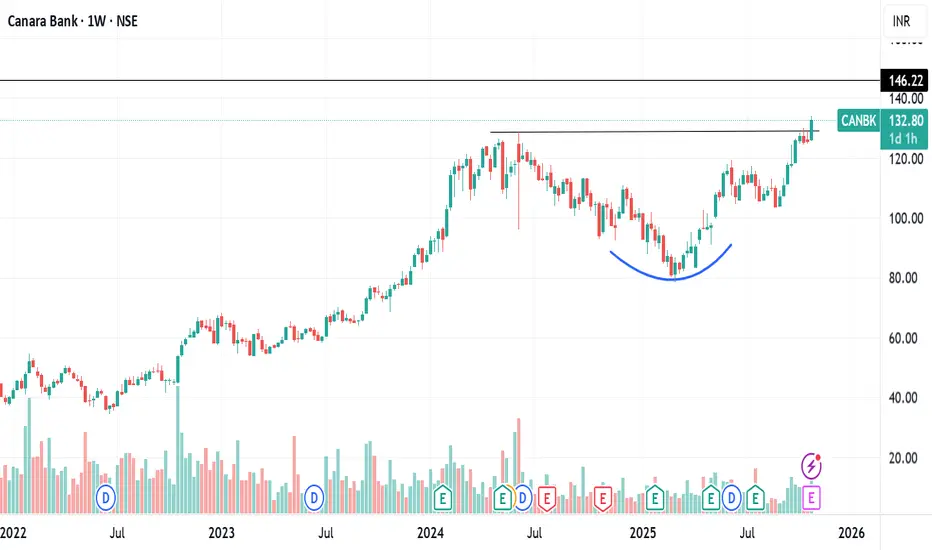
If you see in the chart, the rounding pattern has broken out and it is in the weekly time frame
You can buy at Rs 125 and go up to the target of 146 and 163. The Stop-loss can be kept at 117.50
Note: Our posts are posted for learning purposes. You are responsible for any profit or loss you make from the advice given in the channel. Before investing in the stock market, you must consult your financial advisor.
WE ARE NOT A SEBI REGISTERED

CANARA BANK ROUNDDING PATERN BREAKOUTCANARA BANK ( W )
ADD ON YOUR WATCHLIST
If you see in the chart, the rounding pattern has broken out and it is in the weekly time frame
You can buy at Rs 125 and go up to the target of 146 and 163. The stop loss can be kept at 117.50
Note: Our posts are posted for learning purposes. You are responsible for any profit or loss you make from the advice given in the channel. Before investing in the stock market, you must consult your financial advisor.
WE ARE NOT A SEBI REGISTERED

CANARA BANK ROUNDING BOTTOM BREAKOUTCanara bank breaking rounding bottom weekly
with huge volume this week
RSI above 60 bullish
heading towards 15 yr high
q2 net profit rises 19% +ve
target 146 then can lead to ATH 164 also
NO BUY/SELL RECOMENDATION
Canara Bank (CANBK)Breakout above ₹119.50 with strong volume confirms momentum.
Entry Zone: Near breakout (₹119.50–122)
Stoploss: ATR-based, just below breakout (~₹116)
Targets: ₹129.40 → ₹136.40 (Fib extension)
Macro Drivers:
Hopes of RBI rate cuts after Fed dovish stance
Stronger economic data supporting financials
Robust domestic credit growth
GST boost to liquidity
PSU Bank sector leadership
👉 Setup looks solid for continuation, provided volumes sustain.

A Rally Born in Silence: The Canara Bank SetupCanara Bank – Multi-Timeframe Impulse Reloaded
On the 3-month timeframe, Canara Bank is staging what looks like a textbook long-term Elliott Wave impulse. With Wave (IV) bottoming out around ₹15.15 and a roaring rally taking us into Wave (V), the broader structure suggests that this could be the start of a generational uptrend, aiming toward the 2.618 extension near ₹206.
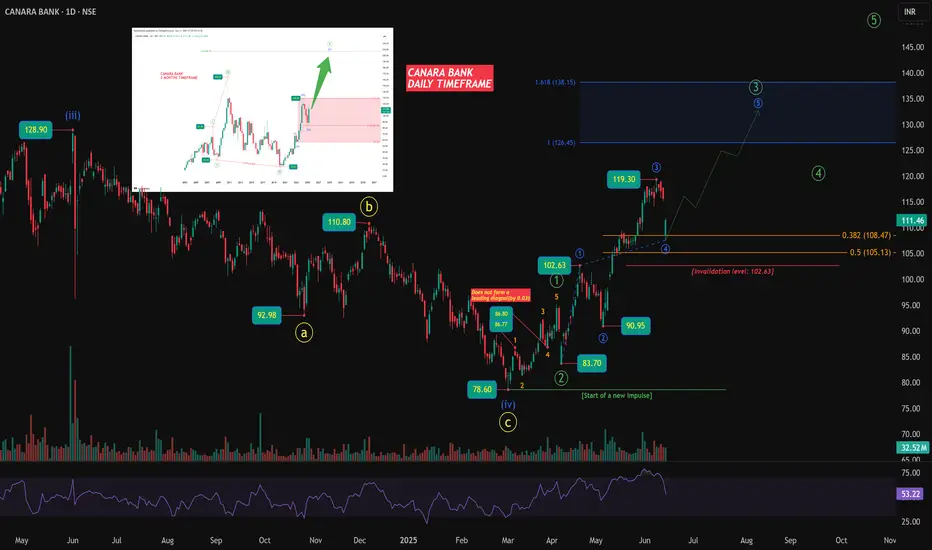
Dropping down to the daily chart, things get even more compelling. The move off the March 2025 lows at ₹78.60 is showing all the signs of a fresh impulsive structure. That low aligns precisely with the higher-degree Wave (IV), suggesting the beginning of Wave (V) is already underway. What’s particularly interesting is how the current rally is unfolding — the green Wave 3, which started from ₹83.70, appears to be extending. It has already subdivided into a clean internal five-wave structure, with blue subwaves 1 through 4 in place and blue wave 5 in progress.
This kind of extended third wave is not only typical but often the most powerful part of the move, carrying the strongest momentum. The current wave is aiming toward the 1.618 projection zone around ₹138, which would be a fitting cap for an extended third. Once this fifth subwave of green 3 completes, a corrective green Wave 4 would be due, likely shallow given the strength of the third wave, followed by one final push in green 5.
On the risk side, the structure remains intact as long as price holds above ₹102.63 — the invalidation level for the current count. A break below would suggest the impulse failed and could force a reassessment of the bias. Until then, both the short-term and long-term wave counts remain firmly aligned to the upside, with momentum backing the structure on multiple timeframes.
Chart will be updated as price action evolves.
Disclaimer: This analysis is for educational purposes only and does not constitute investment advice. Please do your own research (DYOR) before making any trading decisions.
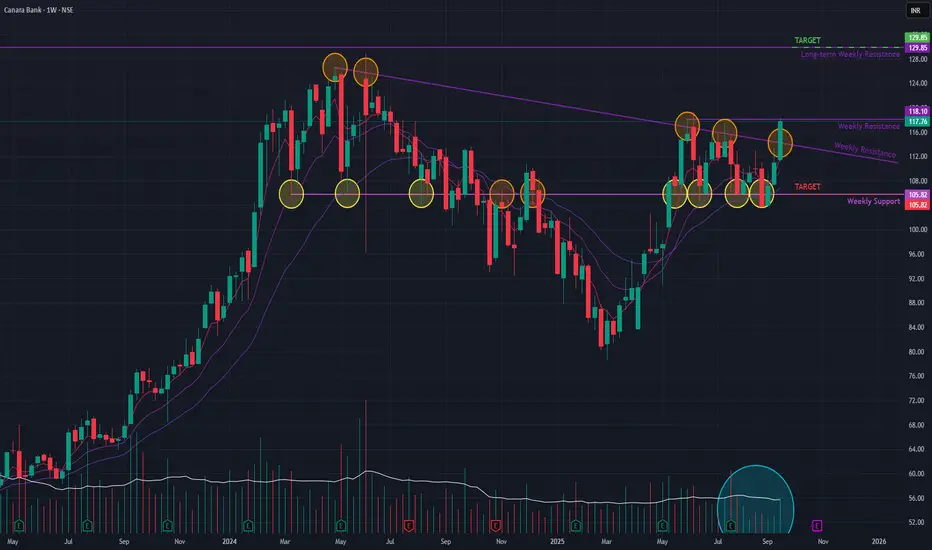
Canara Bank (Weekly) - Will it BreakOut of sideways trend??Canara Bank has demonstrated a significant bullish development this week, breaking out of a key angular resistance trendline . This move was validated by a strong increase in trading volume and a notable +6.13% price surge , signaling renewed buyer interest.
This breakout occurs after a period of sideways consolidation that has been in place since May 2025. This consolidation phase followed a corrective downtrend that lasted from June 2024 to March 2025, which itself came after a multi-year rally that began in October 2020.
Bullish Indicators Supporting the Move 👍
Several technical factors support a positive outlook:
- Volume Confirmation: The breakout was accompanied by a healthy surge in trading volume , indicating strong conviction behind the move.
- Momentum: Short-term Exponential Moving Averages (EMAs) have entered a positive crossover , a classic signal of building upward momentum.
The Immediate Hurdle Ahead 🚧
Despite the positive signs, the stock is currently trading just below a short-term resistance level . A decisive move above this immediate barrier is required to confirm the continuation of the uptrend.
Future Outlook and Key Levels
The price action in the upcoming week will be crucial. Two primary scenarios exist:
- Bullish Case 📈: If the stock successfully breaks and holds above the current short-term resistance, the path could be clear for a rally towards the next major resistance zone at ₹129 .
- Bearish Case 📉: If the upward momentum fails and the stock is rejected at this resistance, it could pull back towards the support level of ₹105 .
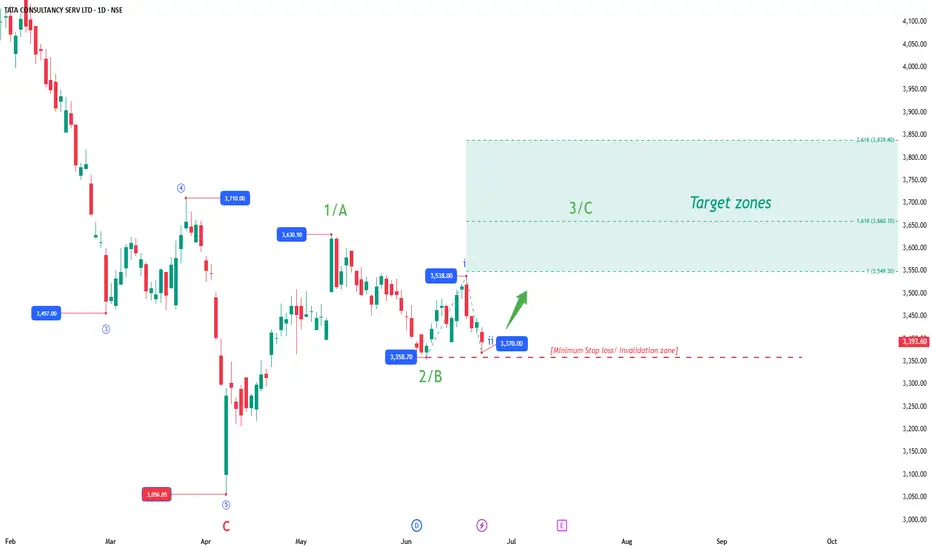
Low-Risk Entry Zones Emerging in TCS and CANARA BANKTCS - Potential Nested 1-2 / 1-2 Setup
After completing a higher-degree corrective phase, TCS has likely begun a new impulse sequence. The structure so far suggests a nested 1-2 / 1-2 setup:
Higher-degree Wave 1 peaked near 3630.50, followed by a corrective Wave 2 into 3358.70.
Inside the new sequence, minor wave i topped at 3538.00, with a minor wave ii correction down to 3370.00.
This leaves the door open for a sharp upside move if the structure unfolds as a Wave 3 acceleration phase. The invalidation for this scenario remains tight below 3358.70 . As long as price holds above this level, the nested setup remains intact with Fibonacci projection targets at:
3549 (1.0x)
3660 (1.618x)
3839 (2.618x)
Risk Management Note:
The tight invalidation allows for a favorable risk-reward profile. If price breaks below 3358.70, the nested count would be invalidated and a larger degree corrective structure may still be unfolding.
CANARA BANK - Impulse in Progress with Minor Wave 5 Pending
CANARA BANK presents a slightly different but equally interesting structure. Here, we observe a clean five-wave impulse unfolding from the March low of 78.60:
Major Wave 1: 95.19
Major Wave 2: 83.70 (deep but typical retracement)
Minor Wave 1: 102.63
Minor Wave 2: 90.95
Minor Wave 3: 119.30 (strong extension)
Minor Wave 4: 104.60 (respecting 50% retracement of Minor 3)
Price is now in the early stages of Minor Wave 5, which could complete the larger degree Wave 3. Fibonacci projections for the higher degree Wave 3 stand between 123.5 and 135.2.
Risk Management Note:
The invalidation for the immediate setup lies below 104.60. As long as this level holds, the path higher remains favored.
Summary:
Both TCS and CANARA BANK are showcasing clean Elliott Wave setups with well-defined invalidation zones. Traders following these patterns should monitor the invalidation levels closely, as failure to hold these zones will require a reassessment of the wave counts. However, while price respects these structures, the potential for sharp impulsive advances remains on the table.
Disclaimer: This analysis is for educational purposes only and does not constitute investment advice. Please do your own research (DYOR) before making any trading decisions.
Big Bank BREAKOUT! Canara Bank Ready📉 Breakdown of the Setup:
✅ WTF CT (White Lines): 3+ confirmed touches → clean descending counter-trendline.
✅ Hidden Resistance (Dotted White Line): Clear breakout above key hidden level. Historic reaction zone.
✅ MTF Resistance (Yellow Line): Long-term resistance just above; nearing test zone (confluence resistance area ahead).
✅ Green Zone (Support/Resistance Flip):
Acted as strong support in 2024.
Fake breakdown trap ✔️
Price back above = bullish bias reinstated.
✅ Volume Surge: 124M+ on breakout candle ➕ major bullish close.

Canara Bank At Resistance LevelCurrent Price and Trend (as of May 5, 2025)
Closing Price: ~₹97.00–97.12 (based on recent data, with slight variations across sources).
Recent Performance:
Down 2.56% over the last 5 days and 3.27% year-to-date.
Up 7.58% over the past month, indicating short-term upward momentum.
Trend: The stock is in a medium-term downtrend since June 2024 but has shown signs of stabilisation and short-term bullishness. It is trading near a key resistance level of ~₹97–99
Can Go down till next support level 69 - 62
Chart for your reference

CANARA BANK#CANBK
Canara Bank is showing strong potential,especially with the PSU Banking Index
nearing a breakout on the upside. A break above this trendline could signal
a prime opportunity to add Canara Bank to your portfolio. Investors and positional
traders may consider entering at the current levels,
as the PSU banking sector has been in a correction phase
for nearly a year and now appears ready for a rally.
This setup makes Canara Bank an attractive choice for those
seeking to benefit from the anticipated upside in the PSU banking stocks.

BOB | Trendline Bull Breakout ⭕️ Swing Trading opportunity: Price Action Analysis Alert !!!⭕️
💡✍️Technical Reasons to trade or Strategy applied :-
✅Triangle Chart Pattern Bull Breakout
✅Breakout confirmed
✅Rise in Volume
✅Good 3 touches Trendline Breakout with volume
✅Clear uptrend with HH & HLs sequence
✅ Order block as potential Target
✅Check out my TradingView profile to see how we analyze charts and execute trades.
🙋♀️🙋♂️If you have any questions about this stock, feel free to reach out to me.
📍📌Thank you for exploring our idea! We hope you found it valuable.
🙏FLLOW for more !
👍LIKE if useful !
✍️COMMENT Below your view !

STOCK SPLIT MOVECanara Bank set for 5/1 stock split on15th May and seems like the stock is preparing for some move.

Is Canara bank ready to moveHey Family, there is a one more stock Which is showing a great opportunity and formed a good pattern, Stock break resistance zone and retest resistance zone, let's see breakout sustain or not. what is your view please comment it down. We are Certified. All views shared on this channel are my personal opinion and is shared for educational purpose and should not be considered advise of any nature

CANARA BANK LONG TRADEGood to buy CANBK @306-310
Stop Loss : 290
Targets : 320/340/360/400max+++
CANBK is taking good support from the trendline. Good breakout of Bearish trend in longer Timeframe.
Thanks.
Disclaimer: This idea is only for the Educational purpose. Trade at your own risk.
If you like the idea kindly support.

Canara Bank on verge of breaking down inverted flag patternCanara Bank on verge of breaking down inverted flag pattern. On breakdown, one may consider shorting.
This is not an investment advice.

Canara BankA confluence of the 2017 high and PF line at 463.70 makes this price very important.
On rejection of this, we can see a deep correction in the prices at least till 448 and 424 (long term)
On breakout of this resistance, I am buying the stock for a target of 484.40 as the immediate target and 520 in the longer term.

CANARA BANK - Ready for a high jump#CANBK
CMP : ₹.403/-
Date 30-11-23
The third largest PSU bank among public sector banks with good quarterly results. Revenue & profits are increasing on QoQ basis with decent margin. Now it's in a breakout point . A6 year long round bottom have been completed and waiting for an explosion along with the breakout from triangular channel of 2 years old. Good point for accumulation now. Ready for high jump. Potential days are ahead. Expecting 50% movement within 3-6 months time. Stoploss @ ₹.375/-
Disclaimer : Post only for educational purpose. Not a buying / selling recommendation. This is only my personal view. I am not a SEBI registered analyst . Do your own analysis and act accordingly .

CANARA BANK INVERSE H&S BREAKOUTCanara bank breaking inverse h&s pattern
good volume and RSI
trading above 20ema
psu is on boom
educational idea only

Canara bank analysis Stock has given strong BO on daily chart with massive volume spike, also in H-H pattern with supportive Trendline, follow chart for proper support and resistance levels.
