Candle Patterns Basics of a Candlestick
Each candlestick represents price movement for a specific time period (1 minute, 1 day, 1 week, etc.). A candlestick has four key components:
Open – Price at the beginning of the period
Close – Price at the end of the period
High – Highest price during the period
Low – Lowest price during the period
Candlestickanalisys

Candlestick Patterns in Trading
Candlestick patterns are one of the most widely used tools in technical analysis for traders across all markets, including stocks, forex, commodities, and cryptocurrencies. They provide visual insights into market psychology by representing price action over a specific period of time. Understanding these patterns allows traders to anticipate potential market reversals, continuations, and indecision.
1. Understanding Candlesticks
A candlestick consists of four key price points:
Open Price – The price at which trading begins for the selected timeframe.
Close Price – The price at which trading ends for that timeframe.
High Price – The highest price achieved during that period.
Low Price – The lowest price achieved during that period.
The body of the candlestick is formed by the open and close prices. If the close price is higher than the open, the candle is bullish (often colored green or white). Conversely, if the close is lower than the open, the candle is bearish (often red or black). The lines above and below the body are called shadows or wicks, representing intraday highs and lows.

Real Knowledge of Candle Patterns Types of Candlestick Patterns
Candlestick patterns fall into three groups:
1. Reversal Patterns
Signal a potential change in trend.
2. Continuation Patterns
Indicate the trend will likely continue.
3. Indecision Patterns
Show lack of conviction and potential upcoming moves.

Part 2 Introduction to Candlestick PatternsA. Call Options
A call option gives you the right to buy an underlying asset at a predetermined price within a specified time.
You buy a call option when you expect:
➡ The price of the asset will go up.
Example:
Nifty is at 22,000.
You buy a 22,000 CE (Call European) at a premium of ₹100.
If Nifty rises to 22,400, your call becomes more valuable, and you profit.
B. Put Options
A put option gives you the right to sell an underlying asset at a predetermined price within a specified time.
You buy a put option when you expect:
➡ The price of the asset will go down.
Example:
Bank Nifty is at 47,000.
You buy a 47,000 PE (Put European) at ₹120.
If Bank Nifty falls to 46,500, the put becomes more valuable.

Part 1 Introduction to Candlestick PatternsWhat Are Options?
Options are financial contracts that give you the right, but not the obligation, to buy or sell an underlying asset (like a stock, index, commodity, or currency) at a specific price, called the strike price, before a fixed date known as expiry.
There are two types of options:
1. Call Options – Right to buy
2. Put Options – Right to sell
Options derive their value from the underlying asset; that’s why they are called derivatives.
Unlike stocks, options have a limited lifespan. They expire weekly, monthly, or quarterly depending on the market.

Real Knowledge of Candle patterns Candlestick patterns reflect the most important element in trading—market psychology and momentum. Each candle represents:
Open price
High
Low
Close
Candles show emotions like greed, fear, indecision, manipulation, and momentum.
Candlestick patterns can be categorized as:
1. Reversal Patterns
2. Continuation Patterns
3. Indecision Patterns
1. Reversal Candlestick Patterns
-Bullish Reversal Patterns
Hammer
Morning Star
Bullish Engulfing
Piercing Line
Dragonfly Doji
-Bearish Reversal Patterns
Shooting Star
Evening Star
Bearish Engulfing
Dark Cloud Cover
Gravestone Doji

Candle Patterns Most Common Candle Pattern Traps
Market makers often create fake patterns to trap retail traders.
1. Fake breakouts with long wicks
2. False engulfings inside noisy ranges
3. Pin bars created by stop-loss hunting
4. Inside bars before false breakout
Avoid trading patterns formed:
At random zones
Without volume
Against trend

Candle Patterns Candlestick charts represent price movement in a visually intuitive way. Each candle shows:
Open
High
Low
Close
The color (green or red) indicates bullish or bearish sentiment. Patterns form when candles combine to express a strong market bias.
Why Candle Patterns Matter
They show real-time market sentiment
Provide early entry signals
Indicate trend continuation or reversal
Help identify trap candles and false breakouts
Crucial for Volume Profile & Market Structure traders to read participant behaviour
Candlestick patterns are classified into:
A. Bullish Reversal Patterns
B. Bearish Reversal Patterns
C. Continuation Patterns
D. Indecision / Neutral Patterns

Real Knowledge of Candle Patterns CANDLESTICK PATTERNS (Price Action Signals)
Candlesticks reflect short-term price behavior and trader psychology. Each candle shows:
Open
High
Low
Close
Patterns range from single candle to multi-candle structures.
Candlestick patterns show reversal, continuation, or indecision in the market.
Let’s explore major categories.

Candle Patterns 🔹 What Are Candlestick Patterns?
Candlestick patterns are formed by one or more candles on a price chart. Each candle shows:
Open price
High price
Low price
Close price
Candlestick patterns reflect the battle between buyers and sellers within a specific time frame.
🔸 Structure of a Candlestick
Body – Distance between open and close
Wick / Shadow – High and low prices
Bullish Candle – Close > Open
Bearish Candle – Close < Open

XAUUSD Short AnalysisAnticipating Shorts on XAUUSD
Gold has already been at its major resistance point, rejecting the upper resistance point multiple times.
Looking forward for a bearish push on gold with both short and long term PoV's as described in the chart.

Components of a Candle (Body, Wick, High, Low)Types of Candlestick Patterns
Candlestick patterns are broadly divided into:
A. Single Candlestick Patterns
Formed by just one candle.
B. Double Candlestick Patterns
Formed by two-candle combinations.
C. Triple Candlestick Patterns
Formed by three-candle combinations.
Let’s dive into each category in detail.

Real Knowledge Of Candle Patterns Candlestick Patterns in Reversal Trading
Reversals are powerful when:
Patterns appear on key levels
Trend is exhausted
Volume divergence occurs
Examples:
Morning Star at support
Shooting Star at resistance
Engulfing candles at major swing points
Combining Candles with Indicators
Although candles alone are powerful, combining them with indicators increases win probability.
Best indicators:
RSI for overbought/oversold
Volume Profile / Market Structure
MACD for momentum shift
Moving averages for trend direction

Cadnle Patterns Mistakes Traders Make With Candle Patterns
Mistake 1: Trading Every Pattern
Not every hammer means buy; not every engulfing means reversal.
Mistake 2: Ignoring the Trend
Trend is king. Patterns against trend are less reliable.
Mistake 3: No Confirmation
Waiting for confirmation improves accuracy.
Mistake 4: Overlooking Market Structure
Support/resistance is more powerful than candle patterns.
Mistake 5: Using Candles Alone
Combine with other tools for best results.

Candle Patterns Candlestick patterns are one of the most valuable tools for traders. They visually represent the battle between bulls and bears and reveal hidden clues about upcoming market movements. Whether you're trading intraday, swing, or positional, these patterns help spot reversals, continuations, breakouts, and exhaustion points.
But remember: Candle patterns are most powerful when combined with trend analysis, support/resistance, volume, and market structure. Mastering them takes practice, but once you internalize their psychology, you can interpret charts with much more confidence and precision.

Candle Patterns Limitations of Candlestick Patterns
They do not predict exact price targets.
False signals occur during high volatility.
Requires combining with other tools for accuracy.
Works less effectively in extremely choppy markets.

Candle Patterns ExplainedCandlestick patterns are one of the most powerful tools in technical analysis. They visually capture the battle between buyers and sellers and show you who is in control of the market at any moment. Each candle represents the market psychology of that particular timeframe—fear, greed, rejection, aggression, and hesitation. When you learn to read candles correctly, you understand the story behind price, not just the price itself.
A single candlestick is made up of four important points: Open, High, Low, and Close (OHLC). The body of the candle represents the distance between open and close. The wicks (also called shadows) show the highest and lowest points reached during the candle. Bullish candles close higher than they open, while bearish candles close lower than they open.
Candle patterns are broadly divided into three categories: Single-candle patterns, Double-candle patterns, and Triple-candle patterns. Each type gives different signals about trend continuation, reversal, or market indecision.

Real Knowledge of Candle Patterns Candlestick patterns are one of the most important tools in technical analysis. They help traders understand price movements, market psychology, and potential trend reversals or continuations. Each candlestick represents a battle between buyers (bulls) and sellers (bears). When you observe many candles together, you see patterns that reveal shifts in momentum. These patterns have been used for centuries—originating in Japan—and remain powerful even in modern algorithmic markets.
To understand candlestick patterns, you must first understand the candle structure. A candlestick has four major price points:
Open – the price at which the candle starts
Close – the price at which the candle ends
High – the highest price reached during the candle
Low – the lowest price reached during the candle
If the close is higher than the open, the candle is bullish (typically green or white). If the close is lower than the open, the candle is bearish (typically red or black). The body shows the open-close range, and the wicks (shadows) show the high-low range.

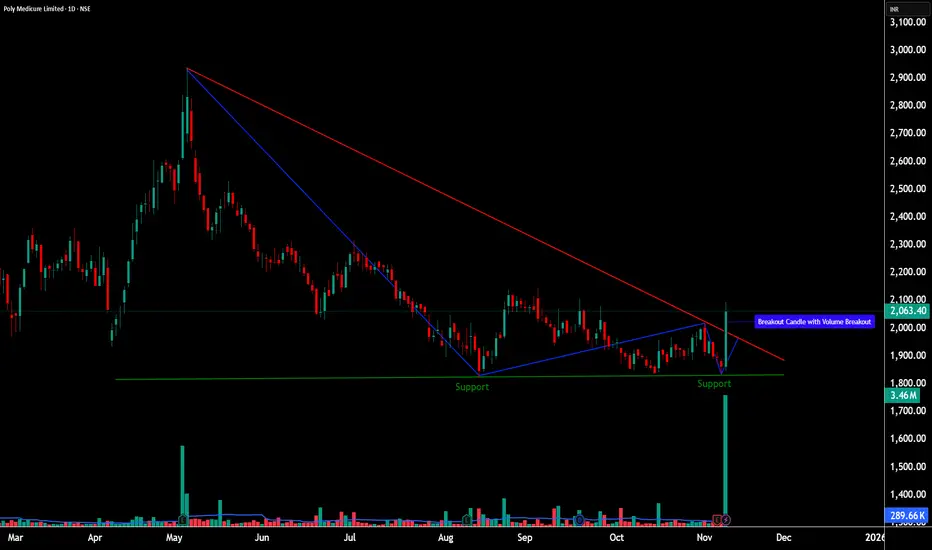
POLYMED - Breakout from Descending Triangle with Volume💹 Poly Medicure Ltd (NSE: POLYMED)
Sector: Healthcare & Diagnostics | CMP: ₹2,063.40 | View: Descending Triangle Breakout + 52-Week Volume Expansion
📊 Price Action
Poly Medicure finally broke out from a six-month descending structure with a sharp bullish candle. The move came after sustained compression near ₹1,800–₹1,850 support and resulted in a clean trendline breakout with the highest daily volume of the year.
Chart Pattern: Descending Triangle (Breakout in Progress)
Candlestick Pattern: Bullish Engulfing (Formed at Lower Boundary of Triangle – Base Support Zone ₹1,800–₹1,850)
📈 STWP Trading Analysis
STWP Trade Setup
Bullish Breakout: ₹2,094.30
Stop Loss: ₹1,829.30
Possible Intraday Demand Zone: 1869.50 - 1850.20
Possible Swing Demand Zone: 1869.50 - 1832.90
Momentum: High
Volume: 52-week breakout
This marks the possible conviction zone — where price, pattern, and participation align perfectly.
🧭 Support & Resistance
Support 1: ₹1,908 – immediate retest zone
Support 2: ₹1,752 – mid-base accumulation area
Support 3: ₹1,659 – final demand base
Resistance 1: ₹2,156 – near-term resistance
Resistance 2: ₹2,249 – previous supply pocket
Resistance 3: ₹2,404 – key breakout target zone
🔢 Fibonacci Levels
Retracement from the ₹3,000 high to ₹1,700 low shows:
38.2% level: ₹2,160
50% level: ₹2,350
📈 Volume & Momentum Setup
RSI: back above 61 — momentum returning
MACD: bullish crossover with growing histogram
CCI: high but justified by volume expansion
The breakout candle printed the highest daily volume in a year, confirming institutional accumulation.
While the weekly chart remains in recovery mode, the daily structure is already in breakout alignment.
🧩 STWP Summary View
Momentum: Strong
Trend: Early Reversal Attempt
Volume: Extremely High
Risk: Moderate (Stop below ₹1,830)
Bias: Bullish above ₹2,100 | Neutral below ₹1,850
________________________________________
⚠️ Disclosure & Disclaimer – Please Read Carefully
This post is created purely for educational and informational purposes and does not constitute investment advice or a buy/sell recommendation.
I am not a SEBI-registered investment adviser. All observations are based on technical studies and publicly available information.
Trading and investing involve risk; please manage position size and stop-loss discipline as per your risk profile.
Always consult a SEBI-registered financial advisor before making trading decisions.
________________________________________
Position Status: No active position in (POLYMED) at the time of analysis.
Data Source: TradingView & NSE India
💬 Found this useful?
🔼 Boost this post if you value clean, structured analysis.
💭 Drop your views — can Torrent Pharma sustain this breakout above ₹3,835?
🔁 Share this with traders who track institutional breakouts.
👉 Follow for more price-action based institutional setups.
🚀 Stay Calm. Stay Clean. Trade With Patience.
Trade Smart | Learn Zones | Be Self-Reliant 📊
________________________________________
INOX WIND LTDINOXWIND
1) Time Frame - Monthly.
2) IPO Base ALL TIME HIGH MULTI YEAR breakout in monthly with good volume.
3) It is a Cup Pattern breakout. So, As per the cup pattern target It would be around (972) in the long term.
4) Recommendation - Strong buy

8 new price lines candlestick pattern 1. It occurs in an uptrend.
2. The pattern is characterized by 8 candlesticks with higher highs.
3. Closed off the candle should be above the previous candle stick body
If this occurs, there are more chances that there will be a rise in Prices. If the Close is below the Top of the Real Body of the Previous Candle , there are more chances that there will be a fall in Prices.

Bullish Engulfing: Nifty 50Yesterday NSE:NIFTY had a gap down open, then went below previous day's low and then the sudden buying spike took it all the way up above the previous candle's high and managed to close engulfing the previous candle's body, Classic Bullish Engulfing pattern was formed. The next day will be the confirmation of the pattern. Bullish engulfing is a Reversal pattern.
*It is just my analysis and not buy or sell recommendation.

LEMONTREE 33% from Demand Zone shared !!NSE:LEMONTREE
#NSE:LEMONTREE shared @ Demand zone 66 with Open Targets, and trading @ 87.5 which is huge 33%
#Snipershot 🎯
