XAU/USD: Gold in Downtrend, Waiting for Demand Surge⏰ Timeframe: 30m
📅 Update: 11/20/2025
🔍 Market Context
After the technical rebound at the beginning of the week, gold returns to adjust within the descending channel pattern, indicating that short-term upward momentum is temporarily weakening.
The current structure reflects a rebalancing state after the price was rejected at the 4,127 USD supply zone – coinciding with the 30-minute frame Supply Zone.
However, the Demand Zone below still plays an important role in maintaining the medium-term upward structure.
📊 Technical Structure
Supply Zone (4,127 USD): main resistance area, confluence with the nearest peak – where the price was strongly rejected during the Asian session.
OB Bearish (4,106 USD): short-term supply area, highly likely to be retested after completing the adjustment phase.
Demand Zone (4,013 USD): main support area in the descending channel, also the confluence point between the channel boundary and the lower liquidity zone.
Liquidity Sweep: signal indicating that lower liquidity has been absorbed, opening up the possibility of forming a higher low.
🎯 Market Outlook
High probability scenario:
1️⃣ Price continues to fluctuate within the descending channel, retesting the 4,013 USD Demand Zone.
2️⃣ If a clear price reaction occurs, the market is likely to break the channel, opening up a technical rebound to OB Bearish 4,106 USD or Supply Zone 4,127 USD.
3️⃣ Losing the 4,013 USD area will temporarily invalidate the rebound structure, bringing the price back to a lower balance area around 3,990 USD.
🧠 Analyst’s View
Gold is in a corrective pullback phase – where the market needs to regenerate liquidity before forming a new expansion wave.
A reasonable scenario is sweep – retest – expansion: sweep lower liquidity, retest the supply area, then determine the main trend for the end of the week.
Buyers still have a slight advantage as long as the Demand Zone is maintained.
🛡️ Risk Note
This is a phase of market liquidity accumulation, fluctuations may be erratic.
Capital

Gold Technical Retracement Before Continuing Main Uptrend⏰ Timeframe: 30m
📅 Update: 11/14/2025
🔍 Market Context
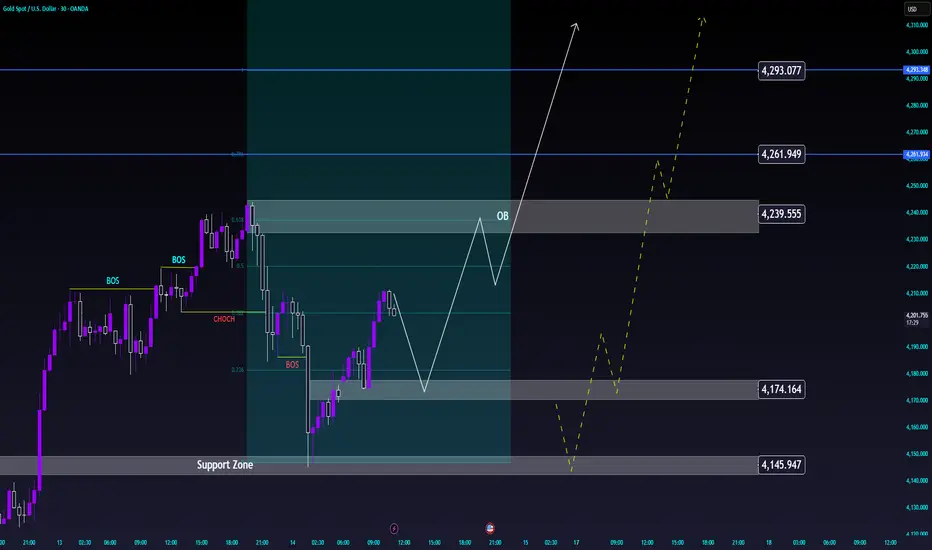
After establishing a short-term peak around 4,239 USD, gold is undergoing a technical retracement to rebalance its structure.
The most recent decline formed a Break of Structure (BOS), but the Support Zone around 4,145–4,174 USD continues to serve as a foundation for the medium-term uptrend.
The current price structure indicates the market is re-accumulating momentum before expanding again.
📊 Technical Structure
Order Block (4,239 USD): a short-term resistance zone where the price may react slightly before continuing upward.
Support Zone (4,145–4,174 USD): a confluence zone with Fibo 0.236–0.382, playing a balancing role in the current cycle.
Liquidity Targets:
• 4,261 USD – intermediate liquidity zone.
• 4,293 USD – main expansion target if the uptrend is maintained.
🎯 Market Outlook
High probability scenario:
1️⃣ The price may retrace to the Support Zone or form a higher low around 4,174 USD, then recover to the OB zone at 4,239 USD.
2️⃣ If the uptrend structure breaks, the market may test deeper towards 4,145 USD before bouncing back.
As long as the price holds above this support zone, the primary trend remains bullish continuation.
🧠 Analyst’s View
This is a phase of market re-accumulation after a rapid increase.
Maintaining a higher low structure will be a confirmation signal for the next expansion phase towards 4,261–4,293 USD.
Buyers are still controlling the cash flow, while sellers mainly participate in the short-term resistance zone.
🛡️ Risk Note
The market is in a slight correction phase – avoid impulsive actions when the price has not completed the accumulation zone.
Gold Maintains Bullish Structure, Prepares for New ExpansionWave⏰ Timeframe: 30m
📅 Update: 11/13/2025
🔍 Market Context
After a short correction at the start of the week, gold has clearly formed a Break of Structure (BOS) on the 30-minute chart, indicating that bullish momentum has returned.
This morning's Asian session witnessed a strong recovery from the Support Zone, confirming that buying pressure remains dominant in the current structure.
The market is approaching the “expansion phase” – where prices typically expand to seek liquidity above.
📊 Technical Structure
Order Block 1 (4,208 USD): a short-term support area, likely to serve as a retest point after the expansion move.
Order Block 2 (4,184 USD): confluence of Fibonacci 0.5–0.618, a deep equilibrium zone within the bullish structure.
Support Zone: the main foundation of the medium-term uptrend, still being preserved.
Extension Levels:
• 4,249 USD → first expansion target.
• 4,267 USD → intermediate liquidity zone.
• 4,292 USD → maximum expansion target within the current cycle.
🎯 Market Outlook
Today's scenario leans towards a continuation bullish direction:
1️⃣ Price may technically correct to the OB 4,208 or 4,184 USD area.
2️⃣ Upon a bullish reaction, the market is likely to expand to 4,267 – 4,292 USD, where short-term selling liquidity is concentrated.
3️⃣ Losing the 4,184 USD level will temporarily shift the structure to rebalancing (sideways).
🧠 Analyst’s View
Gold is in the “expansion reaccumulation” phase, meaning after attracting liquidity below, prices begin to expand following the main trend.
Continuous BOS signals indicate that buyers are reasserting control.
As long as prices remain above the 4,184 USD area, the intraday bias remains predominantly bullish.
🛡️ Risk Note
The market is expanding rapidly, so pullback reactions to the OB area may be highly volatile.
Let your trade ideas run and let's observe together.

Nagreeka Capital Limited is an Indian financial services companyNagreeka Capital Limited is an Indian financial services company that operates in the capital market segment. The company is primarily engaged in the business of investing in securities, providing advisory services, and managing portfolios. Nagreeka Capital focuses on equity investments, derivatives trading, and other capital market activities.
SPOT PRICE 21.5 RUPEES AS OF 1 JULY 2023 I CAN UNDERSTAND ITS NOT THAT EASY TO FIND UNDEROWNED SHSARE BECAUSE MARKET IS AT HIGHS STILL THIS SHARE CAN DO BETTER

BITCOINSo treating a bitcoin investment like venture capital or growth equity makes logical sense because it’s much younger than gold and needs to prove itself to be a worthy competitor over time.
Consider the following thought experiment. What if bitcoin didn’t trade every second of every day? What if, instead, you could only exit your bitcoin investment five years after you invested, and in the meantime you marked the value of the investment at cost?
This is somewhat akin to a venture capital or private growth equity investment. You are locked up for years and, although the investment’s value gets marked periodically, those marks aren’t especially meaningful unless and until you see a real exit.

SIEMENS (D)After witnessing the last quarter in a steady downtrend a positive divergence seen in mid December has produced a reversal in this counter and has seen the price rise steadily higher into the value zone around 1280. Momentum indicators shown on the charts are also in sync with the prices as the resistances are been challenged. The support lent by the median line is also proving to be a deciding factor in the trend that is currently emerging. A closing above 1285 could spur a sharp upside in this counter towards 1330 in the next few days. Can buy some here and on dips to 1250.

REL Capital, buy above 440REL Capital has formed Big Candle in daily Graph,
Big candle High is 440. if it give close above this we can see good upward sharp move.
we can target 38% if entire move that is 480.
wish u happy trading enjoy this trade
