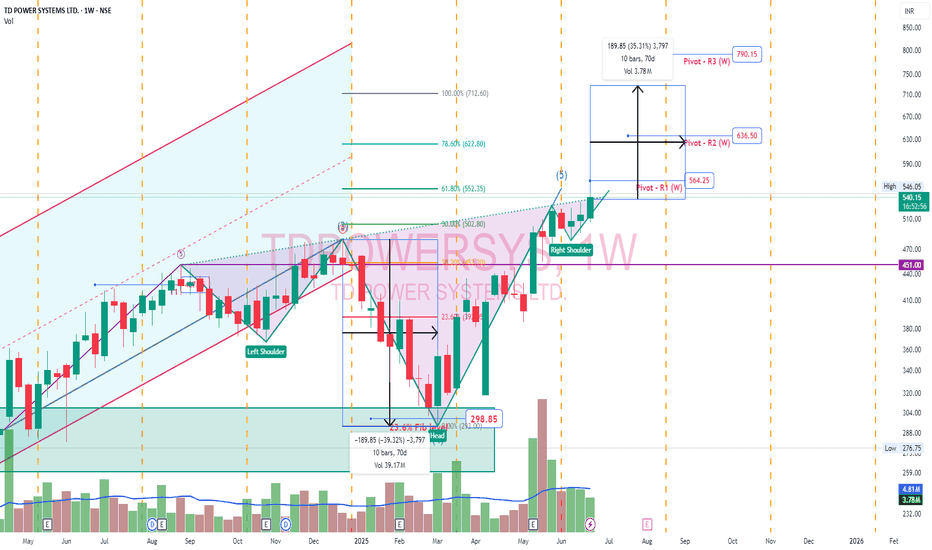
TdPowerSystem - Inverted Head & ShoulderTD Power Systems secured a ₹67 crore export order for traction motor components. This order is for delivery between 2026 and 2027
Inverted Head and Shoulder pattern. Pivot points plotted. Head would be ideal target. Right shoulder low would be long term stoploss.
Capitalgoods
CumminsInd - Desc Broadening Wedge - BullishCumminsInd - Capital goods Non Electrical Equipment
Despite modest Q4 revenue growth, Cummins India expects double-digit growth in FY26 on the back of robust domestic demand, CPCB 4+ tailwinds, and export recovery
Chart is making Bullish flag with descending broadening Wedge bullish pattern in weekly timeframe
Fib level 161.8%, Pivot R1(W), Pivot R2 (W) will hold as resistances
Flag and Pole Pattern After Reversing from a SupportNSE:THERMAX is making a Flag and Pole Pattern on Daily Charts after Reversing from a Strong Support Zone on the back of the news that NSE:THERMAX is going to ACQUIRE 100% STAKE IN BUILDTECH PRODUCTS FOR APPROX. 720 MILLION RUPEES.
A Breakout of the Flag will give a Bullish Momentum to the Stock Ahead.
🙋♀️🙋♂️If you have any questions about this stock, feel free to reach out to me.
📌Thank you for exploring my idea! I hope you found it valuable.
🙏FLLOW for more
👍BOOST if useful
✍️COMMENT Below your views.
Meanwhile, check out my other stock ideas below until this trade is activated. I would love your feedback.
Disclaimer: This analysis is intended solely for informational and educational purposes and should not be interpreted as financial advice. It is advisable to consult a qualified financial advisor or conduct thorough research before making investment decisions.
VCP development #DHINDIATight VCP can be seen developing in DHINDIA, looks like its setting up for a impulse move now. All the scrips in Capital Goods seem to be in trend. I'll be keeping my position low in this trade.
Stoploss 75
*DISCLAIMER*
This analysis is only for educational purpose. I am not a SEBI Registered Analyst/Advisor. Please consult your financial advisor before taking any position and please use a Stop Loss for any Investments/Trading Positions. It is your hard earned money so give risk management your highest attention. Do take this disclaimer seriously.
BSE Capital Goods- Relative Strength signaling RED FLAGS!Attached: BSE Capital Goods/ BSE Sensex Daily Chart as of 13th April 2023
The Ratio Chart has given Warning Signals of what is about to come for the Capital Goods Sector, the Warning Signals are as follows:
1) A Broadening Wedge Pattern (see the Blue Trend Lines marking the Pattern)
2) A Double Top formation within the Broadening Wedge Pattern (see the Red Curve and the 2 Down Arrow Marks)
3) Triple Bearish RSI Divergence is also visible
4) MACD is currently in Sell Mode
5) ADX is below 25 meaning range bound (this means a Trend is about to start, biased for the Downside given the other signals)
All the Signals I have mentioned are Bearish for the Chart which mean that if it comes to play then the Capital Goods Sector (including Stocks that make up the Sector) would be confirmed to be an UNDERPERFORMER for the coming 2-3 Weeks (till the Downside Target gets met on the Ratio Chart at least)
You may look at Stocks within the Capital Goods Sector for Shorting as some of them have already given Sell Signals like L&T and SIEMENS (these 2 are on my radar)
APARIND |BO Candidate Near ATH | Min 50% NSE:APARINDS
Multi-Year Breakout Candidate
Near 4 year Resistance
Consistent Volumes in last 1 yr signal Accumulation
Return Potential : Minimum 50%
Wait for BO above 830-840 zone
Targets : 1000 - 1184 - 1404
SL : 710
Monthly & Weekly RSI > 60 for past 12 months
Golden Cross-Over signals Long Term Bullish Trend
Greaves Cotton - Ready to Fly
Entry – CMP 157 (breakout was 156.8)
Stop loss -150.6 (Deep Stop 137)
Target 1 – 205.1
Target 2- 290.25
Duration – 2-3 years
Co produces electric engines for offices generators and ebikes (high demand for their products)
Co is almost debt free
Expect current financial year (Mar 2021) Co was making decent and consistent profits
Co is trading at Par Valuation (P/B) to its peers like Cummins, Swaraj engines, G G engineering.
Promoters of company are constantly added shares over last 2 years.
Co Owns Subsidiary Co named Ampere which produces electric Scoters.
2 Wheeler Electric segment is expected to grow at 70% CAGR over next 5 years. So huge Value building can be expected from Greaves Cotton.
Technical -
Volume accumulation is seen in last 2 weeks with Cup and Handle pattern on weekly chart.
Once Stock reaches all time high above 175.6 it will enter uncharted territory.
P.S : Holding this Script from lower levels.
Disc. : Views Shared for Education Purpose only. Consult your Financial Advisor before taking any position.
Please like Share and Comment if you like our work.
Long Schneider ElectricHello Traders,
Trade poses some risk to your capital. But trading with calibrated risk leads to profits.
Schneider Electric, shows some bullish trends where we can enter Schneider at current Market price if it starts moving upwards from here, with a trailing SL of Rs 10. The target here would be to go until 155, but on safer side, I would suggest trading with Trailing SL to reap maximum benefits.


