XAUUSD M45: SELL at OB 4.331–4.339, BUY at 4.306–4.3121) Market Context (M45) – SMC & Price Structure
The spike up followed by a strong sell-off is a liquidity event (liquidity sweep), creating a clear bearish displacement.
After the sell-off, the price is retracing in a pullback/retest manner → prioritize the strategy “SELL retracement at supply zone,” or “BUY reaction at demand zone” if there is a sweep down.
2) Key Levels
Liquidity Sell (liquidity peak): 4.367.982
OB Bearish (Sell Zone): 4.331.123 – 4.338.610
Liquidity Support (Demand): 4.312.463 – 4.306.358
Current reference price: ~4.326 (currently in the middle of the range, not an optimal entry point)
3) Trading Plan
Scenario A – SELL at OB Bearish (priority)
If the price retraces to the 4.331 – 4.339 zone and shows rejection signals:
pinbar / shadow
downward engulfing
or bearish ChoCH on M15–M45
Then prioritize SELL following the retracement in the short-term bearish structure.
Reference targets:
TP1: 4.312
TP2: 4.306
Invalidation:
M45 candle closes firmly above 4.339 and holds → stop the SELL idea.
Scenario B – BUY at Liquidity Support (reversal scenario)
If the price is pulled down to the 4.312 – 4.306 zone and shows signs of sweep + reclaim (piercing down then closing back up the zone).
Upon confirmation, watch for BUY retracement.
Reference targets:
TP1: 4.331
TP2: 4.339
Note: if the price touches the OB Bearish again without breaking it, prioritize closing and observing the reaction.
Scenario C – Sweep up to Liquidity Sell 4.368 then reverse
If the price breaks above OB Bearish and continues to run liquidity up to 4.368.
The 4.368 zone is suitable for finding a sell reaction (only SELL with confirmation signals).
4) News on 18/12 affecting gold
On 18/12, there is US CPI (November): the most impactful news on gold as it directly affects interest rate expectations, yields, and USD.
On the same day, there are usually Initial Jobless Claims and activity indicators (e.g., Philly Fed), which can easily create short-term spikes for XAUUSD.
After the CPI day, the market often exhibits liquidity sweeps on both ends before choosing a direction → avoid FOMO, prioritize trading at the right zone.
5) Quick Conclusion
Short-term bias: prioritize SELL retracement at OB 4.331–4.339 until the price strongly reclaims above.
Defensive scenario: BUY reaction at 4.312–4.306 if there is a sweep + confirmation.
Avoid entering trades in the middle of the range; wait for “right zone – right signal.”
Captainvincent

XAU/USD: Sell on Bearish OB, Buy Deep at Bullish OB1. Context & Price Structure (M30)
• The price is in a downward correction after a strong previous increase.
• On the retracement zone, EQH + ChoCH decrease appears → signal of weakening buying flow, prioritize "retracement to sell" in the short term.
• The price is still pressed under the descending trendline, so the short-term bias remains downward until a clear break occurs.
• Support Zone 4,275 is the decisive point: if held, it will rebound technically, if broken, it opens the path to the lower demand zone.
2. Key Levels (according to the chart drawn)
• OB Bearish (Sell Zone): 4,308 – 4,312 (≈ 4,311.888) → supply zone + trendline confluence, prioritize watching for SELL when retracing.
• Support Zone: 4,272 – 4,276 (≈ 4,275.451) → central support zone, can create a rebound/retracement.
• Mid Support / Target: 4,247.624 → next target if 4,275 is broken.
• OB Bullish (Buy Zone): 4,223.400 – 4,205.983 → strong demand zone, expected to sweep and reverse.
3. Trading Plan (with clear conditions)
Scenario 1 – SELL on retracement at Bearish OB (main scenario)
• If the price retraces to 4,308 – 4,312 and a rejection reaction appears:
strong pin bar
downward engulfing
or ChoCH decreases again on M15/M30
• Then prioritize SELL according to the correction trend.
• TP1: 4,275
• TP2: 4,247
• TP3: 4,223 (approaching OB Bullish)
• Invalidation: M30 closes above 4,318 and holds above → stop SELL idea.
Scenario 2 – BUY deep at Bullish OB (important scenario to catch a large retracement)
• If the price breaks 4,275 with a clear M30 candle and slides down to 4,223 – 4,206.
• Wait for Liquidity Sweep + reversal signal:
pin bar at OB
upward engulfing
or ChoCH increases (M15/M30)
• When confirmed, prioritize BUY.
• TP1: 4,247
• TP2: 4,275
• TP3: 4,308
• Invalidation: M30 closes below 4,198 → stay out and observe.
4. Risk Management Notes
• Do not chase SELL when the price is close to 4,275 (support zone).
• Do not BUY early before the price hits Bullish OB and confirmation is received.
• If the price reclaims strongly above the trendline + 4,312, the bias will shift to "BUY pullback" instead of "Sell retracement."

Waiting for FVG / Liquidity Pullback, Trend-Following BUY Bias1. Market Context & Structure (H1)
• Gold has completed a liquidity sweep followed by a bullish BOS, confirming that the short-term uptrend remains intact.
• After the strong impulse, price is now entering a rebalancing / technical pullback phase rather than a reversal.
• The overall structure remains Higher High – Higher Low, favoring BUY strategies aligned with the dominant trend.
2. Key Technical Zones on the Chart
• Resistance / Supply Zone 1: 4,359 – 4,360
→ A previously strong reaction zone, where short-term corrections may occur.
• Resistance / Supply Zone 2: 4,394
→ Fibonacci 0.786 extension area, prone to profit-taking or upper liquidity sweeps.
• iFVG – Pullback Zone: 4,297 – 4,300
→ Inefficiency left during the bullish impulse, prioritized for the first BUY reaction.
• Liquidity Buy Zone: 4,267
→ Resting liquidity below, where a deeper sweep may occur before trend continuation.
3. Trading Scenarios – Captain Vincent Style
🔹 Primary Scenario – BUY at iFVG / Liquidity Buy (Preferred)
• Expect price to pull back from the 4,35x area toward 4,297 – 4,300 (iFVG) or deeper into 4,267 (Liquidity Buy).
• At the BUY zone, wait for confirmation signals:
– Strong rejection wicks
– Bullish engulfing
– Bullish ChoCH on M15–H1
• Preferred BUY Zones:
– BUY 1: 4,297 – 4,300
– BUY 2 (deeper): 4,267
• Targets:
– TP1: 4,359
– TP2: 4,394
– TP3 extension: continuation if 4,394 is broken.
• Invalidation:
– H1 close below 4,255 → short-term bullish structure weakens.
🔹 Secondary Scenario – Short-Term SELL Reaction at Supply
• If price rallies directly into 4,359 – 4,394 without a clear pullback, a short-term SELL reaction may appear.
• SELLs are scalp / counter-trend only, not the primary scenario.
• SELL target: pullback toward iFVG 4,297.
4. Risk & Management Notes
• Avoid FOMO BUY at high resistance zones.
• Prioritize BUY entries at discounted areas (FVG – Liquidity).
• Main bias remains BUY on pullbacks; SELLs are only technical reactions.
• Adjust position sizing carefully as the market is in an expansion phase.

XAU/USD : Buy at OB 4,19x – 4,18x, Targets 4,24x → 4,26x 1. Market Structure (H1)
Gold is retracing back into bullish structure after breaking a series of bullish ChoCH and BoS, forming a new high around 4,24x. The current decline is only a technical pullback because:
• Price is returning to the Buy Order Block at 4,188 – 4,196.
• This zone aligns with trendline support and the demand base that fueled the previous impulse.
• The macro structure remains bullish as long as H1 does not close below 4,188.
→ This is a clear pullback–continuation setup: wait for price to retrace into discount, then target higher zones.
2. Key Levels
🔹 Demand Zone (Buy Zone): 4,188 – 4,196
• Bullish OB
• Trendline support
• Priority BUY area
🔹 Resistance 1: 4,217 – 4,218
• Multiple rejections
• Breakout → next bullish leg
🔹 Resistance 2: 4,238 – 4,239
• 0.5–0.618 Fibo confluence
• Possible mild sell reaction
🔹 Liquidity & Targets:
• 4,259 → Fibo 1.272
• 4,278 → Fibo 1.618 + resting liquidity
3. Trading Plan
🔸 Main Scenario – BUY at OB 4,19x – 4,18x
Conditions:
• Price taps 4,188 – 4,196
• Reversal signals: pin bar, engulfing, or bullish ChoCH
Targets:
TP1: 4,217
TP2: 4,238
TP3: 4,259
TP4: 4,278
Invalidation:
• H1 close below 4,185 → stay out.
🔸 Alternate Scenario – Price goes up without retesting OB
If price holds above 4,210 and breaks 4,217:
• Wait for retest of 4,217
• BUY continuation toward 4,238 → 4,259 → 4,278
Market Outlook
Gold is accumulating and building a base for a stronger breakout. The OB Buy zone 4,19x – 4,18x remains the highest-probability reversal area.

XAU/USD: Buy at OB 4.18x–4.17x; Sell on reaction.✍️ Captain Vincent – SMC Flow Analysis
📊 Market Structure (H1)
Gold continues to accumulate within the range of 4,200–4,220 after failing to break the recent peak. The structure shows:
• Multiple ChoCH – BoS declines → selling pressure still leads in the short term.
• However, the OB Buy 4,184–4,170 zone remains a crucial structural bottom, where buyers react strongly once swept.
• Above, the market leaves a Liquidity Sell area at 4,261, a natural target if gold gathers enough liquidity below.
→ The current phase is liquidity gathering before making a big move.
💎 Key Levels – Price Zones to Watch
🔸 Resistance / Sell Zone
• 4,218 → intraday resistance, price reacts multiple times.
• 4,243–4,244 → confluence of sideways peak + old BoS.
• Liquidity Sell: 4,261 → extended target if price breaks strongly upwards.
🔸 Support / Buy Zone
• 4,200–4,201 → short-term price balance zone.
• OB Buy 4,184–4,170 → strong demand, where the previous trend initiated.
• If breaking 4,170 → price may sweep deeper but remains in the ideal discount zone for BUY hunting.
🎯 Trading Plan – Clear and Easy to Follow
1️⃣ Main Scenario – Prioritize BUY at OB 4,184–4,170
Expect the market to create a sweep below 4,200, touching OB Buy to gather liquidity before bouncing up.
BUY Conditions:
• Price touches 4,184–4,170
• Reversal signals appear on M15–H1: pin bar, engulfing, rising ChoCH
• Decline slows down or buying force becomes clear
Targets:
• TP1: 4,190
• TP2: 4,200
• TP3: 4,215
• TP4 extended: 4,261 (Liquidity Sell)
Invalidation: H1 closes below 4,165 → stay out and reassess the structure.
2️⃣ Secondary Scenario – Short SELL when price retests 4.24x
If the price does not drop immediately but pulls up:
SELL Conditions:
• Retest 4,243–4,244
• Strong reaction appears: rejection wick, declining ChoCH
• Must not close H1 above 4,250
Targets:
• TP1: 4,235
• TP2: 4,225
• TP3: OB Buy 4,184–4,170
Invalidation: H1 closes above 4,250 → stop SELL, shift bias to observe breakout.
3️⃣ Extended Scenario – Sweep peak 4,261
Only activate when:
• Price bounces strongly from OB Buy
• Clear breakout of 4,243 zone
• Structure forms HL → HH
At that point, gold will tend to run straight up to sweep liquidity at 4,261 before the market chooses a new direction.
⚠️ Risk Management Notes
• Do not BUY when price is still within the resistance zone 4,218–4,243.
• SELL is only a short-term strategy, do not go against the major trend if a breakout occurs.
• OB Buy 4,184–4,170 is the zone with the highest probability of triggering an upward wave.

XAU/USD H1 Plan: SELL at OB, BUY at Liquidity1. Market Structure (H1)
Gold is in a corrective phase after breaking the previous upward structure. From the nearest peak, the price continuously creates downward BoS waves, confirming that selling pressure is in control in the short term.
Currently, the price is moving within a descending channel and retesting the trendline multiple times but has not been able to breakout. This supports the scenario of the price continuing to complete a deeper decline to gather liquidity before forming a major recovery wave.
2. Important technical zones on the chart
🔹 OB – Sell Zone: 4,190 – 4,197
Confluence of Fibonacci 0.5 – 0.618 of the most recent decline.
This is the H1 supply zone where the price previously broke the downward structure → prioritize observing SELL when the price retraces.
🔹 Liquidity Buy Zone: 4,154 – 4,163
Liquidity cluster located just below the nearest bottom.
This is the area where the market is likely to create a liquidity sweep before reversing upwards.
🔹 Deep Liquidity Zone: 4,115 – 4,12x
Deep liquidity zone, confirmed by multiple old bottoms formed since the beginning of the month.
If the price is pushed down here, this will be a very strong BUY zone for the next major recovery wave.
3. Trading scenarios according to structure – clear & easy to follow
🔸 Scenario 1 – SELL from OB 4,19x (main scenario)
Activation conditions:
Price retraces to OB Sell zone 4,19x
Appearance of reversal signals M15–H1: strong rejection candles, ChoCH down, engulfing
Targets:
TP1: 4,163 (Liquidity)
TP2: 4,154
TP3 extended: 4,12x – 4,115
Note: This OB zone is a beautiful confluence – if the price reacts strongly, there is a high chance the market will complete the decline according to the model.
🔸 Scenario 2 – BUY according to Liquidity Sweep (priority after SELL)
After completing the decline to liquidity zones:
BUY Zone 1: 4,154 – 4,163
Wait for bottom sweep & ChoCH up → BUY according to recovery wave
BUY Zone 2: 4,115 – 4,12x (strongest Buy)
If the price breaks through the Liquidity zone 4,15x
This is the zone where the largest buying force may appear → expect to create a new H1 bottom
Targets for both BUY zones:
TP1: 4,195 (OB Sell retest)
TP2: 4,210
TP3 extended: 4,23x – 4,24x
Further: 4,25x – 4,27x (Fibo 1.272 – 1.618)
4. Important notes & risk management
Do not BUY when the price is standing in the descending channel – wait for sweep & confirmation.
SELL is only valid when the price hits exactly OB 4,19x, avoid FOMO selling in the middle of the zone.
BUY is invalid if H1 breaks deeply below 4,110.
Strong upward scenario only activates when H1 closes above 4,200.

XAU/USD: Buy at 4.19x, Sell Short at OB 4.24x1. Market Context (H1)
Gold is moving within a corrective structure after the previous strong rally. The current price action revolves around two main zones:
Buy Support Zone 4,197–4,200: where the price continuously reacts, with multiple BoS – ChoCH increases → indicating that buying pressure still maintains the base.
OB Zone – Sell 4.24x: confluence of Fibonacci 0.5 – 0.618 – 0.786, a zone likely to see a decline reaction before forming a larger trend.
The current structure leans towards a recovery to the OB Sell zone, after which the market may continue to adjust deeper to create liquidity before rising again.
2. Important Technical Zones
🔹 Support – Buy Zone: 4,197 – 4,200
This is a strong price base, where BoS + ChoCH continuously form.
Only when breaking below this zone → the short-term uptrend structure weakens.
🔹 OB Zone – Sell: 4,238 – 4,245
Confluence of Fibonacci retracement (0.5–0.618–0.786).
A favorable zone for the market to create a decline reaction, triggering a liquidity sweep to lower lows.
🔹 Strong Low: 4.17x
This is an important low – if the price sweeps here but does not break → expect a strong rebound to higher targets.
3. Trading Scenarios According to Structure
🔸 Scenario 1: Price recovers to OB Sell 4.24x → look for short-term SELL signals
Wait for the price to hit the OB Sell zone and appear:
Strong rejection candle
ChoCH decreases on M15 frame
Volume increases at the peak
Then expect a decline back to the Support Buy zone 4,197–4,205.
Trading idea:
Sell zone 4,238–4,245
Target: 4.20x
If breaking 4.20x deeply → extend to Strong Low 4.17x
🔸 Scenario 2 (high priority): Buy at Support to catch the rise to 4.25x – 4.27x – 4.29x
After completing the decline according to scenario 1, the price may rebound from the strong demand zone.
BUY conditions:
Price sweeps down to 4,197–4,205 or deeper to 4.17x.
Reversal pattern appears + ChoCH increases.
Recreate HL (higher low) structure.
Targets:
TP1: 4,234
TP2: 4,244
TP3: 4,258
Extended TP: 4,276 – 4,299 (Fibo 1.272 – 1.618)
4. Risk Management Notes
Do not chase Buy when the price is in the OB Sell zone – easy to get swept.
Do not Sell deeply when not reaching OB 4.24x zone – price has not entered a nice premium zone.
Always clearly define invalidation levels:
BUY invalid when price closes H1 below 4.17x.
SELL invalid when price breaks strongly above 4,245 and holds.

XAU/USD: Gold Consolidates, Awaiting Pullback for Breakout📊 Market Structure (H1)
Gold is moving within a converging triangle pattern – with the bottom being pushed higher by buying pressure, while the top is continuously blocked by the H1 descending trendline.
After the previous strong decline, the market has consecutively created bullish ChoCH , indicating that capital flow is starting to return, but the pivotal supply remains at the OB Bearish 4.23x area – where the price is currently stuck.
Currently, the price is testing the upper edge of the triangle + supply area, which is primarily used for distribution and liquidity sweep. → Not an optimal area for FOMO BUY.
💎 Key Levels – Important Areas
• OB Bearish – 4.23x: confluence with descending trendline → high probability area for strong reaction or Liquidity Sweep.
• FVG – 4.21x: H1 price gap, the market tends to return to fill before continuing.
• OB Bullish – Buy Zone – 4.201: H1 demand + lower edge of current range → priority area to observe BUY according to trend.
• Liquidity Buy – 4.170: lower liquidity area → price may sweep deep before bouncing strongly if the medium-term uptrend remains effective.
• Upper Target – 4.25x: expanded target if gold successfully breaks the converging triangle.
🎯 Trading Plan – Trading Scenarios
1️⃣ Priority Scenario: Pullback to OB Bullish
If the OB Bearish 4.23x area reacts (wick rejection, reversal pattern, weakening momentum), expect the price to retreat to:
→ FVG 4.21x
→ OB Bullish 4.201
At the 4.20x area, if a bullish ChoCH / engulfing / strong pin bar appears, this will be a reasonable BUY area according to the trend.
Suggested TP:
• TP1: FVG 4.21x
• TP2: Retest OB Bearish 4.23x
• TP3 expanded: 4.25x area if price breaks the triangle
Invalidation: H1 closes below 4.195 → stay out and wait for reaction at Liquidity 4.170.
2️⃣ Alternative Scenario: Deep Sweep to Liquidity Buy
If OB Bullish 4.20x does not hold and the price breaks down strongly, do not catch the falling knife.
→ Wait for gold to reach Liquidity Buy 4.170
→ Observe reaction: long wick, selling pressure depletes, new HL formation…
Only BUY again when the signal is clear.
If the 4.170 area is broken strongly by an H1 candle → temporary uptrend structure loses effectiveness, reduce volume or stay out until the market stabilizes.
⚠️ Risk Management
This is a trading plan based on an idea – not an immediate entry signal.
Do not BUY directly at the 4.23x resistance area.
Be patient for a pullback to the discount area (4.20x – 4.17x) and always set clear risk.
“Liquidity tells the truth — structure confirms the path.” ⚜️
⏰ Timeframe: H1
✍️ Analysis by: Captain Vincent

XAU/USD – Gold Retests Bullish OB, Preparing for a Major Recover📊 Market Structure
After the Liquidity Sweep around the 4,26x highs, Gold shifted into a short-term distribution phase and formed a series of bearish ChoCHs.
However, the entire current decline remains a corrective move, as price is now approaching the Bullish Order Block at 4,155 – 4,158 USD, which is also the primary support of the prevailing trend.
The ascending trendline has not been fully broken → buyers still have structure support.
The main scenario: price may continue sweeping deeper into the Bullish OB, or even tag the Deep OB at 4,129 – 4,130 USD, before initiating a strong bullish recovery.
💎 Key Technical Zones
Bullish OB: 4,155 – 4,158 USD → primary BUY zone
Deep OB: 4,129 – 4,130 USD → safer BUY zone (deep retest)
Bearish OB: 4,211 – 4,213 USD → short-term SELL reaction
Liquidity Above: 4,239 – 4,240 USD
🎯 Trading Plan – Two Clear Scenarios
1️⃣ BUY Setup – Trend-Following Priority
When price taps the Bullish OB 4,155 – 4,158 and prints a clear rejection candle:
Entry: 4,155 – 4,158
SL: 4,128
TP1: 4,188
TP2: 4,211
TP3: 4,239
TP4: 4,260+
→ A trend-aligned setup: low risk – high reward.
→ If price does not react at the Bullish OB, wait for a deeper BUY at the Deep OB (safer).
2️⃣ SELL Scalp – For Intraday Traders Only
If price retraces into the Bearish OB 4,211 – 4,213 and shows rejection:
Entry: 4,211 – 4,213
SL: 4,225
Short TP: 4,188 → 4,175
→ This is only a reaction play. Do NOT hold long-term since the main trend remains bullish.
🧠 Vincent’s View
Gold is likely in its final corrective phase before starting a new bullish leg.
As long as 4,129 remains intact, buyers maintain full control.
Smart money is likely accumulating around the Bullish OB before pushing price back toward 4,239 – 4,260.
⚡ “Smart money always returns to where strength began — buy where the market was born.”
⏰ Timeframe: H1
📅 Updated: 04/12/2025
✍️ Analysis by: Captain Vincent

XAU/USD – Gold Accumulating Before Rising, Monitor BUY at📊 Market Structure
Gold is in an accumulation phase after a short-term drop creating ChoCH at lower price levels.
The current structure shows that the price has formed an Equal High (EqH) around 4,235 – a sign that the market may be holding liquidity above to support the next push.
The price returns to test the area 4,192 – 4,193 USD — this is the nearest support zone, and also the point where previous buying pressure created an upward BoS . If this area continues to hold, the short-term upward structure will be reactivated.
💎 Key Technical Zones
• Support Zone (Buy Zone): 4,192 – 4,193 USD
• Invalidation: below 4,170 USD
• Target 1: 4,237 USD
• Target 2: 4,249 USD
• Target 3: 4,264 USD
• Target 4: 4,284 USD
• Liquidity Zone: 4,323 USD
🎯 Trading Plan – BUY Priority
1️⃣ BUY Setup – Retest Support 4,192
If the price retests the area 4,192 – 4,193 and a bullish candlestick signal appears (rejection / engulfing):
• Entry: 4,192 – 4,193
• SL: 4,170
• TP1: 4,237
• TP2: 4,249
• TP3: 4,264
• TP4: 4,284
• TP5: 4,323 (sweep liquidity EqH)
→ This is a setup in line with the short-term trend, as liquidity above the EqH peak remains and is likely to be swept.
2️⃣ SELL Scalp – For Intraday Traders Only
If the price retests higher resistance zones and reacts with a strong decline:
• Waiting SELL Zone:
– 4,249
– 4,264
– 4,284
• Short TP: back to 4,225 – 4,216
→ This setup only trades against the trend when clear rejection is observed.
🧠 Vincent’s View
The current trend still supports the continuation of the upward expansion.
The 4,192 USD area is crucial: holding this area → prioritize BUY; losing this area → the market will need to sweep deeper before rising again.
⚡ “Follow the liquidity — the market always returns to collect what it left behind.”
⏰ Timeframe: 1H
📅 Update: 03/12/2025
✍️ Analysis by: Captain Vincent

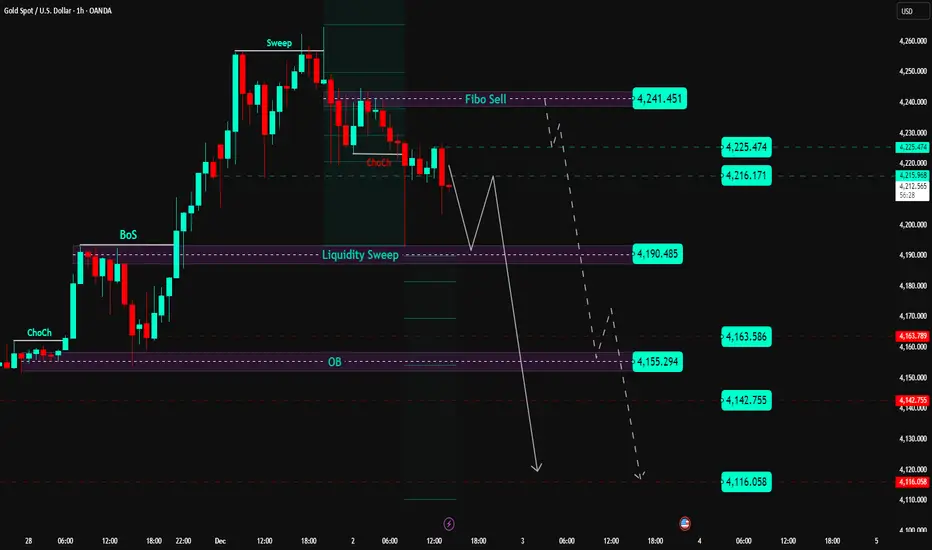
XAU/USD: Peak Sweep Done, Price Distributing in Premium📊 Market Structure
• After a strong bullish leg, Gold formed a clear Liquidity Sweep at the highs around 4,261 USD (Fibo Sell) , taking out all liquidity above that zone.
• From that high, price gradually weakened and printed a bearish ChoCH (loss of buying pressure; short-term structure no longer clean).
• Price is currently trading inside the premium zone between 4,190 – 4,241:
– 4,241 = Fibo Sell / liquidity extreme .
– 4,225 – 4,216 = lower premium zone , likely to react before retesting the highs.
– 4,190 = Liquidity Sweep + short-term support : only if price breaks below and retests from underneath will this zone flip into resistance for SELL continuation.
⇒ Current picture: short-term bearish bias , but sells should come from the premium zones (4,216–4,241) or only after a confirmed break of 4,190 — avoid chasing mid-range.
💎 Key Technical Zones
• Fibo Sell Zone: around 4,241.451 → optimal extreme for hunting SELL setups.
• Reaction Levels:
– 4,225.474
– 4,216.171
• Liquidity Sweep Support: 4,190.485 → main short-term support.
• Support / TP Zones:
– 4,163.586
– 4,155.294 (old OB)
– 4,142.755
– 4,116.058 (deeper low – extended target)
🎯 Trading Plan – SELL Priority From Premium
1️⃣ Primary SELL – Fibo Sell 4,241 & Premium 4,225–4,232
Ideal scenario: price retraces into the upper premium zone and prints a clear rejection signal (pin bar / engulfing / rejection volume).
• Entry 1: 4,225 – 4,232 (first scale-in)
• Entry 2: 4,235 – 4,241 (add if price sweeps higher)
• Stop Loss: above 4,250
• TP1: 4,190
• TP2: 4,163
• TP3: 4,155
• TP4: 4,142
• TP5: 4,116
→ Classic “sell the premium” setup: wait for price to return to the swept highs — avoid FOMO in the middle.
2️⃣ SELL Continuation – After Breaking 4,190
Only valid if we get a clear H1 close below 4,190 , confirming the Liquidity Sweep zone has been violated and flipped into resistance.
• Condition: H1 close below 4,190 → wait for a retest of 4,190–4,195 from underneath
• Entry: 4,190 – 4,195
• SL: above 4,205
• TP1: 4,163
• TP2: 4,155
• TP3: 4,142
• TP4: 4,116
→ This setup is only for traders who prefer clean continuation after a confirmed break of support.
3️⃣ Countertrend BUY – Only From Deep Zones
• Aggressive: watch for reactions at 4,163 – 4,155 . If strong rejection appears, consider a technical BUY retracement toward 4,190 – 4,216 (scalp).
• Conservative: wait for a deep test of 4,116 (stronger demand zone) before searching for BUY setups.
→ This is strictly countertrend; only take it if strong confirmation appears. Otherwise, skip and focus on SELL opportunities in premium zones.
🧠 Vincent’s View
Gold is currently “hanging” within premium after a very clean top sweep.
The safest strategy is to let price return to 4,225–4,241 before selling, or wait for a confirmed break of 4,190 to play continuation. Avoid selling directly at 4,190 while it still acts as support.
“Sell the premium, respect the levels – liquidity never lies.” ⚜️
⏰ Timeframe: 1H
📅 Updated: 02/12/2025
✍️ Analysis by: Captain Vincent
XAU/USD: Buy Gold at 4,217 or FVG 4,182!📊 Market Structure
Gold continues to maintain a strong upward structure after creating a series of BoS continuously from the 4,156 USD region.
This morning's H1 breakout pushed the price above the short-term peak, confirming that the BUY side is in full control.
The price is currently returning to retest the Demand intraday 4,217 – 4,210 USD area — this is the first support area where buyers can continue to push the upward wave.
If the pullback is deeper, gold may reach the FVG 4,182 – 4,172 USD area, coinciding with fibo 0.5 – 0.618 → the most attractive discount area in this wave.
The main trend remains bullish as long as the price stays above:
• 4,217 – Demand 1
• 4,182 – FVG Discount
• 4,156 – Key Demand Zone
💎 Key Technical Zones
• Demand Zone 1: 4,217 – 4,210
• FVG Discount: 4,182 – 4,172
• Strong Demand (structure holding bottom): 4,156
• Target Zones:
– 4,285
– 4,309
– 4,321
– 4,342
– 4,369 (liquidity above peak)
🎯 Trading Plan – Prioritize BUY
1️⃣ BUY 1 – Retest Demand 4,217
When the price touches 4,217 – 4,210 with confirmation signals (long wick, H1 engulfing).
• Entry: 4,217 – 4,210
• SL: below 4,200
• TP1: 4,285
• TP2: 4,309
• TP3: 4,342
• TP4: 4,369
→ Quick setup – follow the momentum.
2️⃣ BUY 2 – Deep Pullback to FVG 4,182
In case the price shakes strongly before continuing to push the wave.
• Entry: 4,182 – 4,172
• SL: below 4,156
• TP: 4,217 → 4,285 → 4,342
→ This is the “best” price area to accumulate BUY in the session.
🧠 Vincent’s View
H1 shows a strong upward structure, clear momentum. The current adjustment is just a technical pullback before hitting the upper liquidity levels.
As long as gold stays above 4,182 – the trend remains bullish and the targets 4,285 – 4,342 are entirely feasible.
“Smart money buys the dip — not the hype.” ⚜️
⏰ Timeframe: 1H
📅 Updated: 01/12/2025
✍️ Analysis by: Captain Vincent

XAU/USD: Gold Stagnates, Poised for a Strong Surge📊 Market Structure
Gold is moving in a tight accumulation phase (compression) between two important zones:
• OB Support: 4,130 – 4,126
• Resistance – Small Supply: 4,148 – 4,166
The previous trend remains a strong uptrend (clear BoS sequence from 4,089), and currently, the price is retesting the newly formed peak-bottom structure.
The BUY side is still in control as long as the price stays above:
• 4,130 – Main OB Support
• 4,104 – Discount FVG
• 4,089 – Key Low Confirming Trend
If gold holds these zones, the next targets will be the upper liquidity levels:
• 4,166
• 4,181
• 4,207
• 4,243
💎 Key Technical Zones
• OB Support 1: 4,130 – 4,126
• FVG Zone: 4,104 – 4,089 (best discount)
• Deep Bearish OB: 4,060 – 4,045 (if price drops sharply)
• Upper Liquidity Targets: 4,166 → 4,181 → 4,207 → 4,243
🎯 Trading Plan (Priority BUY)
1️⃣ BUY 1 – Retest OB 4,130
When the price touches the OB support zone 4,130 – 4,126 and shows a bounce signal (rejection / engulfing).
• Entry: 4,130 – 4,126
• SL: below 4,115
• TP1: 4,166
• TP2: 4,181
• TP3: 4,207
• TP4: 4,243
→ Quick setup, good RR, trend aligned.
2️⃣ BUY 2 – Discount FVG 4,104 – 4,089
This is the best BUY zone if the market drops sharply before rising.
• Entry: 4,104 – 4,089
• SL: 4,070
• TP1: 4,166
• TP2: 4,181
• TP3: 4,207
• TP4: 4,243
→ Strong confluence: FVG + fibo discount + key liquidity.
3️⃣ BUY 3 – Deep Accumulation at Bearish OB Shift
• Entry: 4,060 – 4,045
• SL: 4,020
• TP: 4,104 → 4,166 → 4,207
→ Only activate if “flush liquidity” appears.
🎯 SELL Scalp (secondary – not priority)
Only SELL when there is a clear rejection reaction at:
• 4,166 – first liquidity sweep zone
• 4,181 – strong reaction zone
• 4,207 – main bearish OB
• 4,243 – large liquidity peak
• SL: 10–15 USD
• TP: 4,148 → 4,130
→ For scalpers only, not a main setup.
🧠 Vincent’s View
The market structure remains completely bullish. The market is accumulating energy in a narrow range before breaking strongly to the upper liquidity targets.
As long as gold stays above 4,089 – the uptrend remains dominant.
“Patience builds the entry – liquidity completes the move.” ⚜️
⏰ Timeframe: 1H
✍️ Analysis by: Captain Vincent

XAU/USD: Gold Bullish, Waiting for Perfect Buy Pullback📊 Market Structure
Gold is maintaining a strong bullish structure after a series of BoS from the bottom region. The most recent rally broke the 4,130 mark and continues to hold above the small OB area, indicating that the BUY side is still in control.
Currently, the price is slightly retracing to retest the structure — the target is to test the area:
• OB 4,130 – 4,126 USD
• Or deeper to FVG 4,104 – 4,089 USD
In both cases, these are discount areas to continue BUYING according to the main trend.
The larger trend still targets the upper liquidity levels including:
• 4,151
• 4,181
• 4,207
• 4,243
💎 Key Technical Zones
• OB Retest Zone: 4,130 – 4,126 (quick bounce area)
• FVG Zone: 4,104 – 4,089 (best discount area to BUY)
• Large Bearish OB: 4,045 – 4,060 (final area if price adjusts deeply)
• Target Zones: 4,151 – 4,181 – 4,207 – 4,243
🎯 Trading Plan – BUY (priority)
1️⃣ BUY 1 – Retest OB 4,130
• Entry: 4,126 – 4,131
• SL: below 4,115
• TP1: 4,151
• TP2: 4,181
• TP3: 4,207
• TP4: 4,243
→ This is a quick setup – for a short retracement before continuing.
2️⃣ BUY 2 – FVG 4,104 – 4,089 (best)
• Entry: 4,089 – 4,104
• SL: 4,070
• TP1: 4,151
• TP2: 4,181
• TP3: 4,207
• TP4: 4,243
→ This FVG area is a strong confluence: fibo, small demand, and trendline.
3️⃣ BUY 3 – OB Bearish shift (deep entry)
• Entry: 4,045 – 4,060
• SL: 4,020
• TP1: 4,104
• TP2: 4,151
• TP3: 4,207
→ Only activate when the market shakes strongly, but RR is extremely good.
🎯 SELL Scalp (secondary – only short trades)
Only SELL when the price reaches strong resistance areas and rejection signals appear:
• 4,151
• 4,181
• 4,207
• 4,243
Entry SELL: only enter when there is H1 rejection
SL: 10–15 USD
TP: back to 4,151 → 4,130
→ This is counter-trend, not a priority setup.
🧠 Vincent’s View
The overall trend is still bullish. The current retracements are just a “breathing phase” – the market is accumulating energy to continue pushing up to higher liquidity areas.
As long as the price stays above 4,089 – the bullish trend is not threatened.
“Smart Money buys the dip — Retail buys the breakout.” ⚜️
⏰ Timeframe: 1H
✍️ Analysis by: Captain Vincent

XAU/USD: Gold Uptrend - Buy at 4,090 & 4,044 USD📊 Market Structure
Gold is maintaining an upward structure after creating a series of bullish BoS from the Demand zone. Currently, the price is technically pulling back to discount zones, where the BUY side has more advantages.
Above, the 4,206 USD zone is confirmed as OB Bearish , acting as strong resistance and a potential reversal point for the SELL side.
Below, the discount zones including Fibo–Buy 4,090 and OB Bullish 4,044–4,047 USD are reasonable places to wait for BUY to continue following the main trend.
💎 Key Technical Zones
• Fibo–Buy Zone: 4,085 – 4,095 → priority BUY zone
• FVG Reaction Zone: around 4,095 – 4,105 → signal present → BUY immediately
• OB Bullish: 4,044 – 4,047 → deep, safe BUY zone
• OB Bearish: 4,206 → strong SELL zone
• Partial resistance for SELL scalp: 4,169 – 4,186 – 4,206 – 4,237
🎯 Trading Plan – BUY (Main Priority)
1️⃣ Main BUY – Fibo–Buy 4,090
• Entry: 4,085 – 4,095
• SL: below 4,060
• TP1: 4,169
• TP2: 4,186
• TP3: 4,206 / 4,237
→ This is the most beautiful discount zone according to structure + fibo + trendline.
2️⃣ BUY on Reaction – FVG
If the price only touches FVG 4,095–4,105 and then shows a strong rejection candle:
• BUY immediately when there is a signal
• Target remains: 4,169 → 4,186 → 4,206 → 4,237
3️⃣ Defensive BUY – OB Bullish 4,044
• Entry: 4,044 – 4,047
• SL: 4,020
• TP1: 4,095
• TP2: 4,169
• TP3: 4,206
→ This is the “last bottom” zone before the uptrend is threatened.
🎯 Trading Plan – SELL SCALP (Not the Main Trend)
Zones where SELL can react when a reversal candle appears:
• 4,169 USD
• 4,186 USD
• 4,206 USD (OB Bearish)
• 4,237 USD (Supply)
Entry SELL: when there is a clear rejection (H1 long wick / engulfing)
SL: above the zone 10–15 USD
TP: back to 4,186 → 4,169 → 4,128
→ These are counter-trend scalp orders, only for flexible traders.
🧠 Vincent’s View
The main trend is still up, adjustments down to FVG – Fibo – OB Bullish are all beautiful BUY opportunities.
The BUY side dominates as long as 4,044 is not broken – SELL is only secondary, BUY remains the main play.
“Buy at discount, sell at reaction — that’s how the market moves.”
⏰ Timeframe: 1H
✍️ Analysis by: Captain Vincent

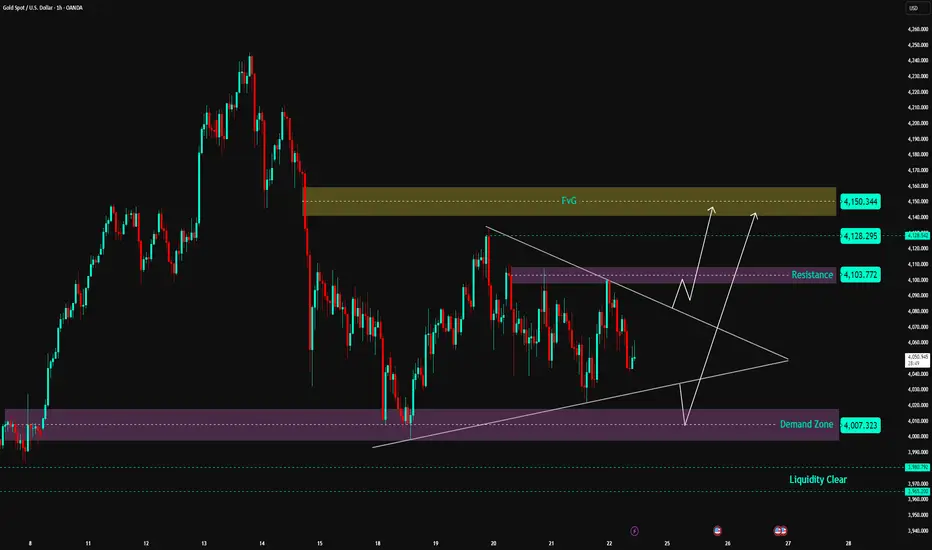
Gold Set to Explode from Triangle Pattern—Act Now!📊 Market Structure
Gold is entering a tight accumulation phase within a Symmetrical Triangle pattern – indicating compression before a strong breakout.
On the downside, the price is still supported by the Demand Zone 4,007 – 4,020 USD , which is the main support area for the medium-term uptrend structure.
On the upside, the Resistance Zone 4,103 – 4,110 USD continuously exerts pressure, causing price rejection.
Currently, gold is trading right in the middle of the compression triangle → the market is preparing to choose a direction.
Looking at the wave structure, the trend slightly leans towards a break up to sweep liquidity in the high area.
💎 Key Technical Zones
• ⭐ FVG Supply Zone: 4,128 – 4,150 USD → expected strong reaction area if price breaks up
• 🟣 Resistance Zone: 4,103 – 4,110 USD → decisive area for direction
• 🟪 Demand Zone: 4,007 – 4,020 USD → strong base maintaining structure
• 🟦 Liquidity Clear: 3,980 USD → risk area if price collapses the triangle
🎯 Trading Plan – Two Possible Scenarios
1️⃣ BUY – Wait for Breakout from Triangle (priority scenario)
If the price breaks the resistance zone 4,103 – 4,110 with a strong H1 closing candle:
• Entry: 4,112 – 4,115
• SL: 4,095
• TP1: 4,128
• TP2: 4,145
• TP3: 4,150 (reach FVG)
→ This is a trend-following setup, with a high probability of sweeping liquidity above after the break.
2️⃣ BUY – Retest Demand Zone 4,007 – 4,020
If the price continues to follow the triangle pattern and falls to the trendline + demand zone:
• Entry: 4,010 – 4,017
• SL: 3,990
• TP1: 4,103
• TP2: 4,128
• TP3: 4,150
→ This is a very strong confluence area between Demand Zone + Trendline + pattern base.
❌ SELL? When is it valid?
Currently, selling is not prioritized, as the price is still above the Demand Zone and the larger structure still favors an uptrend.
Selling is only valid if the price:
• Breaks strongly below 4,007 USD
→ At this point, the market turns bearish, with a distant target of 3,980 USD.
🧠 Vincent’s View
Gold is under strong compression. When the triangle pattern is broken, the move will be extremely fast and decisive.
The current trend leans towards breaking up and heading straight into the FVG area 4,128 – 4,150 USD.
Just be patient and wait for the confirmation candle — don’t predict, react to the market.
⚡ “Breakout is born from pressure — patience profits.”
⏰ Timeframe: 1H
📅 Update: 24/11/2025
✍️ Analysis by: Captain Vincent
XAU/USD: Gold's Final Correction Before a Strong Rebound📊 Market Structure – Elliott Wave + SMC
Gold has completed impulse wave 1–5 at the peak of 4,207 USD and is entering an Elliott correction phase in the form of ABC .
Wave A : bottomed at Demand Zone 4,008 – 4,020 USD
Wave B : retraced upwards, creating consecutive Equal Highs and small BoS but has not broken the larger structure
Wave C : is forming, may extend down to the Demand Zone if the price loses 4,030
SMC signals reinforce the scenario of a completed correction:
A series of Equal Lows → the market still has liquidity below to "sweep" towards the Demand Zone
The area BoS – 4,076 is the decisive structure: if not broken upwards, the correction trend continues
The area FVG + Resistance 4,152 USD is the target for a major retracement wave after completing wave C
=> In summary: the market is in the final phase of correction. Once wave C is completed, gold is likely to rebound strongly in the larger trend.
💎 Key Technical Zones
🔹 Demand Zone – Main BUY area
4,008 – 4,020 USD
→ Strong Demand confluence + Elliott wave C + liquidity below.
→ High probability of reversal.
🔹 Reaction Zone – Temporary reaction area
4,030 – 4,040 USD
→ If the price retraces early but hasn't swept the bottom → the correction may still continue.
🔹 Supply & FVG Zones (Strong resistance)
4,152 – 4,207 USD
→ Main target of the retracement wave after the ABC pattern is completed.
🎯 Trading Plan – Vincent’s Execution Map
1️⃣ BUY Setup – According to Wave C (top priority)
Wait for the price to complete wave C at the Demand Zone:
Entry: 4,012 – 4,020
SL: below 3,984
TP1: 4,076
TP2: 4,128
TP3: 4,152
TP4: 4,207
→ This is the main setup of the day, confluence of both SMC + Elliott.
2️⃣ BUY Aggressive – Early buy according to Break of Structure
If the price breaks BoS 4,076 before reaching Demand:
Entry: 4,070 – 4,076
SL: 4,040
TP: 4,128 – 4,152 – 4,207
→ Setup for those who want to catch the impulsive wave early.
3️⃣ SELL Scalp – Small trend (not the main trade)
Only enter when the price retraces to Fibo:
Entry: 4,092 – 4,106
SL: 4,116
TP: 4,040 → 4,020
→ Short-term scalp, aiming to complete wave C.
🧠 Vincent’s View
The overall trend still leans towards Bullish Reversal after correction.
As long as the price holds Demand Zone 4,008 – 4,020 , gold can rebound strongly back to the target of 4,152 – 4,207.
“Liquidity always shows the way – patience is the real advantage.” ⚜️
⏰ Timeframe: 1H
📅 Updated: 21/11/2025
✍️ Analyzed by: Captain Vincent

XAU/USD: Gold Adjusts, Awaiting Fibo 4,092 Confirmation📊 Market Structure
Gold is moving in the ABC–D–E adjustment pattern after a strong decline from the peak. Current structure:
Wave (C) peaks at the 4,128 – 4,130 USD region and strong selling pressure appears.
The price then creates a temporary bottom (D) but does not touch the Demand Zone at 4,007 USD, indicating the BUY side still has strength.
Currently, the price is in a small upward adjustment phase to form wave (E).
Key points:
The major trend still leans towards an increase as long as the bottom at 4,007 USD is not broken.
The BUY side is looking for a complete structure to continue pushing up to the FVG region.
💎 Key Technical Zones
1. Fibo Retracement Zone — 4,092 USD
Confluence region of:
Fibo 0.5 – 0.618
Adjustment structure (small wave)
→ Suitable for light SELL scalp, according to candle reaction signals.
2. FVG Zone — 4,128 – 4,151 USD
This is a large FVG region, coinciding with the market's "loss cost."
If the price pushes up as expected in wave (E), this is the main SELL region of the day.
3. Supply Zone — 4,207 – 4,210 USD
Extremely strong region, if the price breaks the FVG, it will move to this region.
This is the extended target for the BUY side if the market rises strongly.
4. Demand Zone — 4,007 – 4,020 USD
The strongest liquidity bottom region of the session.
If the price breaks 4,092 and does not maintain structure, gold will retest this region before a major increase.
🎯 Trading Plan – According to the current chart
1️⃣ SELL Scalp – Main scenario
Wait for the price to retrace to the Fibo 4,092 USD region and observe the reaction:
Entry: 4,092
SL: 4,105
TP1: 4,075
TP2: 4,060
TP3: 4,030 (lower FVG)
→ This is a short-term scalp order, suitable for the current weak market.
2️⃣ SELL Setup – FVG Zone
If the price breaks 4,092 and runs up to FVG:
Entry: 4,126 – 4,151
SL: 4,160
TP1: 4,092
TP2: 4,060
TP3: 4,030
→ This is the best SELL region of the day.
3️⃣ BUY Setup – Demand Zone
Only activate if the market drops deeply:
Entry: 4,020 – 4,007
SL: 3,995
TP1: 4,060
TP2: 4,092
TP3: 4,128 – 4,151
→ Buy according to the major trend when the price reaches the liquidity bottom region.
🧠 Vincent’s View
The current market is in a controlled adjustment phase.
Priority:
✔ SELL scalp at 4,092
✔ Beautiful SELL at 4,126–4,151
✔ BUY only activates when reaching 4,020–4,007
The major trend is still waiting to complete the wave pattern to push up to the Supply Zone 4,207 USD.

Gold Technical Rebound to FVG, Prioritise WATCHING FOR SELL at 4📊 Market Structure
Gold has completed a strong decline from the peak of 4.21x, leaving consecutive Break of Structure (BoS), confirming a short-term bearish structure.
The drop through the Breakout zone of 4.10x indicates a dominant selling force.
Currently, the price is bouncing from the Premium Zone 4.05x, aligning with the technical rebound behaviour after a strong sell-off.
The BUY side is merely pulling the price back to the abandoned liquidity zones (FVG 4.12x – 4.15x) before the SELL side can regain control.
The upper FVG zone is where the price often returns to fill after a steep fall. This is also the confluence zone between:
FVG (Fair Value Gap)
Old candle body Breaker
Fibonacci Premium
→ The risk of selling at these zones is very high.
💎 Key Technical Zones
Rebound zone for Sell
FVG 1: 4.101 – 4.126
FVG 2 (Strong Confluence): 4.126 – 4.150
Support zone – target to hit
Premium Zone $$$: 4.050 – 4.052
Lower FVG: 4.030 – 4.035
High probability price scenario: Rebound to FVG → reaction → continue to decline to 4.03x.
🎯 Trading Plan – Prioritise SELL
1️⃣ SELL Setup – High Probability
Wait for price to rebound to the above FVG zones:
Entry SELL:
4.118 – 4.126
Can add orders at higher: 4.140 – 4.150
Stop-loss: above 4.158
TP1: 4.101
TP2: 4.050
TP3: 4.030
✔️ This is a trend-following setup, selling at premium, adhering to SMC principles.
✔️ The current price is just beginning the rebound, not yet meeting BUY conditions.
2️⃣ BUY Setup – Only activate on deep Discount
Entry BUY: 4.030 – 4.035 (Lower FVG)
SL: below 4.020
TP: 4.070 – 4.100
→ BUY is only for counter-trend traders and must wait for a clear discount.
🧠 Vincent’s View
The market is in a distribution – decline phase, every rebound aims to pull liquidity.
As long as the price does not close above 4.150, SELL remains the optimal strategy for the day.
Observe closely when the price hits 4.12x – 4.15x, this is a “high-risk” zone for the BUY side and a “great opportunity” for the SELL side.
“Sell where the liquidity lives — that’s where institutions strike.” ⚜️
⏰ Timeframe: 1H
📅 Update: 17/11/2025
✍️ Analysis by: Captain Vincent

Gold Maintains Uptrend, Watch for Pullback to Buy with Cash Flow🔍 Context & Market Structure
After a strong upward impulse from a low liquidity area, the price has broken the downtrend structure and formed a bullish BoS on H1.
Currently, gold is accumulating above the Support Zone at 4,183 USD after creating a new peak and leaving a FVG just below the current price .
Above is the Liquidity Zone $$$ around 4,232 USD – a concentration of sell-side stop losses and buy-side profit-taking orders, likely to create a “final push” that attracts liquidity.
=> Overall: the main trend remains bullish , prioritising waiting for a pullback to discount levels to buy with the trend rather than chasing orders at high levels.
💎 Key Technical Zones
Liquidity Zone $$$: around 4,232 USD – upper liquidity area, prone to profit-taking reactions.
Current FVG: price gap area just below the current price (around 4.20x) – expected to “fill the gap” before continuing.
Support Zone 1: 4,183 USD – nearest support, confluence with the area where the upward impulse began to slow.
Support Zone 2: 4,140 USD – stronger support, aligning with the old structure.
Liquidity Clear: 4,101 USD – lower liquidity area, if swept, it would be a very attractive discount for swing buyers.
📈 Proposed Trading Scenarios
1️⃣ Main Scenario – Buy with the trend at FVG / 4,183 USD
Priority to wait for the price to:
Either fill the FVG around 4.20x and show a rejection candle,
Or clearly retest Support 4,183 USD with a bullish reversal signal on M15–H1.
When a confirmation signal appears:
→ Consider buying (BUY) around 4.19x – 4.18x .
Stoploss: below 4,175 USD (below the nearest low and support).
TP reference:
TP1: 4,210 USD
TP2: 4,232 USD (Liquidity Zone $$$)
TP3: trailing if the price breaks through 4,232 and maintains the bullish structure.
2️⃣ Alternative Scenario – Deeper Pullback Before Continuing Upward
If the price clearly breaks 4,183 USD and closes an H1 candle below:
→ Avoid buying hastily, wait for the price to continue adjusting to Support 4,140 USD or even Liquidity Clear 4,101 USD .
At these zones, if there appears:
strong rejection candles,
or small reversal structures (bullish ChoCH on M15),
→ Then consider buying at a discount with better RR, targeting a return to 4,183 → 4,210 → 4,232 USD.
3️⃣ Short-term Sell Scenario (for experienced scalpers only)
If the price hits Liquidity Zone 4,232 USD but shows strong rejection (long wick, high sell volume):
→ Consider short-term sell scalp back to the 4.20x – 4,183 USD area.
This is a counter-trend trade, so:
keep the volume small,
short TP,
tight SL above the newly formed peak.
⚠️ Risk Management Notes
Do not FOMO buy when the price is testing near the 4.23x area – this is a prone-to-sell area.
Prioritise waiting for a pullback to FVG / Support for a better entry point and RR.
Always adjust volume according to actual SL, avoid over-leverage during strong market volatility.
“Buy the dip in liquidity zones, do not chase orders at the peak – that's how to go with the big money flow.”

XAU/USD – Gold Maintains Bullish Structure, Monitor FVG 4,060📊 Market Structure
After completing the structure break (ChoCH + BoS) at the 4,080 USD zone, gold has sustained a strong upward momentum and created Equal High 4,140 – 4,145 USD , corresponding with the short-term resistance Order Block .
Currently, the price is technically reacting in this area, indicating short-term profit-taking pressure from buyers after a prolonged rally.
The H1 structure remains bullish as the main support zones have not been broken.
A potential scenario is that the price will adjust to FVG zones or support to absorb liquidity before bouncing towards the Liquidity Zone 4,197 USD — the upper liquidity peak.
💎 Key Technical Zones
• OB & Resistance: 4,127 – 4,140 USD
• Support Zone: 4,104 – 4,107 USD
• FVG Zone #1: 4,060 – 4,067 USD
• FVG Zone #2: 4,031 – 4,037 USD
• Liquidity Target: 4,197 USD
🎯 Trading Plan
1️⃣ SELL Setup – Pullback Scalping
If the price reacts sharply downward at the OB zone 4,127 – 4,140 USD:
• Entry: 4,132 – 4,137
• SL: 4,150
• TP1: 4,104
• TP2: 4,067
→ Short-term trade, leveraging the pullback to the support zone to prepare for the next BUY setup.
2️⃣ BUY Setup – Continuation
When the price completes its adjustment to the FVG or Support Zone and a bullish signal appears (rejection / engulfing):
• Entry: 4,067 or 4,037
• SL: 4,020
• TP1: 4,140
• TP2: 4,197
• TP3: 4,210
→ Main setup in the current trend. Prioritize buying at the discount zone after sufficient liquidity is absorbed at the lower zone.
🧠 Vincent’s View
The H1 structure remains buyer-favored. Current adjustments are technical, not reversals.
The FVG zone around 4,060 USD is a key point to observe price behavior — if a clear reaction occurs, this could be the starting point for the next upward wave to 4,197 USD .
“Liquidity fuels the next move — let the market breathe before the impulse.” ⚜️
⏰ Timeframe: 1H
📅 Updated: 11/12/2025
✍️ Analysis by: Captain Vincent

Gold Reaches Supply Zone: Prepare for a Pullback to FVG📊 Market Structure
Gold continues to maintain its bullish structure after breaking the structure high (BoS) at the 4,000 USD zone and forming a steep bullish channel over the past 3 sessions.
Currently, the price is precisely hitting the Order Block 4,140 – 4,150 USD — a critical supply zone formed from the previous distribution.
The H1 candle is showing slight technical reaction signs , implying the potential for a short pullback to re-accumulate liquidity.
If a pullback occurs, the Premium Zone 4,080 – 4,085 USD and FVG 4,025 – 4,035 USD will be ideal areas to look for buy signals.
The bullish structure is only invalidated if the H1 candle closes below the Support 4,006 USD zone.
💎 Key Technical Zones
• Order Block: 4,140 – 4,150 USD → main supply zone, where profit-taking pressure appears
• Premium Zone: 4,080 – 4,085 USD → medium-term rebalancing zone
• FVG Zone: 4,025 – 4,035 USD → potential discounted price zone for BUY orders
• Support Zone: 4,000 – 4,006 USD → critical defense zone
🎯 Trading Plan
1️⃣ SELL Scalp – Reaction at OB 4,145 USD
If the price continues to react downwards at the 4,140 – 4,150 USD supply zone:
• Entry: 4,143 – 4,147
• SL: 4,155
• TP1: 4,085
• TP2: 4,035
→ Short-term setup, targeting the rebalancing zone before buying back in line with the trend.
2️⃣ BUY Setup – Continuation from FVG Zone
When the price pulls back to the FVG / Premium Zone and creates a confirmed bullish signal:
• Entry: 4,030 – 4,035
• SL: 4,006
• TP1: 4,090
• TP2: 4,145
• TP3: 4,170
→ Trend-following setup, preferred when the price re-accumulates and a clear rejection appears.
🧠 Vincent’s View
Buyers still control the market, but the current OB touch may trigger a short pullback before the bullish wave continues.
The ideal scenario is “tap OB → pullback FVG → continuation,” maintaining a stable bullish structure towards the 4,170 USD target.
“Buy the dip where fear replaces greed — that’s where the next impulse begins.” ⚜️
⏰ Timeframe: 1H
📅 Updated: 11/11/2025
✍️ Analysis by: Captain Vincent

Gold Retests FVG Preparing for a New Uptrend, Target 4,120 USD📊 Market Structure
Gold has officially broken the bearish structure (BoS + ChoCH) by surpassing the 4,025 USD zone, confirming a significant shift in market momentum.
Following a series of consecutive BoS and a break of the downtrend line, the price is entering a balanced retest phase (FVG 4,030 – 4,040 USD) .
As long as the price maintains above the 4,020 USD support zone, the bullish structure remains intact, and it is expected to target the Liquidity Zone 4,070 – 4,090 USD , further extending to the Order Block 4,118 – 4,125 USD .
💎 Key Technical Zones
• FVG Retest Zone: 4,030 – 4,040 USD
• Trendline Support: around 4,000 USD
• Liquidity Zone: 4,070 – 4,090 USD
• Final Target (OB): 4,118 – 4,125 USD
🎯 Trading Plan
1️⃣ BUY Setup #1 – Main FVG Retest
If the price retraces to the FVG zone of 4,030 – 4,040 USD and forms a bullish confirmation signal (bullish candle / rejection wick):
• Entry: 4,033 – 4,038
• SL: 4,020
• TP1: 4,070
• TP2: 4,090
• TP3: 4,120
→ Enter at the “discount” zone after the market absorbs liquidity.
2️⃣ BUY Setup #2 – Defensive (deep trendline retest)
If the price slightly sweeps the small OB zone around the trendline:
• Entry: 3,998 – 4,004
• SL: 3,985
• TP1: 4,070
• TP2: 4,120
→ The structure remains intact, this entry has a high RR, suitable for mid-term swing.
⚠️ Invalidation:
• If the price closes an H1 candle below 3,985 USD → the short-term uptrend is invalidated.
🧠 Vincent’s View
The buyers are fully controlling the H1 structure after breaking the downtrend line that lasted nearly 2 weeks.
The price is likely to complete the FVG – trendline – breakout retest before continuing to expand towards the liquidity peak of 4,120 USD.
This is the “buy-the-dip” strategic phase for this week.
“Smart money buys the discount while everyone waits for confirmation.” ⚜️🟡
⏰ Timeframe: 1H
📅 Updated: 11/10/2025
✍️ Analysis by: Captain Vincent
