CARERATING BREAKOUT DONE FOR 1500 / 1750++CARERATING (Care Ratings Ltd)
LTP 1105
BUY ON DIPS UPTO 1020 in cash For Longterm
Target🎯 1150 / 1200 / 1305 / 1400++
Positional Target🎯 1500 / 1750++
====================================
CHART SETUP
1) Rounding Bottom
2) Trendline Breakout
3) Value Addition
===================================
Harm⭕️nics4Life
06/10/2024
CHART
CARERATING

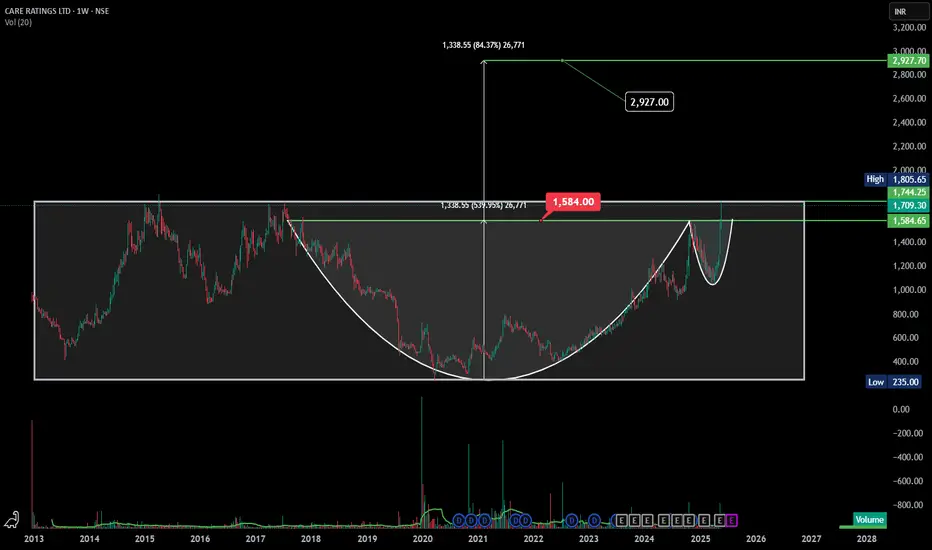
CARERATING ATH Breakout | Cup & Handle Pattern - ₹2927 Here’s the **technical analysis** for **CARE Ratings Ltd (NSE: CARERATING)**
---
### 📊 **Technical Analysis – CARE Ratings Ltd (Weekly Time Frame)**
#### ✅ **Pattern Identified: Cup and Handle Breakout**
* A **multi-year Cup and Handle pattern** has completed.
* Price broke out **above the neckline/resistance zone of ₹1584**, confirming the bullish breakout.
* This breakout follows a prolonged accumulation and consolidation phase from **2018 to 2023**, which adds to its reliability.
---
### 📈 **Breakout Details:**
* **Breakout Level (Neckline):** ₹1584
* **Current Price (May 25, 2025):** ₹1709.30
* **Target (Pattern Projection):** ₹2927
* **Measured Move:** ₹1338.55 (Cup depth) projected above breakout level
* **Potential Upside:**+84% from breakout point
---
### 🔎 **Volume & Momentum:**
* **Volume Surge** confirms buying interest and institutional accumulation.
* Recent breakout candle shows strong bullish momentum with a close well above the resistance.
* The **handle portion** formed a tight consolidation, suggesting reduced selling pressure.
---
### 🟢 **Support Levels:**
* **Major Support:** ₹1584 (previous resistance turned support)
* **Secondary Support:** ₹1350 zone (handle low)
---
### 🚨 **Resistance Levels:**
* **Immediate Resistance:** ₹1745–₹1800 zone (short-term supply zone)
* **Major Resistance:** None until the projected target of ₹2927
---
### 📌 **Conclusion:**
CARE Ratings has given a **textbook Cup & Handle breakout** on the weekly chart with high volume and strong price action. The pattern suggests **long-term bullish potential**, making it a **strong candidate for swing or positional trading**. Traders may watch for a **retest of ₹1584** for low-risk entry opportunities.
---
CARE RATINGS: Expecting 20-25% upside potential!⚡️Price Analysis:
1️⃣ Trading near crucial EMA confluence zone - showing strong support
2️⃣ Long-term uptrend intact with clear HH-HL structure.
3️⃣ Recent correction found support at previous consolidation Dz
4️⃣ Volume trend showing distribution at highs - caution needed
5️⃣ Both EMAs rising - indicating underlying bullish momentum
✨ Key Observations:
➡️ Strong Dz confluence at support (EMA + previous consolidation)
➡️ RRR favorable at current levels with defined risk
➡️ Financial sector showing relative strength currently
➡️ Previous consolidation breakout acting as strong support
➡️ Multiple timeframes aligned for potential reversal
⚠️ Disclaimer: This is NOT a buy/sell recommendation. This post is meant for learning purposes only. Views are personal. Please, do your due diligence before investing.⚠️
💬 What's your view on Rating agency stocks? Share below! ✌️🔥 Happy Trading!✅🚀

CARERATING- Breakout Setup, Move is ON..NSE:CARERATING
✅ #CARERATING trading above Resistance of 1400
✅ Next Resistance is at 1768
Related charts:
Charts are self-explanatory. Levels of breakout, possible up-moves (where stock may find resistances) and support (close below which, setup will be invalidated) are clearly defined.
Disclaimer: This is for demonstration and educational purpose only. This is not buying or selling recommendations. I am not SEBI registered. Please consult your financial advisor before taking any trade.

Care Rating cmp 1195.30 by Weekly Chart view*Care Rating cmp 1195.30 by Weekly Chart view*
- 1045 to 1075 Support Zone
- 1215 to 1255 Resistance Zone
- Volumes building up over past few weeks
- Stock Price is well above the EMA 21 > 50 > 100 > 200 levels
- Weekly Support at 1068 > 936 > 806 with Resistance is at 1321 > 1455 > 1600
- 6 year long Bullish Cup & Handle followed by Bullish Rounding Bottom in completion stage
- Price is shouldering over the Rising Support Trendline taking Breakout above Falling Resistance Trendline

CARERATING | Swing Trade📊 DETAILS
Sector: Ratings
Mkt Cap: 2,942 cr
CARE Ratings is a leading credit rating agency of India. The Company provides various credit ratings that helps corporates to raise capital for their various requirements and assists the investors to form an informed investment decision based on the credit risk and their own riskreturn expectations.(Source : 202003-01 Annual Report Page No:134)
TTM PE : 33.24 (High PE)
Sector PE : 53.09
Beta : 0.66
📚 INSIGHTS
Mid-range performer
Stock with medium financial performance with average price momentum and valuation. These stocks may be affordable and are showing some investors interest.
5.71% away from 52 week high
Outperformer - CARE Ratings up by 9.23% v/s NIFTY 50 up by 2.22% in last 1 month
📈 FINANCIALS
Piotroski Score of 5/9 indicates Average Financials
Disclaimer: This analysis is for educational purposes only, and I'm not a SEBI registered analyst.
If you found this analysis helpful, I encourage you to like and share it. Your observations and comments are also welcomed below. Your support, likes, follows, and comments motivate me to consistently share valuable insights with you.
🔍 More Analysis & Trade Setups 🔍
For more technical analysis and trade setups, make sure to follow me on TradingView: www.tradingview.com

CARERATING - Long Setup, Move is ON..NSE:CARERATING
✅ #GOCLCORP trading above Resistance of 962
✅ Next Resistance is at 1204
Related charts:
Charts are self-explanatory. Levels of breakout, possible up-moves (where stock may find resistances) and support (close below which, setup will be invalidated) are clearly defined.
Disclaimer: This is for demonstration and educational purpose only. This is not buying or selling recommendations. I am not SEBI registered. Please consult your financial advisor before taking any trade.

CARERATING - Ichimoku BreakoutStock Name - Credit Analysis And Research Limited
Ichimoku Cloud Setup :
1). Today's close is above the Conversion Line
2). Future Kumo is Turning Bullish
3). Chikou span is slanting upwards
All these parameters are showing bullishness at Current Market Price
and more bullishness AFTER crossing 942
#This is not Buy and Sell recommendation to any one. This is for education purpose and a helping hand to learn trading in Market.
#CloudTrading
#IchimokuCloud
#IchimokuFollowers
#Ichimokuexpert
I hope you all like my analysis.
Please do share your thoughts into comment section.
Please give a like, share & subscribe for daily analysis.

EXCITING BULLISH PATTERN1 minute ago
📈 Exciting Bullish Pattern Alert! 🐂
📊 Pattern: Symmetrical Triangle
📌 Symbol/Asset: Care Rating
🔍 Description: Symmetrical Triangle in making. Bullish with hourly support.
👉 Remember: Technical patterns are just one piece of the puzzle. Consider conducting further research, consulting with a financial advisor, and managing your risks appropriately.

CARE RATINGS good chart pattern followCare Ratings Long is showing good chart pattern. Currently at the long term resistance and if crosses the green line decisively then can see good upmove.
Supports of past acting as resistance. Levels up to 1000 is visible and can go more if we some volumes.
Watchout for support levels strictly of 540.
No recommendations, just my view based on the chart.

CARERATINGCARERATING:- The stock has given a breakout by forming a head and shoulder pattern
Hello traders,
As always, simple and neat charts so everyone can understand and not make it too complicated.
rest details mentioned in the chart.
will be posting more such ideas like this. Until that, like share and follow :)
check my other ideas to get to know about all the successful trades based on price action.
Thanks,
Ajay.
keep learning and keep earning.


CARERATING looks all set to take offCARE RATING looks good purely on charts. Looks completed its retracement levels at extreme and now all set to move higher and higher. Rest all plotted on chart. A buy on dips candidate. Keep watch


CARE RATING - DAILY CHART - 16.08.2022 - BAHAVAN CAPITALCARE RATING as per daily chart analysis Above 500 Target 516 level.
Happy Independence Day to all
Happy Profitable Trading to all....

CARERATING 44% UPSIDE POSSIBLETRADE OR INVEST wisely.
WE CAN JUST PREDICT.
Disclaimer: I am not a SEBI registered advisor , so before entering on my view plz ask your SEBI Registered Advisor . Profit is your and loss is your.
PLEASE LIKE AND SHARE IF YOU AGREE WITH THE IDEA


BULLISH ON CARERATINGCARE RATING gave a good breakout after making an inverted head and shoulder pattern, and even retested its movement before rallying up!
CMP of 693.50
target and SL are on the chart!
wait for a pullback till Rs. 570-560 if considering the trade!


Breakout in CARE Ratings...Chart is self explanatory. Entry, Targets and Stop Loss are mentioned on the chart.
Disclaimer: This is for demonstration and educational purpose only. This is not buying or selling recommendations. I am not SEBI registered. Please consult your financial advisor before taking any trade.

SWING TRADE : CARERATINGLevels are given on chart. Watch for breakout and day close above breakout area.
Add more till 545 if there is any correction after position taken.
Disclaimer: This is educational purpose only.
Please share your thoughts in the comments section below.

CARE RATINGS LTD - Thursday Trade | 17th JuneStock has given good upswing today with major volumes.
Intra : Above 720 for 727, 730+
Swing : Weekly closing above 712 can give targets of 750, 765
