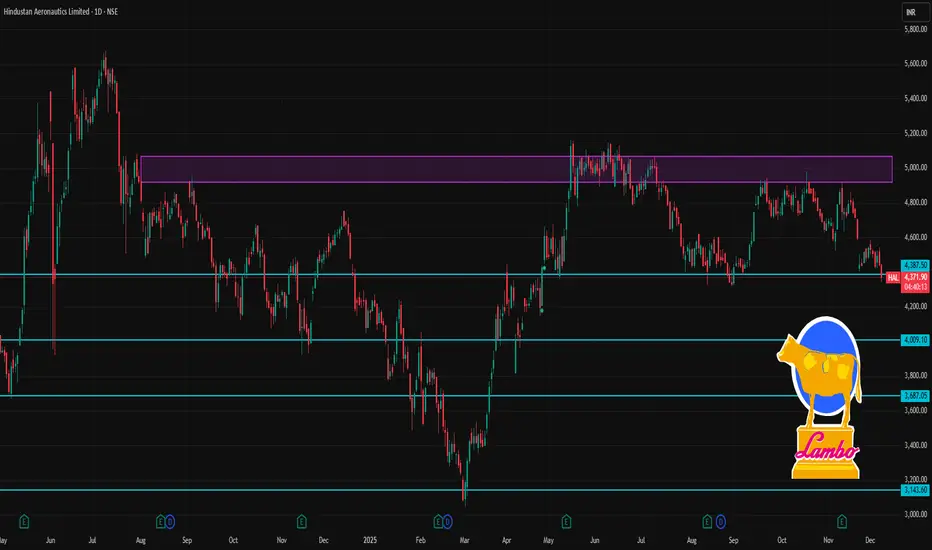
HAL 1 Day Time Frame 📈 Current Live Price (Approx)
HAL stock trading around ~₹4,360-₹4,440 on NSE today (08-Dec-2025) depending on real-time movement during session.
📊 Daily Pivot & Intraday Levels (Key Support / Resistance)
(Derived from live pivot screener showing today’s pivot scenario)
Daily Pivot Pivot Levels
Level Price (Approx)
R3 ₹4,583
R2 ₹4,558
R1 ₹4,533
Pivot Point ₹4,508
S1 ₹4,483
S2 ₹4,458
S3 ₹4,433
✅ Today’s view: Current price is trading near or slightly below the pivot zone (~₹4,507) — indicating neutral/slightly bearish bias if below pivot. Break above R1/R2 (~₹4,533-₹4,557) strengthens bullish intraday bias; breakdown below S2/S3 (~₹4,458-₹4,433) increases downside risk intraday.
🧠 How to Interpret These Intraday Levels
📌 Bullish (Buy) Scenario
Above Pivot (~₹4,508) → intraday bias turns bullish.
Break above ₹4,533-₹4,558 zones → could lead to further upside towards R3 ~₹4,583+.
📉 Bearish (Sell) Scenario
Below S1 (~₹4,483) → short-term weakness.
If price slips below ₹4,458-₹4,433 (S2/S3) → stronger bearish momentum intraday.
CARTRADE
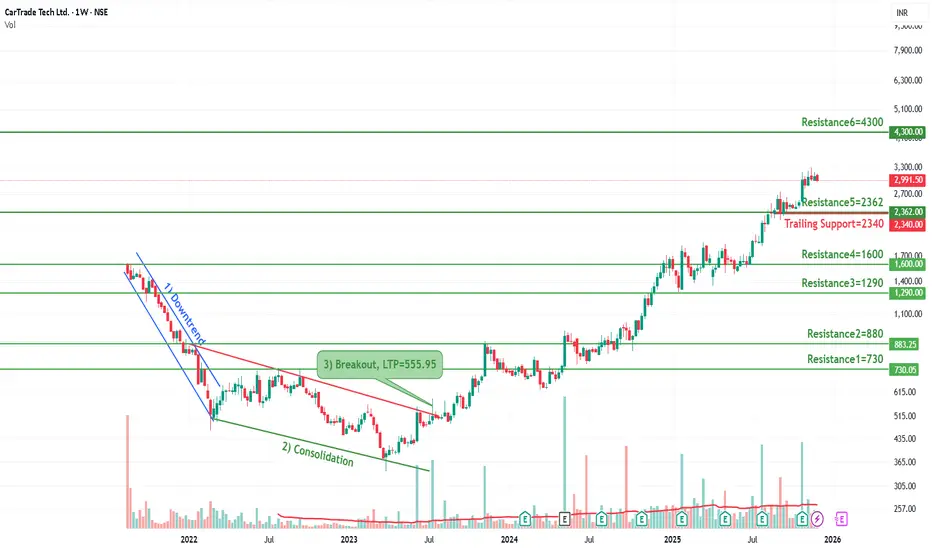
CARTRADE - Breakout Setup, Move is ON..NSE:CARTRADE
✅ #CARTRADE trading above Resistance of 2362
✅ Next Resistance is at 4300
Related charts:
Charts are self-explanatory. Levels of breakout, possible up-moves (where stock may find resistances) and support (close below which, setup will be invalidated) are clearly defined.
Disclaimer: This is for demonstration and educational purpose only. This is not buying or selling recommendations. I am not SEBI registered. Please consult your financial advisor before taking any trade.
CARTRADECARTRADE is trying to come out from consolidation zone. Consolidation after good uptrend is a very good accumulation zone. Volume spike is also observed. There is v high probablity that the stock will resume its rally. So now as long as it is trading above support line it may give good bounce from current level. Keep it on radar.
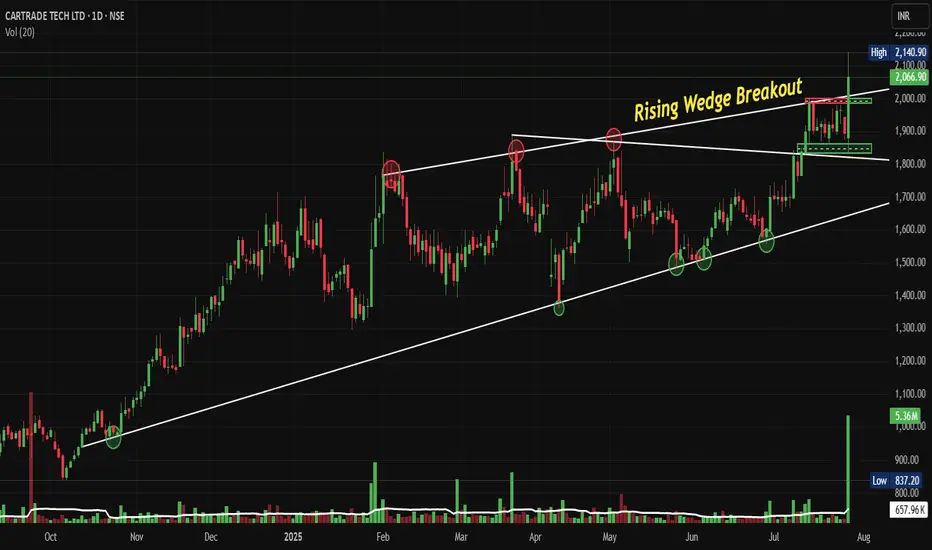
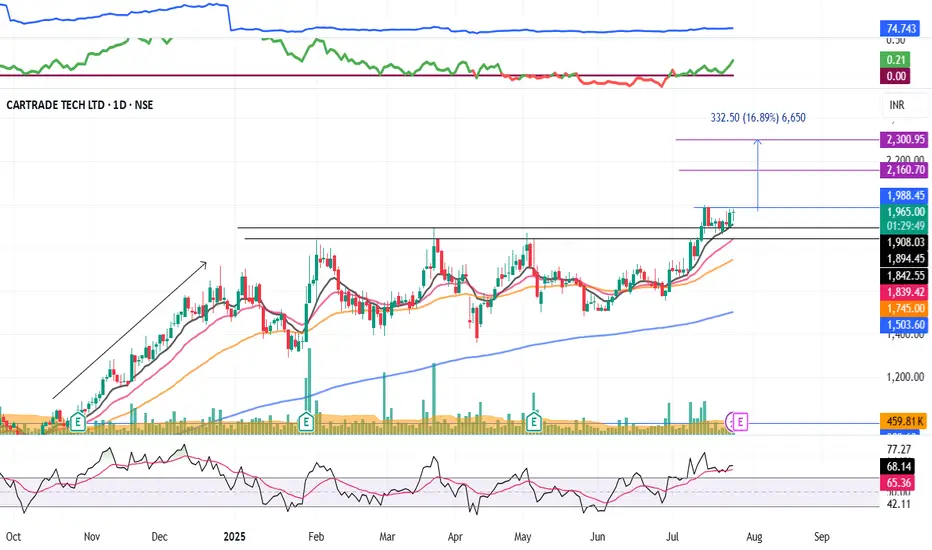
CARTRADE: Breaks Free with Rising Wedge Breakout Post Q1 FY 26NSE:CARTRADE Breaks Free: The Rising Wedge Breakout That's Driving This Auto-Tech Giant to New All-Time Heights with Strong Q1 FY 26
Price Action:
Price Movement and Trend Structure:
• Current Price: ₹2,066.90 (as of July 28, 2025)
• Daily Change: +₹172.20 (+9.09%) - Strong bullish momentum
• Price Range: High ₹2,140.90 | Low ₹2,100.90 | Volume 5.36M shares
• Price Trajectory: Consistent higher highs and higher lows pattern from October 2024
• Recent Action: Sharp acceleration in price movement post-July breakout
• Momentum Character: Strong bullish momentum with gap-up openings and sustained buying
Volume Spread Analysis:
Volume Characteristics:
• Breakout Volume: Exceptional volume spike during the breakout phase (5.36M shares)
• Volume Pattern: Generally increasing volume during upward moves, declining during consolidations
• Average Volume: Approximately 1-2M shares on regular trading days
• Volume Confirmation: The breakout is well-supported by above-average volume, validating the move
Volume Indicators:
• Volume Expansion: 3-4x normal volume during breakout sessions
• Distribution vs Accumulation: Clear accumulation pattern throughout the wedge formation
• Volume-Price Relationship: Positive correlation between volume and price advancement
Chart Patterns:
• Rising Wedge Breakout: The stock has successfully broken out of a long-term rising wedge pattern that was forming since October 2024
• Timeframe: Daily chart showing progression from October 2024 to July 2025
• Breakout Confirmation: Strong breakout above the upper trendline of the wedge with significant volume expansion
• Breakout Level: Approximately ₹1,850-1,900 range
• Pattern Completion: Clean breakout with follow-through buying confirming pattern validity
Key Price Levels:
• All-Time High: ₹2,140.90 (recent high)
• Previous Resistance Zones: ₹1,800, ₹1,900, ₹2,000
• Immediate Support: ₹1,850-1,900 (previous breakout zone)
• Major Support: ₹1,650-1,700 (middle of previous consolidation)
• Long-term Support: ₹1,400-1,450 (bottom of the rising wedge)
Trend Analysis:
• Primary Trend: Strong bullish momentum with consistent higher highs and higher lows
• Secondary Trend: Recently accelerated upward movement post-breakout
• Trend Strength: Multiple touchpoints on both trendlines confirm the validity of the wedge pattern validity
• Momentum: Increasing momentum as evidenced by the steepening price action
Key Support and Resistance Levels:
Key Resistance Levels:
• Immediate Resistance: ₹2,150-2,200 (psychological and technical resistance)
• Next Target: ₹2,300-2,350 (measured move from wedge breakout)
• Long-term Target: ₹2,500+ (extension based on wedge height projection)
Critical Support Levels:
• First Support: ₹1,950-2,000 (recent consolidation zone)
• Strong Support: ₹1,850-1,900 (breakout confirmation level)
• Major Support: ₹1,650-1,700 (50% retracement of recent move)
• Ultimate Support: ₹1,400-1,450 (wedge bottom - unlikely to be tested)
Base Formation:
• Base Pattern: Rising wedge base formed over 9 months (October 2024 to July 2025)
• Base Depth: Approximately ₹1,000 to ₹1,900 range
• Base Quality: High-quality base with multiple retests of support and resistance
• Breakout Strength: Clean breakout with gap-up opening confirming institutional interest
Technical Patterns and Indicators:
Chart Patterns:
• Completed Pattern: Rising Wedge Breakout (Bullish continuation pattern)
• Pattern Reliability: High - well-defined trendlines with multiple touchpoints
• Measured Move Target: ₹2,300-2,400 (based on wedge height projection)
• Time Frame: 9-month pattern completion
Technical Formations:
• Flag and Pennant Potential: Post-breakout consolidation may form continuation patterns
• Gap Analysis: Potential gap fills not immediately concerning given strong fundamentals
• Trend Channel: Stock is establishing a new, steeper upward channel post-breakout
Trade Setup and Strategy:
Entry Levels:
• Aggressive Entry: ₹2,050-2,070 (current market price on dips)
• Conservative Entry: ₹1,950-1,980 (on pullback to breakout zone)
• Momentum Entry: ₹2,100-2,120 (on continuation above resistance)
• Scale-in Strategy: 40% at ₹2,000, 35% at ₹1,950, 25% at ₹1,900
Exit Levels and Targets:
• Target 1: ₹2,200-2,250 (immediate resistance zone) - Book 30% profits
• Target 2: ₹2,350-2,400 (measured move target) - Book 40% profits
• Target 3: ₹2,500-2,600 (extension target) - Book remaining 30%
• Trail Strategy: Trail stop-loss 8-10% below recent swing lows after Target 1
Stop-Loss Strategy:
• Aggressive Stop: ₹1,900-1,920 (below recent support)
• Conservative Stop: ₹1,850-1,870 (below breakout zone)
• Disaster Stop: ₹1,750-1,780 (below major support)
• Risk-Reward Ratio: Minimum 1:2, targeting 1:3 for optimal entries
Position Sizing and Risk Management:
Position Sizing Guidelines:
• Conservative Allocation: 2-3% of portfolio (suitable for risk-averse investors)
• Moderate Allocation: 4-5% of portfolio (balanced approach)
• Aggressive Allocation: 6-8% of portfolio (for high-conviction trades)
• Maximum Position: Not exceeding 10% of the total portfolio, regardless of conviction
Risk Management Rules:
• Single Trade Risk: Maximum 1-2% of portfolio value per trade
• Stop-Loss Discipline: Strict adherence to predetermined stop-loss levels
• Profit Booking Strategy: Systematic profit booking at predetermined targets
• Position Monitoring: Daily review of technical levels and volume patterns
Risk Mitigation Techniques
• Diversification: Avoid overconcentration in a single stock or sector
• Hedging Options: Consider protective puts for large positions
• Correlation Analysis: Monitor correlation with broader auto and tech indices
• News Sensitivity: Be prepared for volatility around earnings and sector news
Sectoral and Fundamental Backdrop:
Industry Landscape:
• Auto Marketplace Growth: India's online auto marketplace is growing at a 27.5% CAGR (2025-2030)
• Digital Transformation: Increasing shift from offline to online vehicle transactions
• Market Leadership: CarTrade Tech is India's leading and only profitable auto marketplace
• Competitive Advantage: Multi-platform presence with CarWale, BikeWale, CarTrade, and OLX India
Business Model Strength:
• Asset-Light Model: Operates 114 auto malls, mostly leased, ensuring capital efficiency
• Revenue Diversification: Multiple revenue streams including listing fees, transaction commissions, and financial services
• Platform Integration: Comprehensive ecosystem covering new cars, used cars, commercial vehicles, and two-wheelers
• Strategic Acquisitions: OLX India acquisition for ₹535.54 crore, strengthening market position
Recent Fundamental Performance:
• Q1 FY26 Results: Revenue of ₹173 crore (22% YoY growth)
• Profit Growth: Net profit doubled year-on-year in Q1 FY26
• Market Capitalization: ₹9,801 crore (up 139% in past year)
• Valuation Metrics: Trading at 4.42 times book value
• EBITDA Performance: EBITDA almost doubled in Q1 FY26
Growth Catalysts:
• Market Expansion: Penetration into tier-2 and tier-3 cities
• Technology Enhancement: AI and ML integration for better user experience
• Financial Services: Growing fintech vertical with loan facilitation
• Electric Vehicle Segment: Positioning for EV marketplace opportunities
• B2B Growth: Expanding dealer and OEM partnerships
Sector Tailwinds:
• Digital Adoption: Accelerated post-pandemic shift to online platforms
• Used Car Market: Growing preference for certified pre-owned vehicles
• Credit Penetration: Increasing vehicle financing accessibility
• Regulatory Support: Government push for digitization and transparency
• Consumer Behaviour: Millennial and Gen-Z preference for online research and transactions
Risk Factors and Considerations:
Technical Risks:
• Overbought Conditions: Stock may be due for consolidation after a sharp run-up
• Gap Risk: Potential for gap-down on negative news or market corrections
• Volume Sustainability: Need for continued high volume to sustain momentum
• Market Correlation: High beta stock susceptible to broader market volatility
Fundamental Risks:
• Economic Slowdown: Auto sales sensitivity to economic cycles
• Competition Intensification: New entrants and existing players' aggressive strategies
• Regulatory Changes: Potential policy changes affecting online marketplaces
• Technology Disruption: Emergence of new technologies or business models
Market Risks:
• Sector Rotation: Shift in investor preference away from auto-tech stocks
• Liquidity Concerns: Mid-cap stock with potential liquidity constraints during market stress
• Earnings Expectations: High growth expectations leading to volatility on any disappointment
• Valuation Concerns: Premium valuations make stock sensitive to market sentiment changes
My Take and Investment Thesis:
NSE:CARTRADE presents a compelling technical setup with a successful rising wedge breakout supported by strong volume and robust fundamental performance. The stock has established itself as a leader in India's growing auto marketplace sector with a diversified business model and strong growth trajectory.
The technical breakout, combined with excellent Q1 FY26 results showing doubled profits and 22% revenue growth, creates a favourable risk-reward scenario for investors. However, given the stock's significant run-up (146% in 11 months), careful position sizing and strict risk management are essential.
The investment thesis is supported by both technical momentum and fundamental strength, making it suitable for investors seeking exposure to India's digital transformation in the automotive sector. The key to success will be disciplined execution of the outlined entry, exit, and risk management strategies while monitoring both technical levels and fundamental developments closely.
Keep in the Watchlist and DOYR.
NO RECO. For Buy/Sell.
📌Thank you for exploring my idea! I hope you found it valuable.
🙏FOLLOW for more
👍BOOST if you found it useful.
✍️COMMENT below with your views.
Meanwhile, check out my other stock ideas on the right side until this trade is activated. I would love your feedback.
Disclaimer: "I am not a SEBI REGISTERED RESEARCH ANALYST AND INVESTMENT ADVISER."
This analysis is intended solely for informational and educational purposes and should not be interpreted as financial advice. It is advisable to consult a qualified financial advisor or conduct thorough research before making investment decisions.
Cartrade-A risky positional trade for ATH targets!Cartrade has given outstanding Q4 2024 results and bullishness in the stock is indicator of same.
However, these stocks come with good amount of risk with bigger rewards.
Stock has formed beautiful cup & handle pattern and is about to break it.
Once 1000 is crossed, we can see ATH levels soon. I had seen similar breakout in PBFintech (Policybazaar).
If you believe in new age startups, this stock is technically looking bullish.

CARTRADE TECH LTD - The Second Race.As linked below, the previous analysis of this stock achieved all the targets in 4 months. It also with stood the sell off in the markets and reclaimed its trajectory at the first sign of market reversal. These are traits of strong stocks. Technically in Stage 2, this stock could see even higher targets but lets set targets step by step. Timely profit booking is also an art. Today it kissed the previous ATH of 2021. Above that a fresh new trend begins.
Talking about fundamentals:
- Company has a low Debt to Equity ratio
- Healthy long term growth as Net Sales has grown by an annual rate of 25.90% and Operating profit at 46.24%
- With a growth in Net Profit of 48.16%, the company declared Very Positive results in Dec 24
- Infact the company has declared positive results for the last 11 consecutive quarters
- OPERATING PROFIT TO INTEREST(Q) Highest at 17.21 times
- PAT(Q) Highest at Rs 42.69 cr.
- Over the past year, while the stock has generated a return of 109.11%, its profits have risen by 39.4%.
- High Institutional Holdings at 74.79%. These investors have better capability and resources to analyze fundamentals of companies than most retail investors. Their stake has increased by 1.15% over the previous quarter.

CARTRADE : Momentum pick#CARTRADE #swingtrade #momentumstock #breakoutstock #basingpattern
CARTRADE : Swing Trade
>> Good Base formation
>> Breakout + Retest done
>> Good Strength & Volume dried up
>> Trending setup
Swing Traders can lock profit at 10% and keep trailing
Pls boost, comment and follow us for more such analysis
Disc : Charts shared are for Learning purpose and not a Trade recommendation. consult a SEBI Registered Advisor before taking position in it.
CARTRADE Observation learning- 1st absorption
look at price, big green candle with wick selling pressure
But price continue hold and absorp sellers pressure.
After given good break outmove sharply up side
Again' same things happen, selling pressure absorption happened in tight range
After now trying to break ATH(all time high) still closing pending.
This trade still not confirmed yet.
Just sharing my observation & leading.

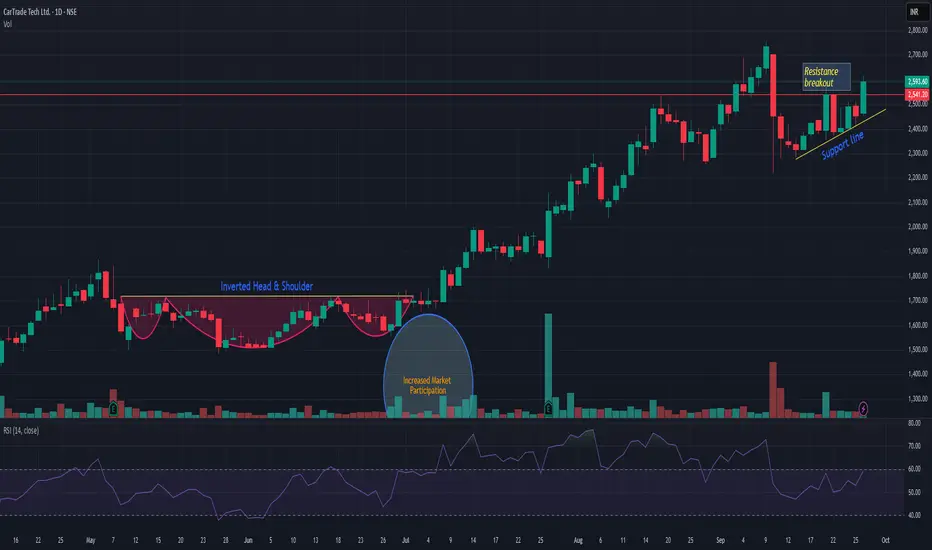
CARTRADE - Breakout Setup, Move is ON..NSE:CARTRADE
✅ #CARTRADE trading above Resistance of 1600
✅ Next Resistance is at 2362
Related charts:
Charts are self-explanatory. Levels of breakout, possible up-moves (where stock may find resistances) and support (close below which, setup will be invalidated) are clearly defined.
Disclaimer: This is for demonstration and educational purpose only. This is not buying or selling recommendations. I am not SEBI registered. Please consult your financial advisor before taking any trade.

CARTRADE TECH LTDCarTrade Tech Ltd. is a prominent player in the online auto classifieds space in India. The company operates platforms like CarTrade, CarWale, and BikeWale, which facilitate the buying and selling of new and used vehicles.
Market Cap: ₹4,192 Crores
P/E Ratio: 133.17
P/B Ratio: 2.27
Debt to Equity: 0
ROE: 3.63%
Book Value: ₹442.49
EPS: ₹16
1 Year Return: 48.64%
3 Year Return: -15.79%
CarTrade Tech Ltd. has shown significant growth in the past year, but its high P/E ratio indicates that the stock might be overvalued compared to its earnings. The company has a strong balance sheet with no debt, which is a positive sign for investors.
Key Ratios
Quality Score: 6/10
Growth Score: 7/10
Valuation Score: 3/10
Momentum Score: 8/10

Cartrade Tech Breakout Above the TrendlineCartrade Tech (nse: CARTRADE) stock is near its trendline breakout on the weekly timeframe, indicating a potential momentum. It's not perfect, but looks like a cup and handle pattern.

CARTRADE - Ichimoku Breakout📈 Stock Name - Cartrade Tech Ltd
🌐 Ichimoku Cloud Setup:
1️⃣ Today's close is above the Conversion Line.
2️⃣ Future Kumo is Turning Bullish.
3️⃣ Chikou span is slanting upwards.
All these parameters are shouting BULLISH at the Current Market Price and even more bullishness anticipated AFTER crossing 1050.
🚨Disclaimer: This is not a Buy or Sell recommendation. It's for educational purposes and a guiding light to learn trading in the market.
#CloudTrading
#IchimokuCloud
#IchimokuFollowers
#Ichimokuexpert
Excited about this analysis? Share your thoughts in the comments below!
👍 Like, Share, and Subscribe for daily market insights! 🚀
#StockAnalysis #MarketWatch #TradingEducation #ichimoku #midcap #smallcap #largecap #CARTRADE

Cartrade Tech Ltd | momentum stockCartrade Tech Ltd
CarTrade Tech Ltd is a multi-channel auto platform provider company with coverage and presence across vehicle types and Value Added Services. The company operates various brands such as CarWale, CarTrade, Shriram Automall, BikeWale, CarTradeExchange, Adroit Auto, and AutoBiz.
fundamentals :great
Market Cap₹ 4,707 Cr. Current Price₹ 995
ROCE 4.20 % ROE 0.42 %
Debt to equity 0.05
Profit Var 3Yrs -54.6 % Sales growth 3Years 25.2 %
great momentum achieve recently . keep eye on chart.
debt free company. every quarter FII AND DII increase hold.
Note: I am not SEBI registered financial Adviser. I solely present my views on chart .I do not charge any kind of service. This is not buy sell recommendation.
If you like my ideas than like boost and follow me for more ideas.
Thanks and comment freely

Cartrade cmp 991.45 by Weekly Chart view since listedCartrade cmp 991.45 by Weekly Chart view since listed
- Support Zone at 900 to 925 Price Band
- Resistance Zone 995 to 1025 Price Band
- Volumes are seen spiking steadily over past weeks
- Weekly basis Support at 900 > 810 > 708 with Resistance at 1110 > 1215 > 1345
- Price is trading well above Falling and Rising Trendlines showing very positive upside momentum
- *Multiple Bullish patterns of Rounding Bottoms and/or close to 2 1/2 years Long Cup and Handle and/or VCP pattern, as one may observe and interpret the Technical Chart Setup*

CARTRADE🔶𝗜 𝘀𝗰𝗮𝗻𝗻𝗲𝗱 𝘁𝗵𝗿𝗼𝘂𝗴𝗵 𝗵𝘂𝗻𝗱𝗿𝗲𝗱𝘀 𝗼𝗳 𝘀𝘁𝗼𝗰𝗸𝘀 𝘀𝗼 𝘁𝗵𝗮𝘁 𝘆𝗼𝘂 𝗱𝗼𝗻'𝘁 𝗵𝗮𝘃𝗲 𝘁𝗼🔸
Here are My Top 8 Breakout Picks!
3. CARTRADE
-no substantial inventory I.e. trade model
-highest ever sales
-improved margins
Cons
-doubtful debtors
-reduction in promoter holding

CARTRADE - VCP Chart Pattern Breakout🔊 CARTRADE - VCP Chart Pattern Breakout
CARTRADE - CARTRADE TECH LTD
⌛Trade Type - Swing Trade (1 week to 4 week)
📊📈 Trade Logic - VCP Chart Pattern Breakout
CMP - ₹991.45
Time Frame - Daily
🎯Target 1 : ₹1050
🎯Target 2 : ₹1100
🎯Target 3 : ₹1150
🛑 Stop : ₹939
🏆 Risk/Reward Ratio (1: 3)
Disclaimer: The stock information shared above is not a recommendation to buy, sell, or hold. It reflects my own analysis and is intended solely for educational purposes. Any actions you take based on this information are your responsibility, and the admin of this channel is not liable for any financial gains or losses. Please consult a financial advisor before making any investment decisions. I am not a SEBI-registered advisor.

Car trade gearing up for moveBuy CarTrade between 720-740
SL 695 (35Rs)
Target 1: 783
Target 2: 825
Target 3: 872
Trade as per your risk taking capacity
Breakout rested and ready for up move
This early entry, safe traders can enter after trendline breakout . i.e. above 750

Daily Bullsih Flag Pattern BO in CARTRADE TECHIntroduction:
CarTrade Tech Ltd. operates an online marketplace for new and used vehicles. Its brands include CarTradeExchange and MotorExchange. The company was founded by Vinay Vinod Sanghi and Rajan Jitendra Mehra on April 28, 2000 and is headquartered in Navi Mumbai, India.
Analysis
A Bullish Flag and Pole pattern is visible on the Daily chart of NSE:CARTRADE . The Flag and Pole pattern is a bullish continuation pattern and it is visible in charts after a meaningful appreciation in the price. MACD gave Positive crossover on Weekly Chart.
One can create a fresh position in the scrip near Rs. 820-840 levels with the stoploss of Rs. 780 on Daily closing basis for the following targets 860.60, 879.55, 901.15, 925.40, 947.85, 959.35,981.25, 996.50 and 1020.10.
Risk Disclaimer:
The trading ideas and analyses presented here are for educational purposes only and do not constitute financial advice. Trading and investing in financial markets involve risk. You should carefully consider your own financial situation, risk tolerance, and investment objectives before making any investment decisions.
The information provided in this analysis is based on my personal interpretation of market conditions and the available data at the time of writing. It is subject to change without notice, and I cannot guarantee the accuracy, completeness, or timeliness of the information provided.
Trading and investing carry the risk of substantial losses, and past performance is not indicative of future results. Always be aware that markets can be unpredictable, and prices may move against your trade or investment.
It is advisable to seek advice from a qualified financial professional and to conduct your own research before making any investment decisions. You should only invest funds that you can afford to lose.
I am not responsible for any trades or investments made based on the information presented in this analysis. By reading and using this information, you acknowledge and accept that you are solely responsible for any losses you may incur.

CARTRADE Note:
1. Views are personal and for educational purposes only. Recheck and take the trade as per your RR.
2. Always remember SL is your lifeline, not the big target...
3. Follow us for more patterns and like, share so that we feel it is helpful to many and share more patterns...
3. Views given here is not a tip rather it is for educational purpose... Aftermarket opens, the condition might change so learn to handle different conditions...
Keep an eye ladies and gentlemen. Cheers and Happy Trading

CARTRADE - Ichimoku Bullish Breakout Stock Name - Cartrade Tech Ltd
Ichimoku Cloud Setup :
1). Today's close is above the Conversion Line
2). Future Kumo is Turning Bullish
3). Chikou span is slanting upwards
All these parameters are showing bullishness at Current Market Price
and more bullishness AFTER crossing 496
#This is not Buy and Sell recommendation to any one. This is for education purpose and a helping hand to learn trading in Market.
# Cloud Trading
# Ichimoku Cloud
# Ichimoku Followers
I hope you all like my analysis.
Please do share your thoughts into comment section.
Please give a like, share & subscribe for daily analysis.

CartradeGood up move from
545 levels to 700 levels.
Approaching strong supply zone...
Lets wait and see how it reacts at the resistance trend line.
Happy Trading.


Expecting Good ReversalNSE:CARTRADE
High probablity setup in CarTrade.
Stock is in Good Uptrend and tring to break the Resistance.
The Drastic fall Since the IPO might reverse from here
Reason of the Very disappointing performance of the company was
truly its Weak Fundamentals.
As the Company has improved over its Fundamentals I expect
a good growth into it.
This is what I think is Attracting Investors into it.
if the Stocks Closes above 660 then I expect it
to Further move towards 700-760
NOTE - THE ABOVE IDEA IS MY PERSONAL VIEW
PLEASE MAKE YOUR OWN RESEARCH TOO.
Happy Investing....!!!
