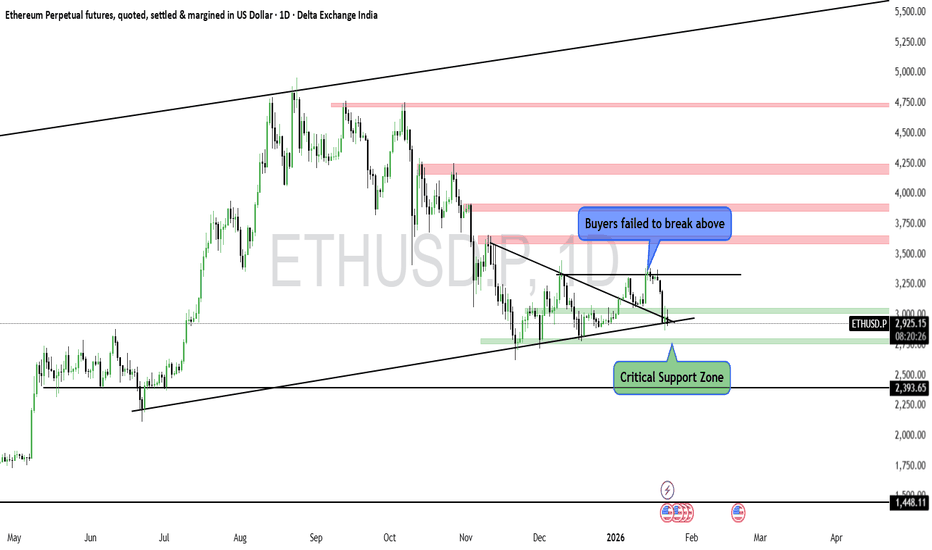
#ETH lost the bullish momentum?
Seems like ETH failed to break the previous high.
But the trend is still not reversed. Until it holds the "Critical Support" level, we can consider side way movement.
If it breaks below the critical support then the downside may continue.
This indicator is provided for educational and informational purposes only.
It does not constitute financial advice, investment recommendations, or trade signals.
The creator and Systematic Traders Club are not responsible for any financial losses resulting from the use of this indicator.
Trading and investing involve risk. Always do your own analysis and use proper risk management.
Caution
BSOFT - TREND CHANGED ?Symbol - BSOFT
Birlasoft is engaged in Computer programming, consultancy, and related activities. It provides software development and IT consulting to its customers predominantly in Banking, Financial Services, and Insurance, Life Sciences and Services, Energy Resources and Utilities, and Manufacturing. The Company’s registered office is in Pune. It is part of The CK Birla Group, Birlasoft, comprising over 10,000 plus professionals.
This stock has given great returns to investors as well as traders in last 1 year.
This stock was buy on dips since May 2023 but right now as per technical chart & price action, I think trend is changed from buy on dips to sell on rise as there exists clear Head & Shoulders pattern on larger time frame.
I have made short positions in futures already around 690 level & will find opportunity to sell it on each rise until it breaks 730-735 levels which is H&S neckline. So, My SL is placed above 735.
Targets I'm expecting on downside will be 575 - 560 - 535.
P.S. : Swap markets are now pricing in just one Fed rate cut in 2024. The Fed will keep the rate unchanged at its May 1 meeting. Powell is expected to tighten rhetoric and signal that there will be fewer rate cuts this year than previously expected. If this happens, This will result in strong profit booking in IT stocks specially mid and small caps.
Disclaimer - Do not consider this as a buy/sell recommendation. I'm sharing my analysis & my trading position. You can track it for educational purposes. Thanks!
NIFTY50 - READY FOR A CORRECTION ?NIFTY50 CMP - 22754
Although NIFTY50 is trading at its ATH & making new ATH everyday but NIFTY50 is looking lil tired.
Crude at $90, High bond yields, Bullion at ATH, Weak global sentiment & Weak US markets - nothing looks in favor of bulls.
It would be interesting to see if bulls keep on buying & take NIFTY50 to 23k or is it time to be cautious and book longs & create some shorts.
Nifty: A Bear Bias is in Place !!!After a long Time Bulls are failing to Hold on. Let the Bears start smelling Blood.
The time cycle line has acted as a strong support for the Nth time.
The recent support comes near 21800 which seems to broken in coming days/weeks.
Condition: If 21800 gets broken decisively. Downside risk upto 21500/300 opens up.
BSE Sensex Ending Diagonal CAUTION!Attached: Sensex Daily Chart as of 19th June 2023
The Ending Diagonal is more evident and clean in BSE Sensex rather than NSE Nifty 50 (although you can observe in Nifty as well), which is why I have chosen to share the Sensex Chart
Observe:
- A well defined trend line with multiple touch points
- Presence of a Bearish RSI Divergence
- Daily MACD already in Sell mode
All that is needed is break of Today's Low and a Close below it (which would also give the Trend Line breakdown simultaneously) and then that would activate the Ending Diagonal/ Rising Wedge Breakdown
The First Downside Target for this pattern would be point b which comes to 62380🎯📉
Be cautious in Nifty!Nifty has shown a steep upmove in the last one month breaking all the strong resistance without any major retracement.
Today, nifty crossed 18000 with a strong volume candle and has closed near a strong supply zone of 18100-18120 levels. Even Bank nifty has given a strong closing above 43000.
This breakout can be a signal for strong bullish uptrend to a new high or it can also be a strong bull trap.
Monday is a holiday for Indian market but not global market which is why I feel this breakout to be quite suspicious. Hopefully, we see a continuation of trend on Tuesday and not a gap down opening! Next Support for nifty is at 17780 levels
cautionsince feb, 2020 hightened volatility is restricting sound sizable positional trades. Before carrying any such positional bets please check your risk appetite and size of capital. In certain given situations not trading is best thing to do in the markets. CAPITAL PRESERVATION IS ALWAYS PARAMOUNT. SOME TIMES EVEN BEYOND TRADING.
Negative Divergance in hourly charts of BHARATFINIn the hourly charts of Bharat Financial Inclusion a Negative RSI Divergance is forming which indicates stock price may fall...
Here, Price making higher high where as, RSI making Lower Low formation...
CMP 803.8
RSI 58
Be cautious.....
Note: Do Your own study before making any position...
Please Like , Follow and Comment your views below...
BShort


