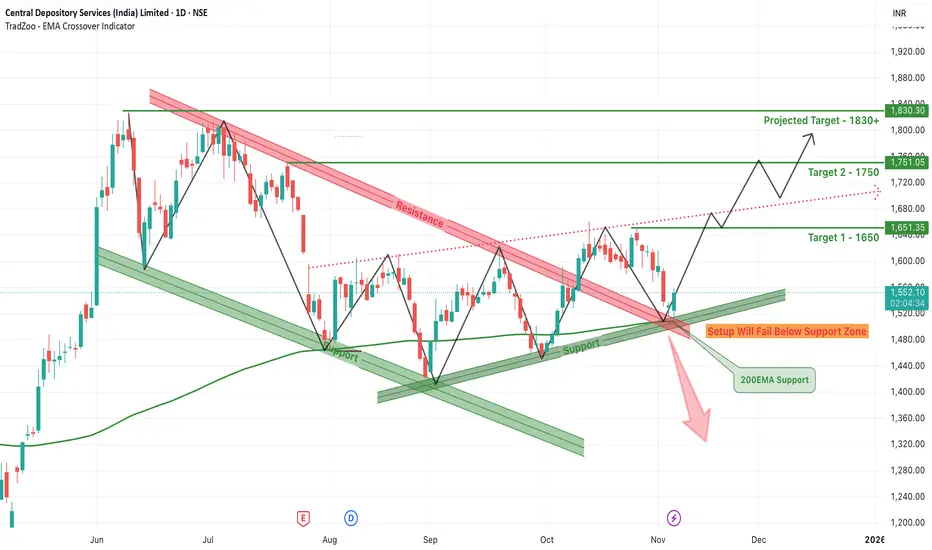
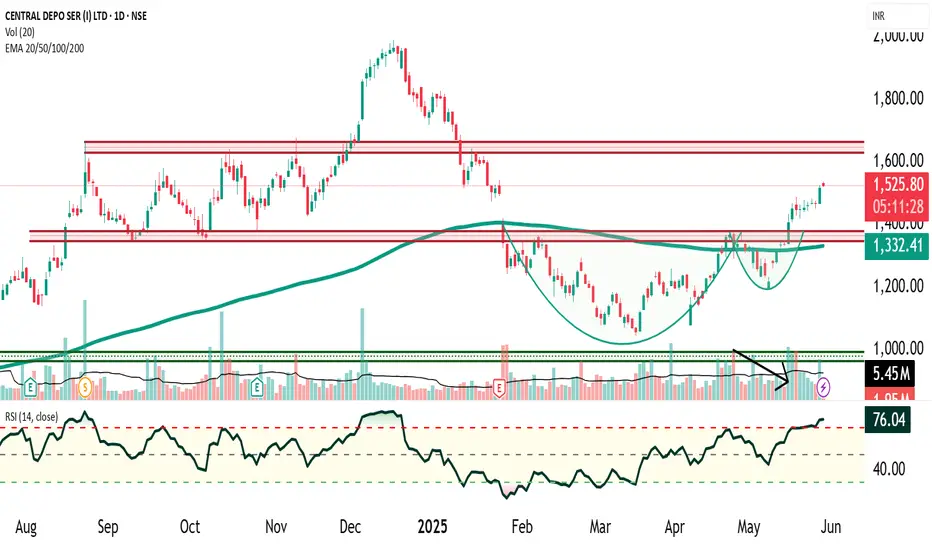
CDSL Breakout from Falling Wedge – Can It Rally to 1830+?CDSL has recently broken out from a classic falling wedge pattern, a bullish technical setup that often signals a trend reversal or continuation of the broader uptrend. After months of being compressed between a descending resistance and a well-established support line, the stock has now pierced through the upper resistance zone with notable bullish momentum.
The wedge had formed over several months, creating lower highs and relatively equal or slightly rising lows. The pattern was further supported by a confluence with the 200 EMA, which acted as a critical dynamic support near the breakout zone. This alignment of technical indicators added strength to the breakout confirmation seen recently.
With this breakout, CDSL has now opened doors for higher targets. The immediate Target 1 is set at ₹1650, which also aligns with a recent horizontal resistance zone. Once this is breached, the next move could extend toward Target 2 at ₹1750, a level where previous price action has shown hesitation. If momentum continues to build and the broader market supports the move, the final projected target of ₹1830+ becomes achievable in the short to medium term.
However, it’s crucial to note that the support zone below ₹1480 is acting as a critical invalidation point for this bullish setup. Any strong breakdown below this zone, especially with volume, would fail the bullish structure and may push the stock back into consolidation or a deeper correction. Traders must also watch the red dotted trendline, which represents a former resistance turned possible retest zone.
Overall, the technical landscape is now favoring the bulls, especially after the breakout confirmation and support from the 200 EMA. Traders and investors should monitor price action near the projected levels and manage risk accordingly, while riding the momentum above the wedge resistance.
CDSL
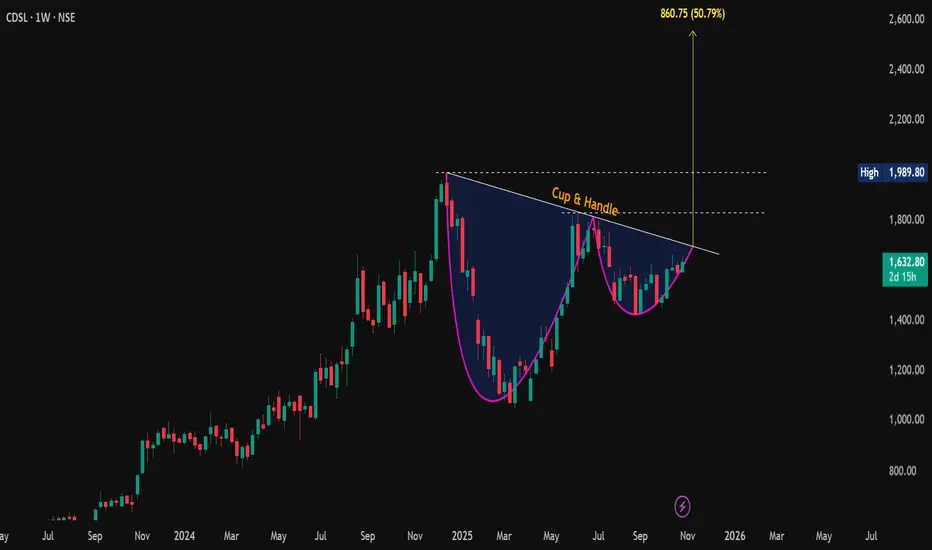
#CDSL – Cup & Handle Brewing!📊 CMP: 1632.8
☕🎯 Target: 2500+ 🚀
🛡 Support: 1597–1582 | 🔥 Resistance: 1776–1829 / 1944–1990 (ATH)
📈 Breakout above neckline = +50% potential move!
❌ Invalidation below 1421 (WCB)
#CDSL | #CupAndHandle | #ChartPattern | #SwingTrade | #PriceAction
📌 Disclaimer: This analysis is shared for educational purposes only. It is not a buy/sell recommendation. Please do your own research before making any trading decisions.
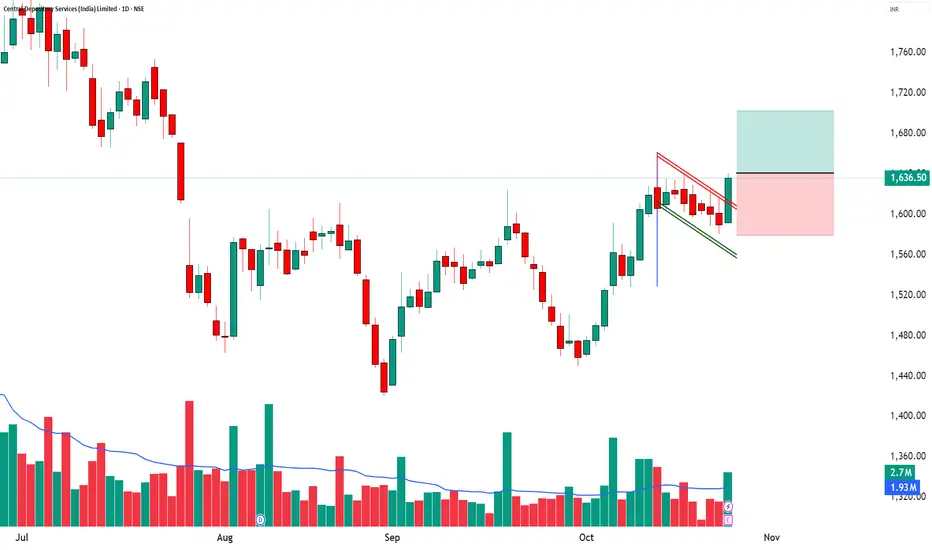
CDSL | Bullish Marubozu + RSI Breakout + Volume Expansion📈 CDSL | Bullish Marubozu + RSI Breakout + Volume Expansion 🚀
🔹 Entry Zone: ₹1,636.50 – ₹1,641.00
🔹 Stop Loss: ₹1,579.25 (Risk ~61 pts)
🔹 Supports: 1,605.33 / 1,574.17 / 1,556.33
🔹 Resistances: 1,654.33 / 1,672.17 / 1,703.33
🔹 Swing Demand Zone: ₹1,593.40 – ₹1,581.00
🔹 Intraday Demand Zone: ₹1,593.40 – ₹1,588.00
🔑 Key Highlights
✅ Bullish Marubozu Candle – clear sign of buyer dominance
✅ RSI Breakout – momentum strength confirmation
✅ Volume Surge (1.4x avg) – strong institutional participation
✅ Bollinger Squeeze-Off – breakout + volatility expansion expected
✅ VWAP Alignment – price sustaining above average buyer level
🎯 STWP Trade View
📊 Momentum supports a short-term bullish continuation. A decisive close above ₹1,654 may open the path toward ₹1,672–₹1,703.
⚠️ The ₹1,605–₹1,574 zone offers positional strength, while ₹1,593–₹1,588 acts as an intraday demand pocket for re-entry or dip-buying opportunities.
💡 Learning Note
This setup shows how combining price action (Marubozu) with RSI breakout and volume confirmation enhances conviction. Identifying multi-timeframe demand zones allows traders to plan entries with better precision and controlled risk.
Final Outlook: Momentum: Strong, Trend: Bullish, Risk: Low, Volume: High
________________________________________
________________________________________
⚠️ Disclosure & Disclaimer – Please Read Carefully
The information shared here is meant purely for learning and awareness. It is not a buy or sell recommendation and should not be taken as investment advice. I am not a SEBI-registered investment adviser, and all views expressed are based on personal study, chart patterns, and publicly available market data.
Trading—whether in stocks or options—carries risk. Markets can move unexpectedly, and losses can sometimes exceed the money you have invested. Past performance or past setups do not guarantee future results.
If you are a beginner, treat this as a guide to understand how the market works and practice on paper trades before risking real money. If you are experienced, always assess your own risk, position sizing, and strategy suitability before entering trades.
Consult a SEBI-registered financial adviser before making any real trading decision. By engaging with this content, you acknowledge full responsibility for your trades and investments.
Position Status: No active position in CDSL at the time of analysis.
Data Source: TradingView & NSE India (Past Chart Reference) (Historical levels)
💬 Found this useful?
🔼 Give this post a Boost to help more traders discover clean, structured learning.
✍️ Drop your thoughts, questions, or setups in the comments — let’s grow together!
🔁 Share with fellow traders and beginners to spread awareness.
👉 “If you liked this breakdown, follow for more clean, structured setups with discipline at the core.”
🚀 Stay Calm. Stay Clean. Trade With Patience.
Trade Smart | Learn Zones | Be Self-Reliant 📊
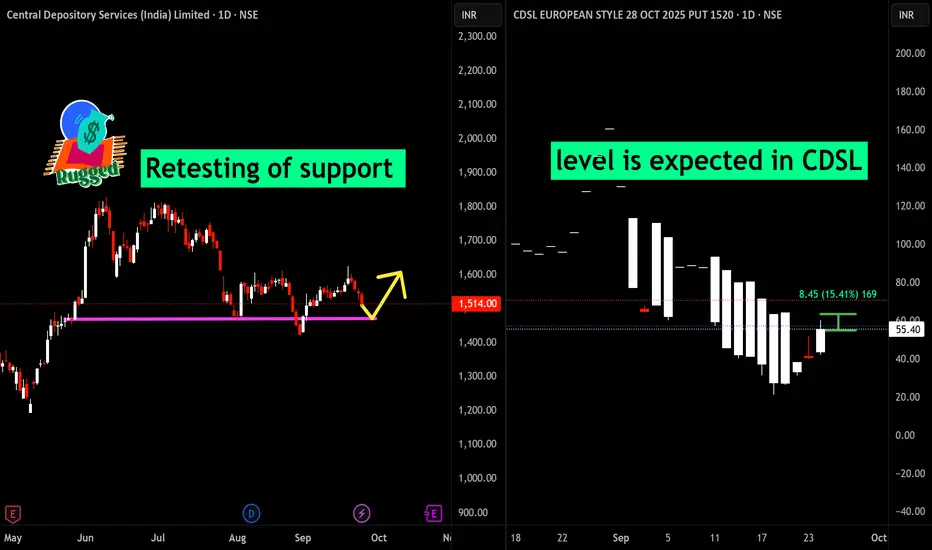
Retesting of Support level is expected in CDSLCDSL is currently retesting its major support zone around 1,300–1,350, indicating a potential bullish reversal in the coming days. The 28 OCT 2025 put option shows a 15% jump from recent lows, signaling renewed strength as the downside move stalls. Technical indicators are turning bullish, with momentum and RSI supporting upward movement. This setup favors swing trades; a bounce from support could bring solid risk-reward. If levels hold, look for upside towards previous resistance, but use strict stop-loss just below support for safety.
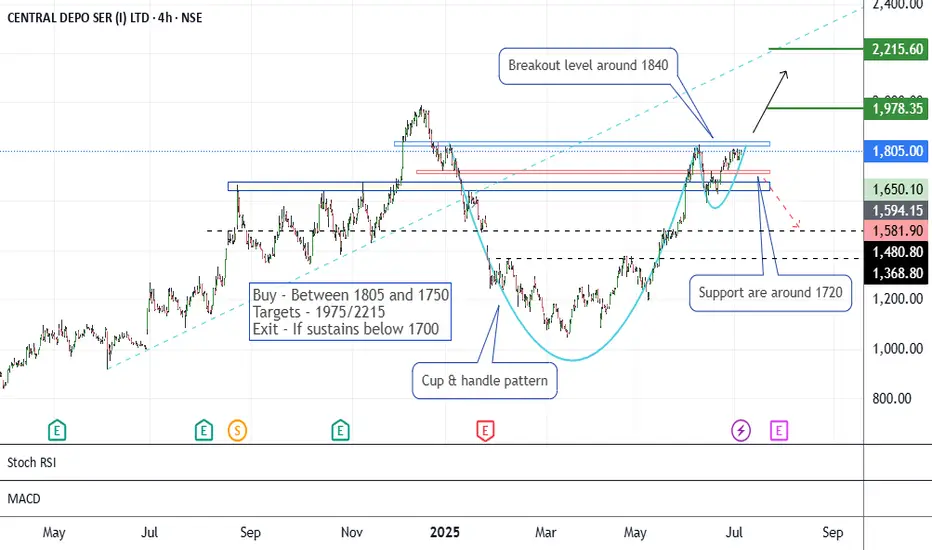
CDSL - An AnalysisThe stock price has formed a Cup & Handle-like pattern since January 2025. This moment is reaching near the breakout levels of 1820-1840.
If it sustains above 1840, it may go bullish to see the levels of 1975/2215.
Support levels are around 1710.
One has to maintain risk management according to the exit levels below 1700.
Second view -
If it does not sustain above the levels of 1840-1860, and slips down below 1700, the setup will show weakness and a bearish view. Then it may go lower to the levels of 1480 and 1365.
All these illustrations are for learning and knowledge-sharing purposes. It should not be considered as a buying or selling recommendation.
All the best.
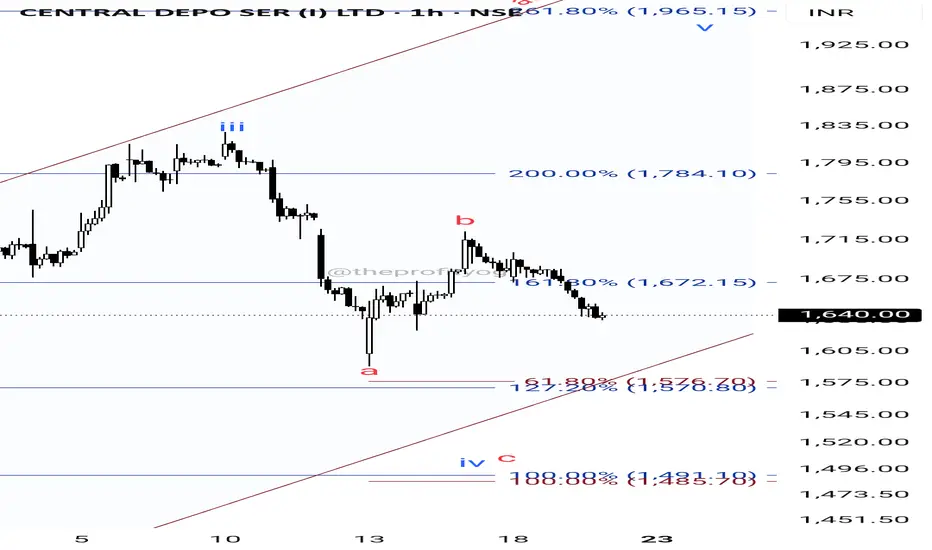
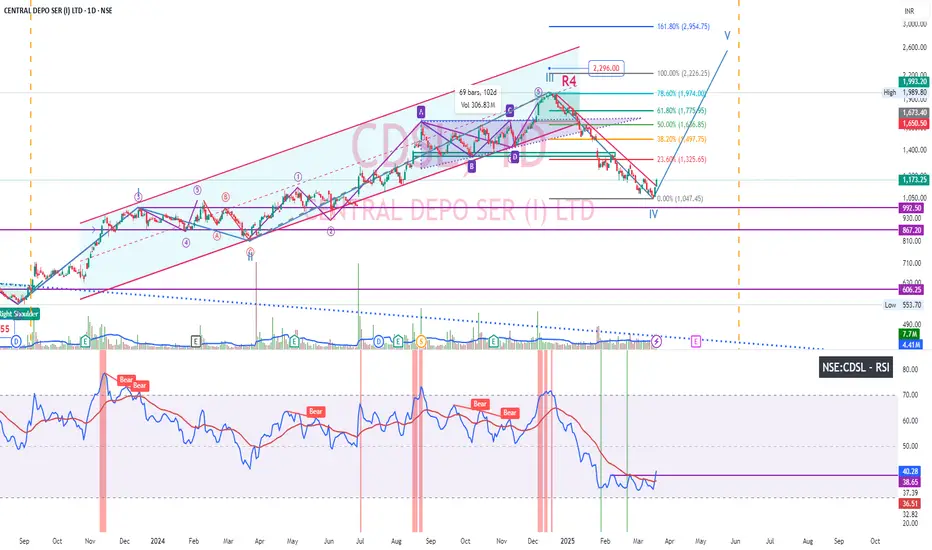
CDSL: Moving as expected, what's next?As predicted, CDSL is in wave 4 now.
Wave 4 is Zig-zag correction in nature.
Currently, it looks like we are in wave C of zigzag.
The targets for this wave C are minimum 61.8% , next targets will be 100% at both these levels we have cluster of fib levels. At these levels wave 4 may complete.
It means, at these levels we can have buying opportunity for wave 5.
But buying is only if there is any bullish candlestick pattern is formed.
For educational purposes only.
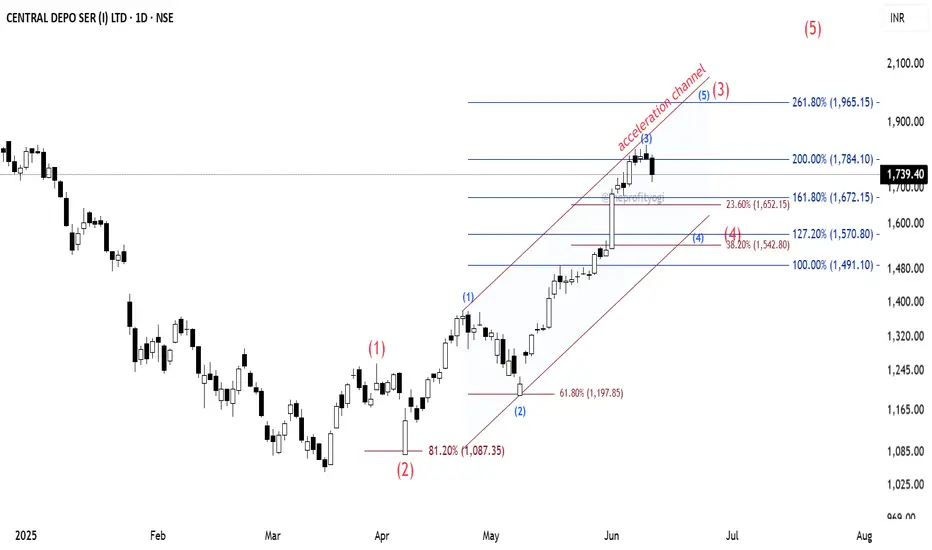
CDSL: Elliott Wave AnalysisThe CDSL daily chart indicates that the stock is in an impulse.
See the counting using Elliott Wave theory where the major wave (2) (shown in red) bounced from the 81.2% level to enter into wave (3).
The subordinate of wave (3) are shown in blue colour, where we can see the subordinate wave (2) of major wave (3) bounced from 61.8%.
To get the possible projection of the subordinate wave (3), I have applied Fibonacci extension to it, and we can see the price is at 200% extension currently. If the recent high is not broken up, we can presume that this is the top of wave (3).
Now, wave (4) will form. And for predicting wave (4) target that I have plotted the Acceleration Channel. This channel can be plotted by joining the line from the top of wave (1) to the top of wave (3) and then its parallel line from the bottom of wave (2).
This channel gives us a hint about where wave (4) may terminate.
Also, I have applied Fibonacci retracement from the bottom of wave (1) to the top of wave (3), and as we know that wave (4) may terminate between 23.6% and 38.2% levels.
So we can get some idea about where wave (4) may complete.
We can see there are clusters of Fib extension and retracement levels near these zones. So we may have a safe buying zone between those.
Important: Here, I have assumed that the subordinate wave (3) is completed.
If the price crosses above the recent top, then we have to replot and recount this study.
This analysis is based on Elliott Wave theory and Fibonacci.
This analysis is for educational purposes only.
This is not any buying recommendations.
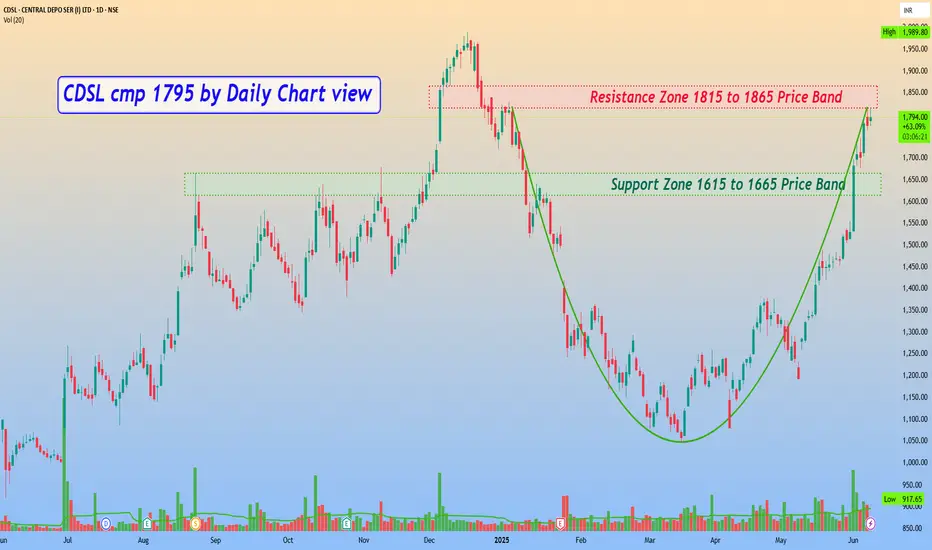
CDSL cmp 1795 by Daily Chart viewCDSL cmp 1795 by Daily Chart view
- Support Zone 1615 to 1665 Price Band
- Resistance Zone 1815 to 1865 Price Band
- Bullish Rounding Bottom has Resistance Zone neckline hurdle
CDSL RESISTANCE BREAKOUTCDSK breaking longterm resistance weekly
with huge volume building up last few week
bullish RSI,trading above all key ema
#target 1950 sl 1500(apply ur own sl)
NO BUY/SELL RECOMENDATION

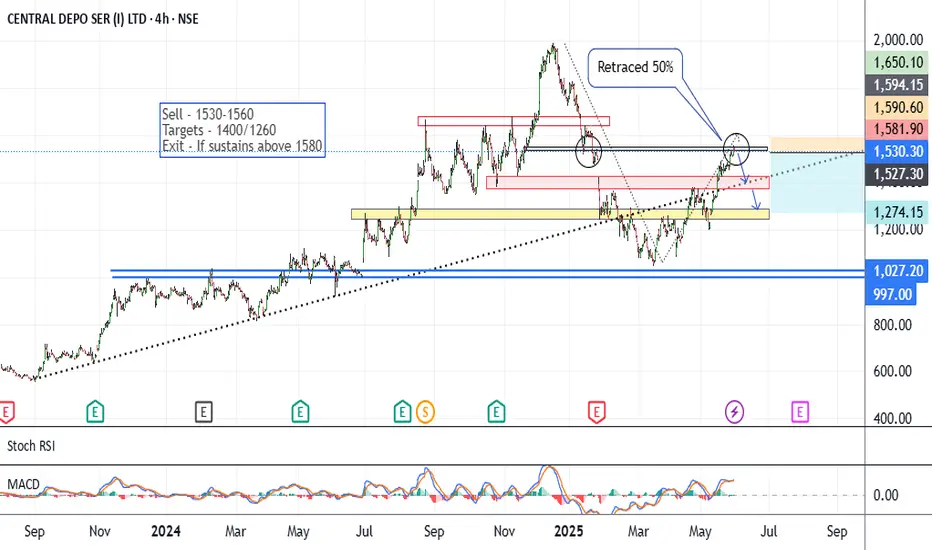
CDSL - Short SetupCMP around 1530 on 01.06.25
The chart is almost self-explanatory. Since March 25, the price has risen by around 50%. This time trading on a likely resistance area.
If price rejects these levels of 1530-1560, it may go into a correction ahead.
Lower targets may be 1400/1260.
The setup weakens if it sustains above 1580 levels.
One should keep the position size according to the risk management.
All these illustrations are provided for learning and sharing purposes only; they do not constitute buy or sell advice. Please do your research before taking any position.
All the best.
CDSL Bullish Cup and Handle Breakout ConfirmLate Published "Only for Educational Purpose"
📊 Pattern Formation: Bullish Cup and Handle
CDSL has officially broken out of a Bullish Cup and Handle chart pattern, signaling a strong technical breakout with high probability of an extended uptrend. This classic bullish continuation pattern took 4 months to form, indicating a well-developed structure with strong base formation.
Neckline Resistance: ₹1380
Breakout Confirmation: Occurred with rising volume, confirming buyer participation
Handle Formation: Characterized by a pullback on declining volume, a textbook sign of weak selling pressure and consolidation before a breakout
📈 Volume & Momentum Indicators
✅ Volume Surge : Confirmed breakout with significant increase in volume — a clear sign of institutional buying
✅ RSI (Relative Strength Index): Currently above 60, indicating strong bullish momentum and room for further upside
✅ Price > 200 EMA: Signals that CDSL is in a confirmed long-term uptrend; the price holding above the 200-day exponential moving average is a strong bullish sign
🎯 Price Target Calculation – Cup and Handle Measurement Rule
Measurement Rule Target:
📌 Target Price = Neckline + Depth of Cup
Neckline: ₹1380
Bottom of Cup (approx.): ₹1180
Cup Depth = ₹1380 - ₹1180 = ₹200
➡️ Projected Target = ₹1380 + ₹200 = ₹1580
🛡️ Stop-Loss (Risk Management)
Choose between Conservative and Aggressive exit strategies:
Conservative SL: Below the lowest low of the handle (approx. ₹1290)
Aggressive SL: Below the breakout candle low (approx. ₹1345)
🔥 Trending Takeaways
CDSL is exhibiting a bullish breakout setup with volume confirmation, strong RSI, and price above 200 EMA. This combination often precedes explosive price action and potential multi-week rally.
🚀 #CDSLBreakout #CupAndHandle #BullishBreakout #TechnicalAnalysis #StockMarketIndia #SwingTrading #MomentumStocks #NSEStocks #ChartPatterns #VolumeAnalysis #StockMarketNews #RSI60 #200EMA #BreakoutStocks #PriceActionTrading
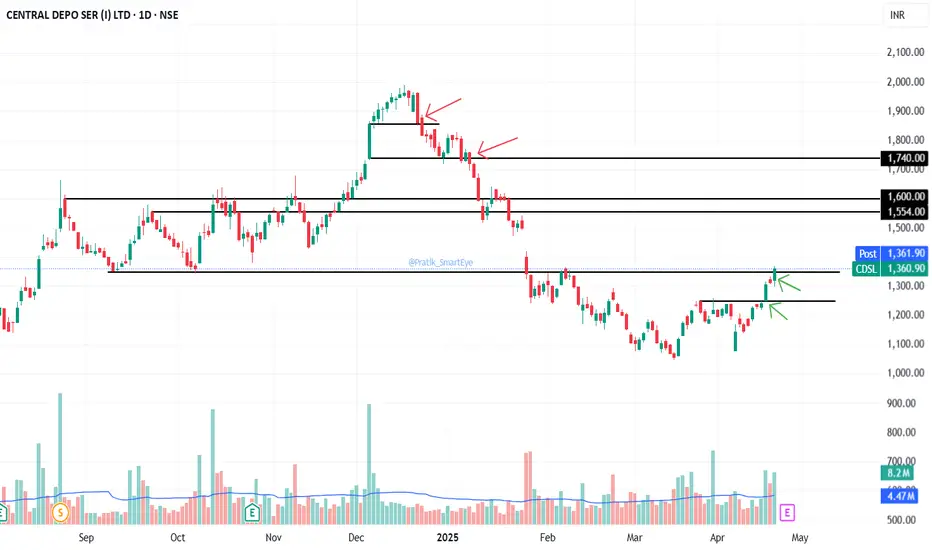
CDSL: at Base Breakout Levels of 1350CDSL: at Base Breakout Levels of 1350. CMP 1360.
Momentum is strong supported with volumes. Sustaining the levels is important.
Results expected on 28Apr2025.
Levels Marked on chart.
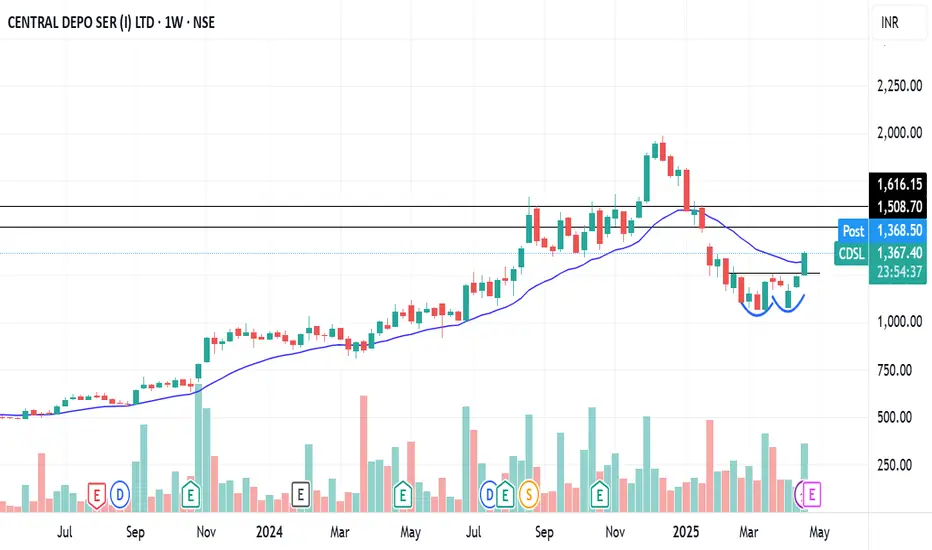
CDSL DOUBLE BOTTOM BREAKOUTCDSL breaking double bottom reversal pattern weekly
with huge volume,rsi positive zone
on the verge of MACD crossover
breaking 20 ema
after breaking 1400 with good volume
#target 1500 then 1600
NO BUY/SELL RECOMENDATION
CDSL Price & RSI Breakout - D timeframeCDSL after reaching ascending triangle target exited parallel channel and corrected 37% and now taking up bullish reversal. Could see breakout in price chart of Daily timeframe. Also RSI breaking out after base formation. Weekly chart Bullish engulfing candlestick pattern.
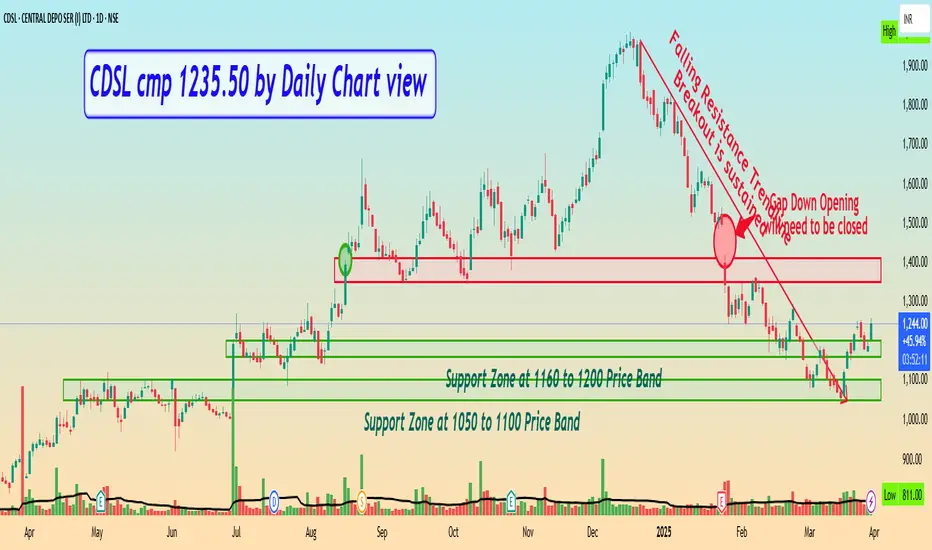
CDSL cmp 1235.50 by Daily Chart viewCDSL cmp 1235.50 by Daily Chart view
- Support Zone at 1050 to 1100 Price Band
- Better Support Zone at 1160 to 1200 Price Band
- Resistance Zone seen at 1350 to 1410 Price Band
- Falling Resistance Trendline Breakout is sustained
CDSL - Multiple Selling PointsStock in LH LL Mode in Daily
Currently has multiple strong selling areas It is bound to make another Lower Low in coming days
First possibility of selling opportunity arises at 1200 to 1220
Second selling area is at 1250 -1290
Third strong selling area is between 1330 - 1355
Forth and final strongest selling pressure area is the Gap zone created between 1425 - 1475
Create & keep multiple alerts as the possibilities are endless in coming days for CE selling / PE buying
Always confirm trades on Multi Time frame before entry with proper SL

CDSL - Technical Chart🇮🇳❣️#cdsl is one of India's premier securities depositories, established in 1999. It plays a crucial role in the Indian capital market by providing electronic storage, transfer, and servicing of securities.
Technical #CHART for your reference.📉💘❣️

Triangle Pattern | CDSL⭕️ Swing Trading opportunity: Price Action Analysis Alert !!!⭕️
FOR EDUCATION PURPOSE ONLY!!!Its just a chart pattern that i am showing to you and lets check where it goes and how it works for future reference
✅Latest CDSL News (November 2024):
▶️issuing bonus shares in a board meeting on July 2, 2024.
▶️Up 79.55% YoY, currently trading near ₹1,617.
▶️Managing over 10.4 crore demat accounts, boosted by retail investor growth.
✅Technical Analysis
📍Strong bullish momentum; trading near 52-week high
📍Support ₹1,550
📍Resistance ₹1,680.
📍RSI Overbought zone, signaling strength.
📍MACD Bullish crossover, indicating upward momentum.
📍Volume High trading volumes confirm price movements.
🎯Positive trend backed by financial strength but watch for market volatility.
💡✍️Applied Tools:-
✅Strong Chart Pattern
✅Channel Pattern
✅Strong Demand Zone
✅100 Day EMA
✅Fundamental Analysis
👉CDSL is one of two Indian depositories, earning from demat accounts, transactions, IPOs, and annual issuer charges.
👉High Net Profit Margins and Return on Equity.
👉Robust financial health.
👉Compare P/E and P/B ratios with peers; consistent dividend payer.
👉Market dependency, competition (NSDL), and regulatory changes.
👉Long-term growth supported by India’s growing financial market and digital adoption.
💡Check out my TradingView profile to see how we analyze charts and execute trades.
🙋♀️🙋♂️If you have any questions about this stock, feel free to reach out to me.
📍📌Thank you for exploring our idea! We hope you found it valuable.
🙏 FOLLOW for more content!
👍 LIKE if you found it useful!
✍️ COMMENT below with your thoughts and feedback!


CDSL : Swing Trade#CDSL #Chartpattern #VCPpattern #swingtrade #structuretrading
CDSL : Consolidation Breakout soon
>> VCP Pattern developing
>> Breakout Candidate
>> Good Strength & Volumes
>> Low Risk High Reward Trade
Swing Traders can lock 10% profit & keep trailing
In the Current Market Scenario, high Chance Breakouts may fail. Trade with proper Risk Management, right position sizing & proper Stop loss rules
Please give a Boost or comment if u r Liking the analysis & Learning from it. Keep showing ur Love by following
Disclaimer : This is not a Trade Recommendations & Charts/ stocks Mentioned are for Learning/Educational Purpose. Do your Own Analysis before Taking positions.

CDSL Attempting BreakoutNSE:CDSL is attempting to breakout. A breakout above 1600 will be very lucrative. What is the trigger here? -> NSDL has got approval for its IPO, valuations will get revised. Portfolio Grade Stock.

Central Depository Services Ltd - Breakout Setup, Move is ON...#CDSL trading above Resistance of 1445
Next Resistance is at 2124
Support is at 999
Here are previous charts:
Chart is self explanatory. Levels of breakout, possible up-moves (where stock may find resistances) and support (close below which, setup will be invalidated) are clearly defined.
Disclaimer: This is for demonstration and educational purpose only. This is not buying or selling recommendations. I am not SEBI registered. Please consult your financial advisor before taking any trade.
