RAIN: Turnaround Fundamental Play,Trendline BO,Chart of the WeekNSE:RAIN When Carbon Giants Face the Perfect Storm of Bearish Signals and Sectoral Headwinds NSE:RAIN showing signs of Fundamental Turnaround. Let's understand this week's "chart of the week"
As per the Latest SEBI Mandate, this isn't a Trading/Investment RECOMMENDATION nor for Educational Purposes; it is just for Informational purposes only. The chart data used is 3 Months old, as Showing Live Chart Data is not allowed according to the New SEBI Mandate.
Disclaimer: "I am not a SEBI REGISTERED RESEARCH ANALYST AND INVESTMENT ADVISER."
This analysis is intended solely for informational purposes and should not be interpreted as financial advice. It is advisable to consult a qualified financial advisor or conduct thorough research before making investment decisions.
Price Action Analysis:
Long-Term Trend Structure:
- The stock demonstrated a spectacular bull run from 2021 lows around ₹75-80 levels to highs of ₹272.75 achieved in mid-2021
- Post the euphoric rally, the stock entered a prolonged consolidation and distribution phase spanning from July 2021 to early 2024
- During 2022-2023, the stock oscillated in a broad range between ₹130 and ₹ 220, forming a rectangular consolidation pattern
- From late 2023 onwards, the stock began showing signs of weakness with lower highs formation
Current Breakdown Phase (2024-2025):
- A decisive breakdown occurred in late 2024 when the stock breached the crucial ₹140-145 support zone
- The stock has entered a steep declining phase, currently trading around ₹124.60 (as of Dec 20, 2025)
- The recent price action shows a sharp downturn with the stock making new 52-week lows at ₹99.90
Volume Spread Analysis:
Volume Trends:
- A massive volume spike is visible in the most recent sessions, reaching approximately 36.64 million shares
- This represents nearly 4x the average weekly volume of around 9.36 million shares
- Historical volume analysis shows earlier spikes during the 2021 peak (around 80 million) and the 2024 rally attempts
Key Technical Levels:
Support Zones:
- Major Support: ₹99.90 - The recent 52-week low and next critical support level
- Psychological Support: ₹100 - Round number support with psychological significance
- Ultimate Support: ₹80-85 zone - Corresponds to early 2023 lows
Resistance Zones:
- Immediate Resistance: ₹135-140 - Previous support turned resistance
- Minor Resistance: ₹150-155
- Major Resistance: ₹165-170
- Strong Resistance: ₹180-185 - Breakdown point of the larger distribution pattern
- Formidable Resistance: ₹200-210 - Multiple failed rally attempts from this zone
Base Formation Analysis:
- No clear base formation is visible in the current structure
- The stock is in an active downtrend without any consolidation base
- The previous base was formed between ₹140-180 during 2023-2024, which has now failed
- A new base formation would require at least 2-3 months of sideways consolidation
- An ideal base would form above the ₹100 psychological level with declining volume
Sectoral Overview:
Industry Classification:
- Rain Industries operates in the Chemicals and Petrochemicals sector
- Specifically focused on Carbon Products, Advanced Materials, and Cement segments
- The company is a leading vertically integrated producer of calcined petroleum coke (CPC) and coal tar pitch (CTP)
- Products serve the aluminium, steel, graphite electrodes, and construction industries
Global Market Position:
- Rain Industries is among the world's largest producers of calcined petroleum coke
- The company is the largest coal tar distiller globally
- Operations span across 14 locations in 8 countries across three continents
- Annual production capacity: 2.4 million tons of CPC and 1.0 million tons of tar distillation
Sectoral Challenges (2024-2025):
- The aluminium industry, which accounts for approximately 42% of Rain's revenues, has faced headwinds
- Global aluminium production continues to expand to meet growing demand, with LME aluminium prices trading around $2,600 per ton
- European aluminium smelters face structural decline pressures due to high energy costs
- Raw material availability constraints have impacted production schedules
- Supply chain issues and challenges in securing raw materials could impact production and costs
Sector Outlook for 2025-2026:
- The global aluminium market is projected to reach $355 billion by 2030, expanding at a CAGR of approximately 4.8%
- Demand growth expected from the automotive industry's lightweighting trend and electric vehicle adoption
- Increasing emphasis on low-carbon aluminium and sustainability initiatives
- Aluminium's recyclability has become significant, with recycling requiring only 5% of the energy needed for primary production
- Infrastructure spending in India and globally should support aluminium and construction material demand
Fundamental Backdrop:
Recent Financial Performance:
- Q3 FY2025 revenue stood at ₹44.76 billion with adjusted EBITDA of ₹6.48 billion
- Q2 2025 showed revenue growth of 17% quarter-over-quarter, driven by higher CPC volumes and prices
- The company operates at approximately 90% capacity utilization
- For Q2 FY2026, the company posted a profit of ₹106.01 crore, reversing a ₹179.11 crore loss year-over-year
Business Segment Performance:
- Carbon Segment: Largest revenue contributor with sales volumes of 664,000 MT in Q2 FY2025
- Advanced Materials: Showed 317% EBITDA growth quarter-over-quarter due to improved seasonality
- Cement Business: Faces challenges, but outlook is improving with infrastructure spending
- Company approved ₹7.57 billion cement expansion with commercial operation date in H2 2027
Financial Health Concerns:
- The company has a low interest coverage ratio and delivered poor sales growth of 4.46% over the past five years
- Return on equity is negative at -0.31% over the last 3 years
- Market capitalization as of November 27, 2025, stood at ₹3,619.08 crore
- High net debt of $699 million could constrain financial flexibility
- PE ratio of -104.48 indicates negative earnings
Recent Developments:
- The company declared a dividend of ₹1.00 per share in June 2025, yielding 1.58%
- Safety performance improved significantly with the Total Recordable Incident Rate decreasing to 0.03 in H1 2025
- Management focusing on cost-saving measures, ESG compliance, and debt optimisation
- Company investigating application of biocarbon materials in its product portfolio
Valuation Metrics:
- 52-week high: ₹180 (touched in early 2025)
- 52-week low: ₹99.80
- Current price: ₹124.60
- Price-to-Book ratio: 0.60 (as of Dec 2025)
- Stock down approximately -27.80% year-over-year, underperforming Sensex's 9.5% gain
Risk Factors and Challenges:
Operational Risks:
- Dependence on raw material availability, particularly green petroleum coke
- Energy cost volatility, especially in European operations
- Capacity utilization challenges impacting profitability
- Competition in battery materials and advanced materials segments
- Planned maintenance activities disrupting production schedules
Market and Sectoral Risks:
- Aluminium industry demand uncertainty in the European and US markets
- Geopolitical tensions affecting global trade and supply chains
- China's production nearing regulatory ceiling could trigger market distortions
- Regulatory changes and environmental compliance costs are increasing
- Potential tariff impacts on international trade
Financial Risks:
- High debt levels constrain strategic flexibility
- Negative operating cash flow concerns
- Low profitability margins despite revenue growth
- Currency fluctuation risks due to global operations
- Interest coverage ratio remaining weak
My 2 Cents:
Fundamental vs Technical Divergence:
- While the company shows operational improvement in recent quarters, market sentiment remains negative
- The gap between fundamental progress and stock performance is widening
- High debt levels and sectoral headwinds overshadow operational gains
- Market positioning the stock as a value trap rather than a value opportunity currently
- Investor confidence needs restoration through consistent delivery and debt reduction
NSE:RAIN represents a classic case of a fundamentally improving company caught in a perfect storm of technical breakdown, sectoral headwinds, and erosion of sentiment. The chart structure has deteriorated significantly, with the stock breaking below multi-year support zones and displaying all characteristics of a sustained downtrend. While the aluminium sector outlook for 2025-2026 appears constructive and the company has shown operational improvements, the market is clearly sceptical about near-term prospects given the high debt burden and challenging market environment.
The coming months will be crucial in determining whether Rain Industries can stabilise around the psychological ₹100 mark or if further capitulation to ₹85-90 levels is in store. Only a decisive reclaim of ₹140 with volume would suggest that the worst is behind, making it a level to watch closely for any signs of trend reversal.
Full Coverage on my Newsletter this Week
Keep in the Watchlist and DOYR.
NO RECO. For Buy/Sell.
📌Thank you for exploring my idea! I hope you found it valuable.
🙏FOLLOW for more
👍BOOST if you found it useful.
✍️COMMENT below with your views.
Meanwhile, check out my other stock ideas on the right side until this trade is activated. I would love your feedback.
As per the Latest SEBI Mandate, this isn't a Trading/Investment RECOMMENDATION nor for Educational Purposes; it is just for Informational purposes only. The chart data used is 3 Months old, as Showing Live Chart Data is not allowed according to the New SEBI Mandate.
Disclaimer: "I am not a SEBI REGISTERED RESEARCH ANALYST AND INVESTMENT ADVISER."
This analysis is intended solely for informational purposes and should not be interpreted as financial advice. It is advisable to consult a qualified financial advisor or conduct thorough research before making investment decisions.
Cementsector

DALMIA BHARATHello & welcome to this analysis
Technical Outlook:
In the monthly time frame its completing the formation of a Cup & Handle breakout suggesting upside levels for medium term 2800 - 3500, for long term 3800 - 5000
Accumulation can be done in the range of 1900 (on downside) 2300 (on the upside).
The view would be invalid if it goes below 1700
Fundamental Outlook
Cost and operational efficiency focus
Recognized as one of the lowest-cost cement producers in India, thanks to measures such as increased use of blended cement, alternative fuels, optimization of lead distances
As of FY25, DBL reported a net debt to EBITDA ratio of ~0.3×, indicating a relatively comfortable leverage position for now.
Growth ambition/scale expansion
The company has achieved an installed capacity milestone of ~49.5 Mtpa (million tones per annum) of cement in FY25. It has set a long-term target of 110-130 Mtpa by ~FY31.
Regional presence & market opportunity
DBL has a strong footprint in the East & South of India, which are seen as growth regions. For example, the FY25 press release emphasized expansion in the East.
Where could margin gains realistically come from?
Better pricing / improved net realizations (higher NSR/ton).
Cost reductions: fuel/coal optimization, higher renewables share, freight savings and logistics efficiency.
Product mix shift to premium / blended cement with higher realizations.
Scale / utilization improvements (spreading fixed cost)
All the best

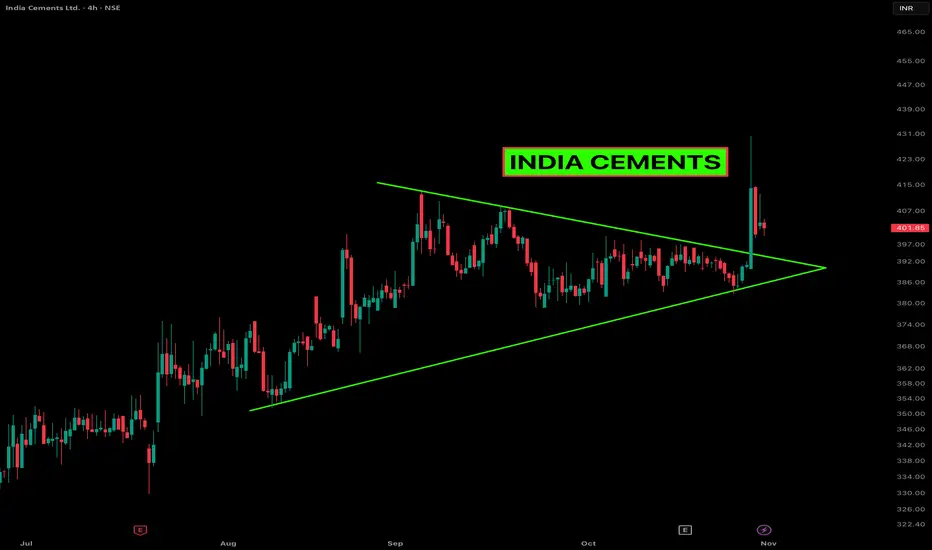
INDIA CEMENTS – Powerful Breakout from a Symmetrical TriangleAfter months of coiling price action, India Cements finally broke out of a clean symmetrical triangle on the 4-hour chart. The breakout came with a solid volume expansion, showing that bulls have been waiting for this move. Price surged quickly past the resistance line, followed by a short pullback — a healthy sign that buyers are trying to confirm the breakout zone as new support.
On the fundamentals side, the company recently approved a ₹4.4 billion capex plan for capacity expansion and modernization — a strong statement of growth intent that’s clearly adding fuel to the technical breakout.
Technically, the structure suggests momentum could continue if the stock manages to stay above the triangle’s upper boundary. The recent price compression and expansion rhythm often lead to strong directional moves, especially when backed by improving volume.
Watching how it behaves around the ₹400 zone will be key — hold above it, and the setup stays valid.
Let’s see if bulls can defend this fresh breakout.
Check out my profile and follow for more live trading setups and chart breakdowns like this.
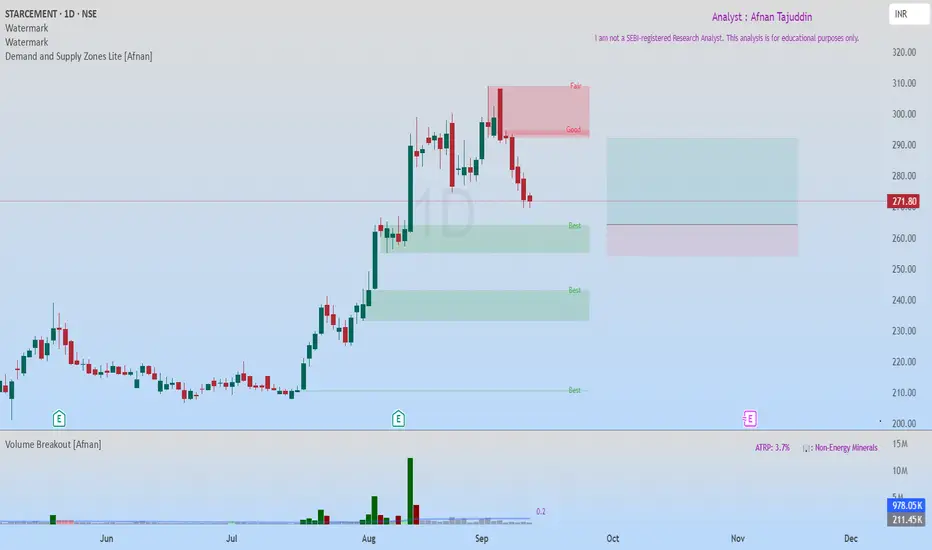
StarCement at Fresh Demand Zone – High Probability Bullish SetupStar Cement recently hit an all-time high and is now retracing towards a fresh Rally-Base-Rally (RBR) Demand Zone . This zone is of high quality, and the overall market structure remains strongly bullish. The best part? There’s no immediate supply zone until a potential 1:2 risk-to-reward target , which makes this setup even more attractive.
🔥 Why This Setup Looks Promising 🔥
The trend is super bullish .
Price is pulling back into demand , creating an opportunity for a low-risk entry.
Demand zone quality is excellent, supporting potential upside continuation.
No major supply zones nearby, leaving room for clean upward movement.
🔄 Two Possible Trade Scenarios 🔄
First Entry Opportunity: Enter near the current demand zone with stop-loss (SL) just below the zone. This is the stronger setup due to the fresh RBR formation.
Second Entry Opportunity: If the first SL gets hit and price dips lower, a secondary demand zone just below provides another entry chance. Place SL below that demand zone for safety.
💡 Risk Management Reminder 💡
While the setup looks strong, risk management remains key . Always place SL below demand zones and size positions carefully. Even the best setups can fail, but disciplined risk control ensures long-term success.
“In trading, it’s not about being right every time, it’s about managing risk and letting probabilities work in your favor.”
🚀 Keep learning, keep practicing, and remember—every pullback is a chance if you know where to look! 🚀
Lastly, thank you for your support, your likes & comments. Feel free to ask if you have questions.
📌 This analysis is purely for educational purposes and is not a trading or investment recommendation. I am not a SEBI registered Analyst.
UltraTech Cement | Pullback Opportunity after Breakout?Description:
- After breaking out of a consolidation zone, UltraTech Cement is showing a controlled throwback towards prior resistance, now acting as support.
- Weekly structure remains intact with sloping EMAs and positive momentum.
- Daily & Hourly charts show minor weakness but no structural breakdown.
- EFI suggests lower TF selling pressure, while weekly remains stable.
📌 Entry Zone: ₹12,037
📉 Stoploss: ₹11,850 (ATR-based)
🎯 Targets: ₹12,937 → ₹13,139 → ₹13,427
Cement sector is gaining strength in the broader infra rally — watching for confirmation on bounce from support.

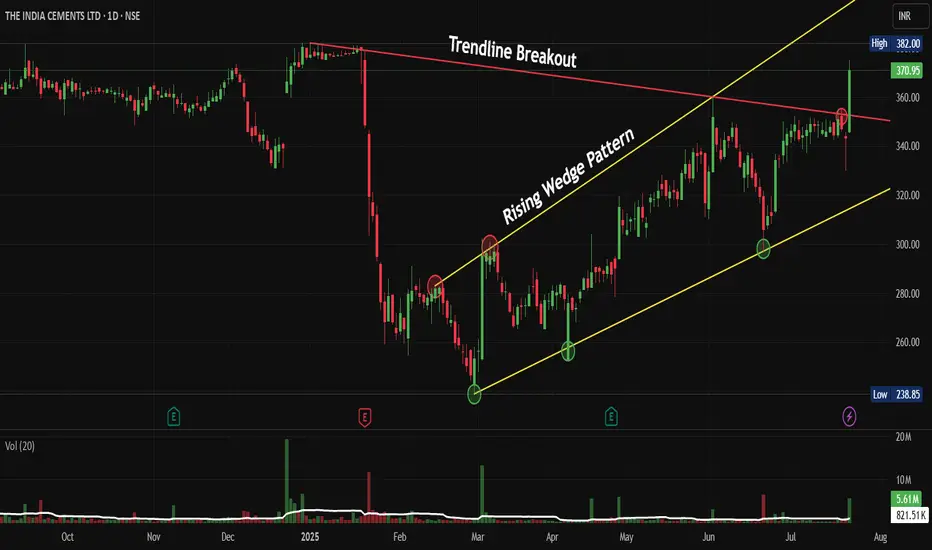
INDIACEM: Trendline Breakout Inside a Rising Wedge PatternNSE:INDIACEM Breaks Key Resistance: Is This the Start of a New Bull Run, after Ultratech Cement's Bullish Commentary Post Results?
Price Action:
• The stock has demonstrated a classic rising wedge pattern formation throughout 2025, indicating controlled accumulation
• Current price of ₹370.95 represents a significant breakout above the Trendline resistance
• The breakout is accompanied by substantial volume expansion (5.61M vs average), confirming institutional participation
• Price has recovered strongly from the March 2025 low of approximately ₹240, representing a 54% rally
Volume Spread Analysis:
• Volume spike visible during the recent breakout phase, indicating genuine buying interest
• Historical volume patterns show increased participation during key support bounces
• Current volume of 821.51K is significantly above average, supporting the breakout thesis
• Volume profile suggests institutional accumulation during the consolidation phases
Technical Patterns and Levels:
Base Formation:
• Primary base established between ₹240-280 levels during February-March 2025
• Secondary base formed around the ₹300-320 range during the wedge consolidation
• Multiple successful tests of these base levels confirm strong demand zones
Support Levels:
• Immediate support: ₹350 (previous resistance now turned support)
• Secondary support: ₹320-330 (wedge midpoint)
• Strong support: ₹300 (multiple bounce level)
• Ultimate support: ₹240-250 (March 2025 low)
Resistance Levels:
• Immediate resistance: ₹380-382 (current high area)
• Next target: ₹400-420 (measured move from wedge)
• Long-term resistance: ₹450-470 (based on pattern projection)
Technical Patterns:
• Rising Wedge Pattern: Successfully above wedge Support with volume
• Trendline Break: Clean break above descending trendline resistance
• Multiple Bottom Formation: Strong base building around ₹240-280 levels
• Volume Expansion: Confirming the validity of the current breakout
Trade Setup:
Entry Strategy:
• Primary Entry: ₹365-370 (current levels on any minor pullback)
• Aggressive Entry: ₹371-375 (momentum continuation)
• Conservative Entry: ₹350-355 (retest of breakout level)
Target Levels:
• Target 1: ₹400 (immediate resistance, 8% upside)
• Target 2: ₹430 (wedge measured move, 16% upside)
• Target 3: ₹470 (extended target, 27% upside)
Stop-Loss Levels:
• Tight Stop: ₹345 (below breakout level, 7% risk)
• Comfortable Stop: ₹320 (below wedge support, 14% risk)
• Long-term Stop: ₹300 (major support breach, 19% risk)
Risk Management:
Position Sizing:
• Conservative Approach: 2-3% of portfolio (given sector volatility)
• Moderate Risk: 4-5% of portfolio for experienced traders
• Maximum allocation: Not more than 7-8% considering stock-specific risks
Risk-Reward Analysis:
• Risk-Reward Ratio: 1:2 to 1:3 depending on entry and stop levels
• Probability of success: High (70-75%) given technical setup
• Time horizon: 3-6 months for target achievement
Portfolio Considerations:
• Diversification across cement stocks recommended
• Monitor sector rotation and infrastructure spending announcements
• Consider hedging through index options if holding large positions
Sectoral and Fundamental Backdrop:
Cement Industry Outlook 2025:
• Industry expects 7-8% growth in cement demand for FY25, driven by infrastructure development
• Government allocated ₹2.87 lakh crore for road infrastructure, supporting cement demand
• Capacity utilization expected to improve to 72% from current levels
• Addition of 35-40 million tonnes of new capacity, primarily in eastern and southern India
India Cements Fundamentals:
• Market capitalization: ₹11,511 crores as of current levels
• Manufacturing capacity: 14.75 MTPA after recent expansions
• Product mix: 35% Ordinary Portland Cement, 65% Portland Pozzolana Cement
• Notable sponsorship: IPL franchise Chennai Super Kings (brand visibility)
• Revenue: ₹1,025 crores in Q1 FY26 (-0.20% YoY decline but improving margins)
Growth Catalysts:
• Infrastructure spending boost from Union Budget 2025-26
• India cement market projected to grow at 7.6% CAGR through 2033
• Rising construction activities in the southern and eastern regions
• Potential for market consolidation benefiting established players
• Promoter holding increased to 81.49% (from 28.42% in June 2024), indicating strong confidence
Risk Factors:
• Raw material cost inflation impacting margins
• Seasonal demand variations affecting quarterly performance
• Competition from larger players like Ambuja Cements
• Environmental regulations potentially increasing compliance costs
• Regional demand concentration in southern markets
My Take:
NSE:INDIACEM presents a compelling technical setup with the successful breakout from a Trendline into a rising wedge pattern. The combination of strong volume support, improving sectoral fundamentals, and a favourable government policy backdrop creates an attractive risk-reward proposition. However, traders should maintain proper position sizing and risk management given the inherent volatility in cement stocks.
Keep in the Watchlist and DOYR.
NO RECO. For Buy/Sell.
📌Thank you for exploring my idea! I hope you found it valuable.
🙏FOLLOW for more
👍BOOST if you found it useful.
✍️COMMENT below with your views.
Meanwhile, check out my other stock ideas on the right side until this trade is activated. I would love your feedback.
Disclaimer: "I am not a SEBI REGISTERED RESEARCH ANALYST AND INVESTMENT ADVISER."
This analysis is intended solely for informational and educational purposes and should not be interpreted as financial advice. It is advisable to consult a qualified financial advisor or conduct thorough research before making investment decisions.
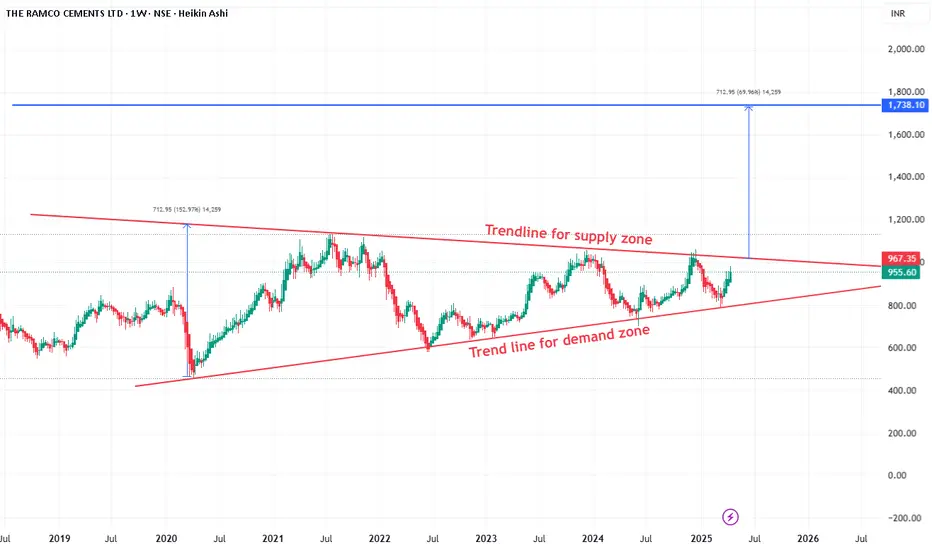
Ramco Cement may give break out of triangle pattern soon.Ramco Cement as per chart is trading on triangle pattern. As per indicator stock is bullish and ready for breakout. Major supply zone is 1010. After crossing this level, it may give massive move for considerable gain. It can accumulate here add more after breakout.
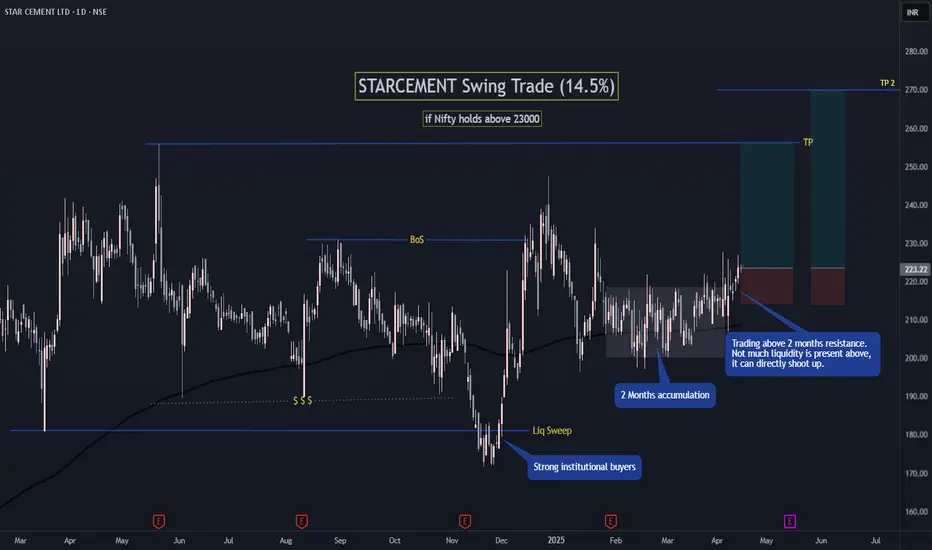
STARCEMENT Swing Trade (14.5%)If Nifty holds above 23000 then Star Cement can go 14.5% to 20% up.
It sweeped major liquidity at a demand zone and gave a BoS, which shows a bullish trend.
From last 2 months the price was consolidating in a zone, but now price has started trading above the resistance of this zone.
Not much liquidity is present above. Price can directly shoot up to ATH.
with1:3 minimum RR.
Follow for more such setups.
Neat & Clean Rectangle Pattern Breakout seen in Top Cement StockHello Everyone, i hope you all will be doing good in your life and your trading as well. Today i have brought another stock which has given Near and Clean Rectangle pattern breakout. Stock name is UltraTech Cement and it is engaged in the manufacturing and sale of Cement and Cement related product primarily across globe.
Okay guy's let's learn something very important about this pattern:
Q:- What is Rectangle Pattern and How to Use Rectangle Chart Patterns to Trade Breakouts?
Rahul:-
A rectangle is a chart pattern formed when the price is bounded by parallel support and resistance levels.
A rectangle exhibits a period of consolidation or indecision between buyers and sellers as they take turns throwing punches but neither has dominated.
The price will “test” the support and resistance levels several times before eventually breaking out.
From there, the price could trend in the direction of the breakout, whether it is to the upside or downside.
we can clearly see Above in Ultratech chart that the pair was bounded by two key price levels which are parallel to one another.
So, Traders, i hope you Guy's have learned today how to Trade Rectangle Pattern, but Mates We just have to wait until one of these levels breaks and go along for the ride!
Remember , when you spot a rectangle: THINK OUTSIDE THE BOX! That's it.
Market Leadership
The company is the 3rd largest cement company in the world, excluding China. It is also the largest cement manufacturer in India with a 22% share of the grey cement capacity.
Let's discuss some fundamentals
- D/E is 0.17
- Interest Coverage ratio 10.73 is higher than last year's Interest Coverage Ratio 10.01
- D/E 0.17 has reduced as compared to last year's D/E 0.18
- ROCE is 15.42%
- ROCE 15.42% has increased as compared to last year's ROCE 13.2%
- ROE is 12.25%
- ROE 15.42% has increased as compared to last year's ROE 13.2%
- ROCE 15.42% is higher than 5 years ROCE average 14.02%
- Operating Profit Margin (EBITDA Margin) is 18.29%
- Operating Profit Margin (EBITDA Margin) 18.29% has improved as compared to last year's OPM 16.79%
- NPM is 9.88%
- Net Profit Margin (PAT Margin) 9.88% has improved as compared to last year's NPM 8.01%
- Company has a negative Cash Conversion Days of -188.47
- Annual Sales has grown by 12.13%
- Annual Profit has grown over by 38.33%
- 3 Years Sales CAGR is 18.67%
- Retail/Public have reduced their stakes by 0.32% in the latest quarter (14.4% to 14.08%)
- Promoters + FIIs + DIIs hold 92.01% in the company
Disclaimer:- Please always do your own analysis or consult with your financial advisor before taking any kind of trades.
Dear traders, If you like my work then do not forget to hit like and follow me, and guy's let me know what do you think about this idea in comment box, i would be love to reply all of you guy's.

NUVOCO VISTA CORP by KRS Charts18th October 2024 / 11:20 AM
Why NUVOCO ❓
1. Although Stock was in Down trend, Recent Dow Theory is in Favour as we can see in Chart.
2. Breakout and Retest and most importantly sustaining the level with new HL.
3. Once fake Buy side Entry with Huge volume is spotted ❗
4. MACD positive crossover and RSI is near 60
All the Bullish Traits will confirming bullish movement is expected soon with breakout ‼️
Target 484 Rs with SL of 320 Rs.

Ramco cements ltd., Looking going; short term investmet; Add this to watchlist and wait for entry.👁️🗨️
For short term investment ;
Leave a " Like If you agree ".👍
.
Wait for small retracement & daily candle to close above - "840".
Trade carefully untill ENTRY level.
.
Entry: 840 / 780
Target: 870-915-1040-1100
sl: 815 (840) / 780 (765)
major stoploss / support: 780.
.
Enter only if market Breaks
"Yellow box" mentioned.
.
.
Don't make complicated trade set-up.📈📉
Keep it " simple, focus on consistency "💹
Refer our old ideas for accuracy rate🧑💻
Follow for daily updates👍
.
Refer old posted idea attached below.

ACC Cement Swing Long Setup - ACC Cement is currently trading at 2506
- ACC has moved up fair from my call out and now looks all set to move higher
- But before turning extremely bullish make sure to factor in a conservative entry
- We can see ACC approaching or retracing back to 2400-2420
- Timing and Location is everything when it comes to swings
- Manage risk properly and just make sure that your location is conservative

ACC Swing Long Setup - ACC is currently Trading at 2429
- Acc is setting up quite nicely to purge higher
- ACC can be added around 2381-2407 that's where my interest lies in order to look for swing longs in it
- Acc has a decent setup overall the invalidation of this trade would be under the Bullish Orderblock

Ramco Cement Swing Long Setup - Ramco Cement looks all set for an expansion
- Ramco is currently trading at 831
- Accumulation Zone - 815-825
- SL - 3%
- Chase - 8%

Ambuja CementsHello & welcome to this analysis
In the short term resistance is near 685 with support at 640 below that 600
Upside potential for the stock above resistance is at least till 800
Overall a very strong stock with not many deep reversals.
Happy Investing

Neat & Clean Breakout In UltraTech Cement.Hello guy's i hope you all will be doing good in your trading and your life as well. I have brought a stock which has given neat and clean breakout on daily and weekly timeframe. Stock name is UltraTech Cement and it is engaged in the manufacturing and sale of Cement and Cement related product primarily in India. Ultratech Cement is the largest cement company in India and 3rd largest cement company in the world (ex-china) and is the largest cement manufacturer in India. It is also the only cement producer outside of China to have 100+ MnTPA of manufacturing capacity in a single country. Its brands include Ultratech Cement, Ultratech Concrete, Ultratech building Products, Ultratech Building solutions & Birla White Cement under which it sells various different products.
Market Cap
₹ 3,11,707 Cr.
Current Price
₹ 10,796
High / Low
₹ 10,909 / 7,941
Stock P/E
44.2
Book Value
₹ 2,086
Dividend Yield
0.35 %
ROCE
15.3 %
ROE
12.3 %
Face Value
₹ 10.0
Industry PE
30.0
Debt
₹ 11,403 Cr.
EPS
₹ 243
Promoter holding
60.0 %
Intrinsic Value
₹ 3,985
Pledged percentage
0.00 %
EVEBITDA
23.7
Change in Prom Hold
-0.01 %
Profit Var 5Yrs
24.1 %
Sales growth 5Years
11.3 %
Return over 5years
18.8 %
Debt to equity
0.19
Net profit
₹ 7,004 Cr.
ROE 5Yr
13.0 %
Profit growth
40.0 %
Disclaimer:- Please always do your own analysis or consult with your financial advisor before taking any kind of trades.
Dear traders, If you like my work then do not forget to hit like and follow me, and guy's let me know what do you think about this idea in comment box, i would be love to reply all of you guy's.
Thankyou.

ORIENT CEMENTORIENT CEMENT just made a W pattern on RSI and some big acceleration is on the way for the target of 296-373-430-480-545
NOTE: I'm not a SEBI REG. Study before investing.

ACCHello & welcome to this analysis
ACC in weekly and daily is consolidating near its highs.
Breakout if it sustains above 2650 else on decline strong support formation near 2500-2450
Overall strong stock with a great track record
Happy Investing

Long Position in Ramco CementLooking at the chart in the higher time frames you can see a clear tap in to the M timeframe OB.
A strong displacement to the upside creating a OB in the W timeframe - unmitigated.
Gap at the top acting as a magnet for price to move into.
Very clean CoCH and BOS giving confirmation of the move up into higher levels.
A great entry be entry in the GOLDEN level of price retracement - 60% fibs
Levels are in confluence with the W +OB.
Expect price to tap into the W +OB and move higher to the magnets (GAP liquidity, trendline short liquidity)

VISAKAIND: Recovery possibleVISAKAIND is in CEMENT PROCESS industry ( CONSTRUCTION ) and showing some buyers interest, as it is at available at discount.
Keep at radar for a target of 122-145-165-180
NOTE: I'm not a SEBI REG. Study before investing.

"Skyrocketing Success: The Rise of Shreecement"?Wait for the daily candle to close and retest.
A beautiful head and shoulder pattern with and increase in volume.
Plan of action -
Entry after retest - 26890-27000
Target 1- 28100
Target 2- 29000.
Disclaimer - education purpose.

ULTRACECMOHello and welcome to this analysis
Stock is attempting a trendline breakout after a 5 month period.
Upside potential above 10500 while below 9500 short to medium term correction cannot be ruled out.
Stock has been an underperformer against the commodity sector while its losing its outperformance against the nifty index.
Happy Investing

Digvijay cement-A multibagger in making?Digvijay cement has given a beautiful cup and handle pattern breakout.
Recently, sock has also retested the breakout and formed huge bullish marubozu candle in weekly time frame.
Stock is looking very strong for a big bull run ahead.
Stock has good fundamentals as well and can be held for long term as well.
It is a good stock for multibagger investment as cement sector will definitely grow with growing infra and realty sector.
Ratios at CMP are attractive
PE ratio is around 18, Dividend yield is above 3%.Zero debt company.
ROE, ROCE is above 20.
Current ratio is above 1 and Price to sales is just around 2.
