GIPCL: Short term to Mid term view-BullishDaily MACD Crossover, Weekly ADX positive trend, and all other indicators showing positive signals. Monthly MACD crossover happened but still price not yet moved much upside. Monthly indicators also positive. It may shootup anytime but patience is important to hold.
Vijayaraghavan.K,
Kovilpatti,Tuticorin Dist.
Centered Oscillators

CESC : MID term view- BullishIt breakout the channel and formed cup and handle pattern . All indicators are bullish Monthly MACD crossover may happen upcoming months. Share split also may approved on upcoming AGM. These parameters may help to reach the target levels.
Vijayaraghavan.K,
Kovilpatti, Tuticorin Dist.


TATA ELXSI : Upmove expectedThe MACD is indicating an upward movement along with gradual increase in RSI.....Upward movement can be seen in 1-2 days.

PTL Enterprises Ltd: Short term & Mid term bullish viewAs per pattern Round bottom and double bottom also. MACD crossover may happen on weekly chart. Dividend also coming Rs.2.5. These parameters may help to reach the target.
Vijayaraghavan.K,
Kovilpatti, Tuticorin Dist.

Steel City Securities: Short term to mid term view BullishInverted head and shoulder pattern. Indicators are showing positive signals. Use every dips for the target. When looking fundamental, It can go more than that the above target level.
Vijayaraghavan.K,
Kovilpatti,Tuticorin dist.


ESCORTSDaily
Price Action - Triangle Breakout from Bottom
RSI > 60 Bullish
MACD - Buy Signal
Bolinger Upper Band - Broken which indicate momentum
ADX needs to increase to pick more momentum
Weekly:-
MACD needs to turn Buy signal
Futures data:-
Long Buildup on breakout

Petronet : Short &mid term view bullishDaily MACD cut, Weekly MACD crossover, Ichimoku cloud top and above conversion line. These parameters may lead to reach the target levels.
Vijayaraghavan.K,
Kovilpatti.

PAGEIND Breakout on Daily ChartPAGEIND Showing a breakout on daily chart and we can confirm it with increase in volume & rising AD Line.
Comment your view.
No Trade Suggestions !!!
Thank You

banknifty bullish momentum trade.After breaking from 33600 level, Nifty has entered momentum zone.
Target- 35800
Support- 33900.

MACD , RSI ,BB BREAKOUTNSE:HINDALCO It gives good idea to buy. tomorrow MACD crosses SIGNAL line and RSI is above 60. As well as it breaks the bollinger band with big green candle .

Alembic Pharmaceuticals ready for a launch✅buy and hold✅
buy @930-38 range
add @ 900
trgt 985-1030-1100+🎯🎯
(period 1-3 months)
why this fall happened ?
there are two major 2 reasons for this fall
first one
🔸profit booking in pharma sector
second one
🔸negative q3 result published.and it's advanced so its fell.
reasons for this buy
🔹anytime we can expect a ride in the stock
🔹chart looks promising
🔹forming ascending triangle
if u are interested in my charts
please 🙏
like🍁comment🍁support

Aries Agro:Short&Mid term view bullishPositive CCI,MACD and ADX also may turn bullish side on day chart. In ICHIMOKU conversion line crossed above base line. These will helps to move upwards.
Vijayaraghavan.K,
Kovilpatti.

BSE : Short & Mid term viewApart from patterns, It may turns bullish side on monthly chart. It is not participated much on market rally. Monthly MACD is positive and also other indicators also showing positive signals. Any time can shoot-up. At first, Daily MACD crossover helps to move upside from the current levels and it may reach the targets on upcoming weeks/Months.
CMP:586.55
Vijayaraghavan.K,
Kovilpatti.

TV18 Broadcast: Mid & Long term bullishRef chart. View given based on weekly and monthly indicators. Monthly MACD crossover and CCI above 0 level will helps to move further target levels.
Vijayaraghavan,
Kovilpatti

APLLTD: Short term viewIt slowly turns bearish to bullish side for short term. MACD Crossover may helps to reach the first target.
Vijayaraghavan.K,
Kovilpatti

emkay golbal fin short term analysisbuy & hold 🤼♂️
buy @70-72 range🌾
trgt 97-113-145+🎯🎯
#multibagger😜
but need patience
✨something cooking in the chart-promosing chart.
✨expecting good return in long term
business model
✨Emkay Global Financial Services Ltd is engaged in the business of providing Stock B roking Services, Investment B anking, D epository Participant Services and Wealth Management Services.
study then invest.

Greaves Cotton whats gonna happen guyssomething cooking in the chart🏋️♀️🏋️♀️
whats gonna happen guys ???
i am not mentioning anything.🙏
u can comment below what's your view about it.(just comment what u see in the chart)🍁🍁
try to feel what really the stock / company / chart cooking💰💰
postive q3 published💰
about greaves cotton
Greaves Cotton is engaged in manufacturing of engines, engine applications and trading of power tillers, spares related to engines, electric vehicles and infrastructure equipment etc.
support🍁like🍁comment🍁

HMVL:Short and mid term bullishIt loosing the grip from bearish side. Indicators are showing positive signals. It may go further upside on upcoming weeks/Months.
Vijayaraghavan.K,
Kovilpatti.

NB Venture: Short & Mid term BullishRef Chart. Indicators are bullish on Daily, Weekly and Monthly charts.
Vijayaraghavan.K,
Kovilpatti.

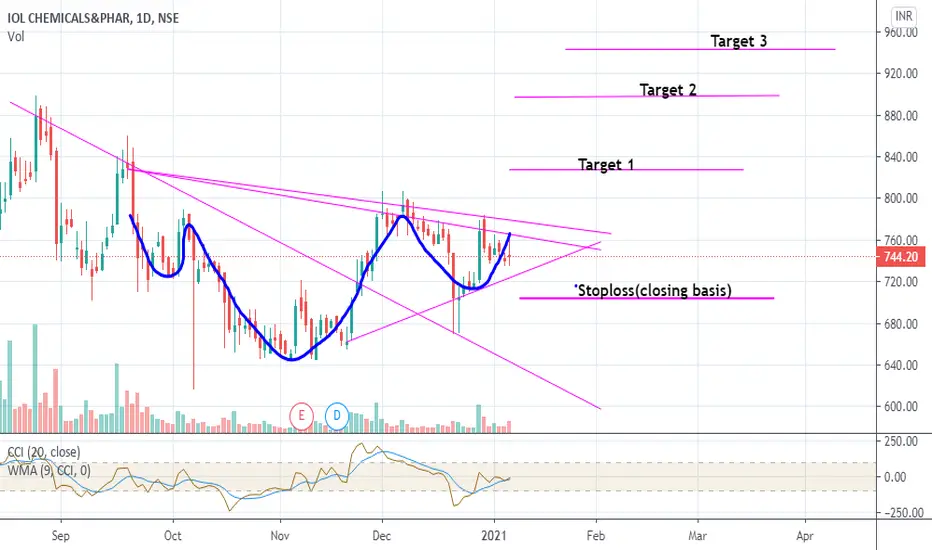
IOLCP: Short& Mid term view BullishRef chart. MACD crossover may happen on upcoming days in daily chart. This will trigger to price shoot-up. In daily chart Indicators are turning bullish from bearish . In monthly chart indicators are continuing the bullish momentum last few months. From this level it may move the further upside. Targets are given by using patterns.
****Note: If you noticed my earlier views, most of the views given before breakouts by using indicators. Risk takers no issues but Safe traders can take the trade after breakout.
Vijayaraghavn.K
Kovilpatti.
Dhanlakshmi Bank: Short term bullish viewDaily and weekly indicators showing bullish signals and monthly indicators also showing positive momentum. These will helps to reach the given target levels. Breakout also done.
Vijayaraghavan.K,
Kovilpatti
