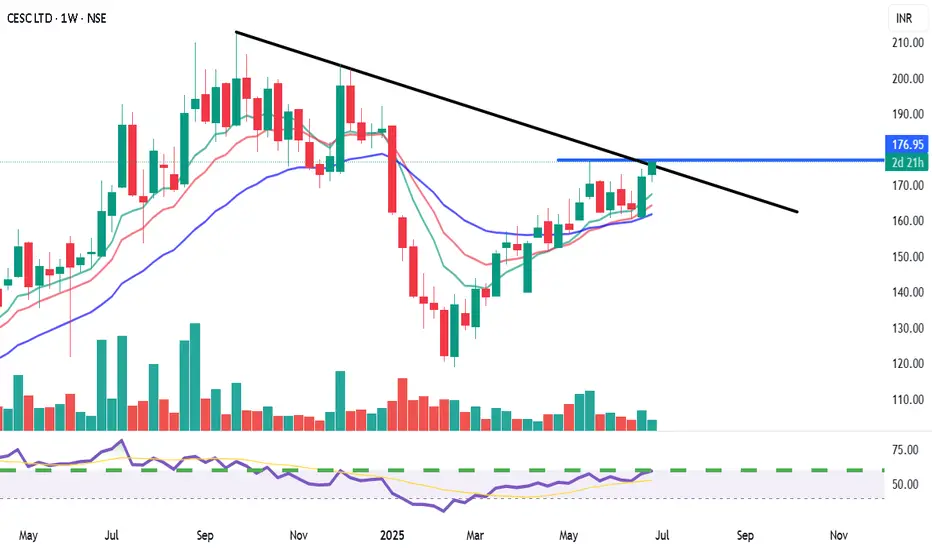
CESC Ltd. (NSE: CESC) - Weekly Chart AnalysisView: Bullish on confirmed breakout.
Bias: Positive momentum.
Strategy:
BUY: Above ₹178-180 (on weekly closing basis, confirming trendline and resistance breakout).
Targets (T):
T1: ₹195-200
T2: ₹210-220+
Stop-Loss (SL): ₹168 (on weekly closing basis).
Reasoning:
Attempting a breakout from a significant descending trendline.
Cleared horizontal resistance at ₹175.
Bullish crossover in moving averages with price above all MAs.
Strong RSI and supportive volume.
Potential for a major trend reversal.
Note: This is an educational analysis and not financial advice. Do your own due diligence before investing.
CESC
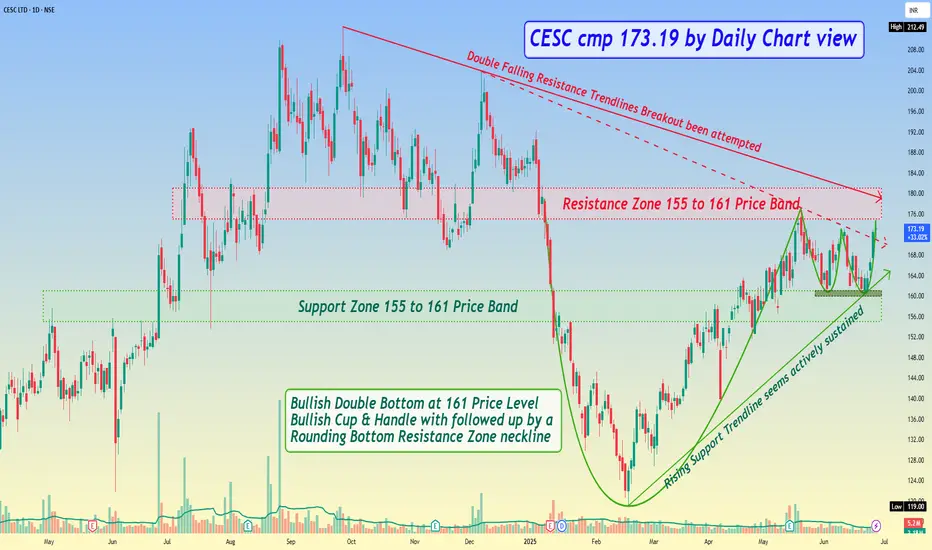
*CESC cmp 173.19 by Daily Chart view**CESC cmp 173.19 by Daily Chart view*
- Support Zone 155 to 161 Price Band
- Resistance Zone 155 to 161 Price Band
- Bullish Double Bottom at 161 Price Level
- Rising Support Trendline seems actively sustained
- Volumes spiking seen in sync with the avg traded quantity
- Double Falling Resistance Trendlines Breakout been attempted
- Bullish Cup & Handle with followed up by a Rounding Bottom Resistance Zone neckline
Bullish trap in CESC: Ascending channel.Two points are showing a bullish trap in CESC chart (daily timeframe):-
1. Prices are exhausting in the channel. A volume spike is needed for the channel breakout, which is missing here.
2. Prices made higher highs, but RSI made lower highs, showing divergence. This means there are good chances for a bearish breakout.
3. A failed breakout from the lower channel will pull prices back to test the higher trendline of the channel. RSI breaking the 75+ will be a bullish signal for the prices to go for the higher targets.

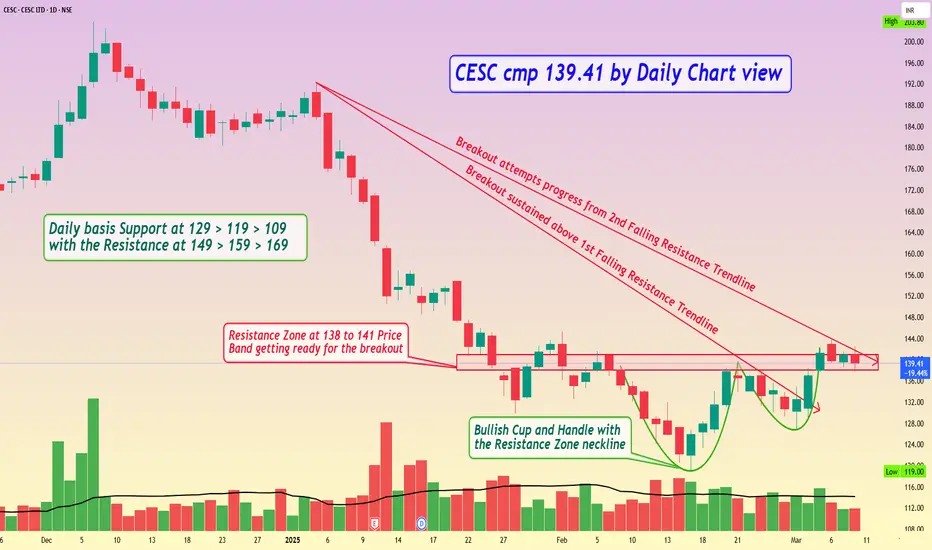
CESC cmp 139.41 by Daily Chart viewCESC cmp 139.41 by Daily Chart view
- Bullish Cup and Handle with the Resistance Zone neckline
- Breakout sustained above 1st Falling Resistance Trendline
- Breakout attempts progress from 2nd Falling Resistance Trendline
- Resistance Zone at 138 to 141 Price Band getting ready for the breakout
- Daily basis Support at 129 > 119 > 109 with the Resistance at 149 > 159 > 169
long cescfor 20% upside, lic increased stake from 3.41% to 4.70%
1. take your own risk,
2 .cesc is taking weekly support
3. lic with us

Cesc double topMade double top at 209
broke trendline , broke 200 dma,
bearish triangle breakout
and retest or pullback to 200 dma is shorting opportunity
closing above 200 dma can be taken as SL
however rsi is little over sold ,short term might have pull back so pefer lower time frames to trade , usually triangle broader length would be target
Disclaimer- Just my view and opinion trade at your own risk not an investment advice these are only for educational purposes

2 Amazing swing trading ideas for 4 December 2024I daily make educational content videos for swing / positional trading

CESCCESC price distribution is happening on 4 hour chart. it may trying to bounce upto 210 and then next LPSY may be formed and give fresh round of selling.
But pls be caution that wyckoff patterns takes lots of time and they are tough to trade considering the spikes in opposite direction of the trend.

CESC is getting ready for big move!Hey Family, there is a one more stock Which is showing a great opportunity.
Key Points:-
* Formation of Ascending triangle Pattern in Daily TF.
* From Jul 2024 to Aug 2024 Moving in a range.
* From Jul 2024 to Aug 2024 Tested & Moving Near Resistance zone.
* It's near resistance Zone and trying to break Resistance Zone with good volume.
* Volume Accumulation (Volume is Rising).
What is your view please comment it down and also boost the idea this help to motivate us. We are Certified. All views shared on this channel are my personal opinion and is shared for educational purpose and should not be considered advise of any nature.

CESC : Momentum Stock
📍#CESC : #Momentum Stock
>> Range Breakout & Retest Done
>> Trending Setup
>> Good Strength & Volume
>> Low Valuation Stock
Swing Traders can lock 10% profit & keep trailing
Please give a Boost or comment if u r Liking the analysis & Learning from it. Keep showing ur Love by following
Disclaimer : This is not a Trade Recommendations & Charts/ stocks Mentioned are for Learning/Educational Purpose. Do your Own Analysis before Taking positions.

CESC - Cup and Handle BreakoutCESC Limited is an integrated electrical utility and holding company. The Company is engaged in the generation and distribution of electricity across approximately 570 square kilometers of licensed area in Kolkata and Howrah, West Bengal.
TTM EPS: 10.92
TTM PE: 8.99
P/B: 1.20
Face Value: 1
Mkt Cap (Rs. Cr.): 13,017
Dividend Yield: 4.58
Sector PE 17.62
Book Value Per Share: 82.30
Positives:
Strong Momentum: Price above short, medium and long-term moving averages
New 52-week high today
Increasing Revenue every quarter for the past 2 quarters
Company with Zero Promoter Pledge
FII / FPI or Institutions increasing their shareholding
Negatives:
MFs decreased their shareholding last quarter
Inefficient use of capital to generate profits - RoCE declining in the last 2 years
Inefficient use of shareholder funds - ROE declining in the last 2 years
Inefficient use of assets to generate profits - ROA declining in the last 2 years
Poor cash generated from core business - Declining Cash Flow from Operations for last 2 years
Declining Net Cash Flow: Companies not able to generate net cash
NOT A RECOMMENDATION. JUST FOR EDUCATION PURPOSE. Thanks

Swingtrade in CESC.Over the past 14 years, the price has been moving within a rectangular channel pattern. It goes up and then comes back down to a support level, creating a significant demand and supply zone.
Currently price trading at 25% down from its all time peek. As visible price has formed another parallel channel pattern inside the bigger pattern. It seems all set to give a breakout in daily timeframe.
If the price breaks out with high trading volume and stays above the line, it's a good signal to start trading. We can go long (buy) and aim for at least a 18% gain from our entry point.
Buy- 79
Targets- 94, 96.5
Stoploss- 74
Please note I am not SEBI registered. Do consult with your Finance adviser before investing.
#SwingTrading #technicalAnalysis

Buy before dividend news as this will trigger a breakoutDividend will always be paid in Jan month and this will be the trigger, min 4 Rs dividend expected as the debt service has increased
As H1 has performed better than previous years H1, this will give a good move till 85 levels

CESC Daily looking bullishCESC Daily has trendline breakout also good marubozu candle at buying zone.
Good to buy at 76 for target of 86 with sl below 71

CESCBroke out the channel , retracing , if takes support and moves up , big momentum waiting. Keep your stop loss.

CESC Looking Bullish on Daily ChartCESC Long term trendline BO with 200 ema support on daily candle
Good to buy at 81 for target of 97-100
with SL below BO candle i.e. 77
Good RR

CESC - TWIZZER BOTTOMCESC - 26.03.2022
CMP - 77.45
TARGET- 82,88,95 ; SL - 69.5
TWIZZER BOTTOM formation at support level in Weekly time frame, Increasing Volume
Disclaimer - For Education Purpose

CESC has broken the day downtrend and is moving upsideCESC has broken the day downtrend and is moving upside. I already have taken the trade with a 1 rupee stop loss and 5R target. one can still take this very low-risk trade.
Please do your own research before taking any trade.

Long idea CESCCESC , long above 90.50 with a Target of T1: 93 T2: 95, T3: 98,
Strict stop loss of 88.
This idea is for educational purpose only

CESC has broke resistance after 3 years , Strong Fundamentals I will buy CESC because :
The price has broken the resistance after 3 years
It showed a good move upwards before breaking Resistance.
The price is now at support the resistance may act as SUPPORT.
Entry : 93
Target : 127
Stop loss : 86

CESC Consolidation and Flag & Pole Buy @ 80 Target 100.
CESC is fundamentally a very good stock. It is in uptrend. You can BUY according to the Flag and Pole pattern @ 80 and Target is @100


