Early Week Correction Ahead of Heavy News Flow GOLD PLAN – July 14 | Early Week Correction Ahead of Heavy News Flow
📰 Macro Context – Volatile Week Expected
Gold opened this week with a sharp correction, retracing after sweeping liquidity from the previous 2-week FVG zone. This early reaction reflects investor caution ahead of key tariff-related announcements due later this week.
In addition to geopolitical factors, the market is also bracing for major US economic data, including:
📊 CPI (Consumer Price Index)
📊 PPI (Producer Price Index)
📊 Unemployment Claims
📊 Retail Sales Figures
These events combined make this a high-volatility week with potentially strong directional moves in the second half.
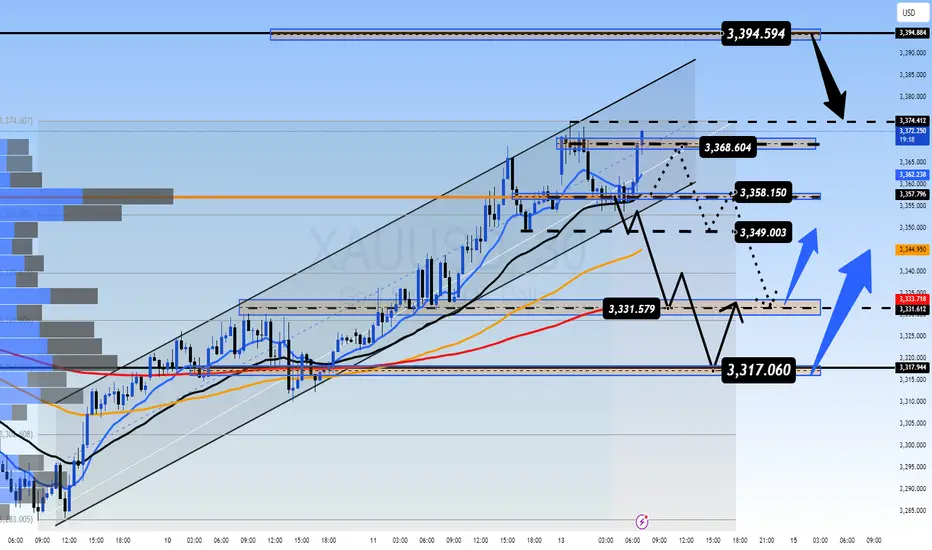
📉 Technical Outlook – M30 Timeframe
Price has taken out minor liquidity above recent highs
Currently retracing over $15 from the top
Price is now trading below the intraday VPOC (around 3358) — suggesting potential bearish momentum
If momentum continues, gold may dip into key demand zones:
🎯 333x
🎯 Possibly lower into 332x
This could provide a healthy retracement before resuming the broader uptrend.
🧭 Trading Strategy
✅ BUY ZONE: 3331 – 3329
Stop-Loss: 3325
Take-Profits:
TP1: 3335
TP2: 3340
TP3: 3344
TP4: 3350
TP5: 3360 – 3370+
🔍 This zone aligns with prior support, potential liquidity traps, and EMAs on higher timeframes — high-probability area for bounce trades if volume confirms.
⚠️ SELL ZONE: 3393 – 3395
Stop-Loss: 3399
Take-Profits:
TP1: 3390
TP2: 3386
TP3: 3382
TP4: 3378
TP5: 3374 – 3370 – 3360
📉 Great for short-term scalps if price re-tests the zone and shows rejection signs, especially around key news events.
📊 Key Levels to Watch
🔺 Resistance Zones
3358
3368
3374
3394
🔻 Support Zones
3349
3340
3331
3318
⚠️ Execution Notes & Sentiment
🕰️ At the time of writing, gold is consolidating near the M30 VPOC with no clear break in either direction.
🧘 Stay patient and wait for clear confirmation from European session volume
🚫 Avoid FOMO trades — stick to structure
✅ Respect all SL/TP levels to protect your capital
This week’s volatility will reward discipline, not speed.
📌 Summary
Gold is currently in a short-term pullback after reaching previous liquidity zones.
There’s potential for a deeper dip early this week before macro news pushes price decisively.
📌 3331–3329 remains the primary BUY zone to watch if price shows bullish confirmation.
📌 3393–3395 remains the key SELL zone for potential short-term rejections.
🔍 What’s your view this week? Are you looking to buy the dip or short the bounce?
💬 Drop your thoughts in the comments — let’s discuss setups!
✅ If this helped you, hit that like & follow for more daily plans.
📩 Want private signals & deeper trade setups? DM to join our premium group.
Cfdtrading
XAUUSD 01/07: GOLD'S RELIEF RALLY FROM A MONTHLY LOWXAUUSD 01/07: GOLD'S RELIEF RALLY FROM A MONTHLY LOW – USD WEAKENS, BUT CLEAR MOMENTUM IS STILL MISSING
🌍 Market Overview – USD Weakness & Gold's Rebound Potential
After a significant drop to a one-month low, Gold is beginning to recover slightly, partly due to a weaker USD, improving market sentiment. However, the rally remains cautious and still lacks a strong momentum to push gold decisively higher.
💵 USD Weakness: Can Gold Continue to Rebound?
Recent US economic data has shown a slight decline in consumer spending, which has led to speculations that the Federal Reserve may take a more dovish stance on interest rates in the near future. This has weakened the USD, providing room for Gold to rebound slightly.
That said, there hasn't been a significant catalyst to push Gold into a strong breakout yet.
📉 The Fed is Still the Key Player
The market is closely watching the Fed's next moves. However, there’s a divide on whether interest rates will be cut or maintained. The recent US data isn’t weak enough to warrant a policy change from the Fed, but it’s also not strong enough for the Fed to keep its hawkish stance intact.
This leaves Gold in a limbo, with no clear direction in the near term. Gold is caught between weak expectations of further rate cuts and the ongoing strength of the USD.
🧠 Analysis for Traders:
Gold is responding lightly to macroeconomic factors but hasn’t established a strong trend. This is a period prone to market noise—Gold may jump up and down on news, but the momentum required to establish a consistent trend is lacking.
Traders should monitor USD movements and US labor data closely this week, especially the NFP report, as this could provide more clarity for Gold’s future direction.
✍️ Conclusion:
Gold is recovering from its lows, but it remains uncertain.
The Buy side hopes for rate cuts by the Fed.
The Sell side is betting on USD strength.
As for us traders, let’s stay patient, observe closely, and be ready for the next move. The big wave may still be coming, but smaller price actions right now could give us clues for the upcoming trend.
🔶 Key Levels & Strategy:
Current Support Zone: Gold is holding above the critical psychological support levels of 3300-3304. If the upward momentum continues, a move towards 335x-337x is highly possible in the near term.
Liquidity Gap: Currently, there’s a liquidity gap at the higher levels. The goal is for Gold to rise further to fill this gap before any deeper retracement occurs.
📈 Trading Plan:
BUY ZONE: 3303 – 3301
‼️ SL: 3297
✔️ TP: 3306 → 3310 → 3315 → 3320 → 3325 → 3330 → ???
SELL ZONE: 3358 – 3360
‼️ SL: 3364
✔️ TP: 3354 → 3350 → 3345 → 3340 → 3320
⚡ Final Thoughts:
As the market awaits further data, keep an eye on these key support and resistance levels for your trading setups.
The overall trend is still upward, but short-term volatility is expected. Make sure to follow your risk management strategies.

30/06: WILL WE SEE A RECOVERY ON THE LAST DAY OF THE MONTH? GOLD PLAN – 30/06: WILL WE SEE A RECOVERY ON THE LAST DAY OF THE MONTH? ☄️
✅ Macro Context – Focus on USD Debt and Political Pressure
As June comes to a close, the US faces a major $6 trillion debt maturity from COVID-era borrowings, creating potential stress on USD liquidity and overall market sentiment.
Gold saw a sharp dip to the 32xx range during the Asian session but has bounced back and is currently hovering near last week's closing levels.
While the medium-term outlook remains bearish, short-term signals are showing signs of a potential recovery.
✅ Political Catalyst:
Trump’s Pressure on Fed: Trump is pushing the Federal Reserve to cut interest rates to 1%-2%, saying he won’t appoint anyone unwilling to ease monetary policy.
This has sparked expectations for potential rate cuts, which could provide support for gold prices in the near term.
✅ Technical Outlook – Multi-timeframe Structure
Gold continues its downward correction on higher timeframes. However, short-term candles are indicating recovery momentum, with buying activity near the 327x zone.
Today's Strategy: Focus on short-term BUY setups that align with the recovery wave.
✔️ Key Resistance & Support Levels
🔺 Resistance: 3283 – 3291 – 3301 – 3322
🔻 Support: 3277 – 3271 – 3259 – 3247
🔖 Trade Scenarios
✅ Buy Scalping
🔺 Entry: 3272 – 3274
🔹 SL: 3268
✔️ TP: 3282 → 3288 → 3298
✅ Buy Zone
🔺 Entry: 3249 – 3251
🔹 SL: 3244
✔️ TP: 3265 → 3282 → 3295 → 3310
💠 Sell Scalping
🔺 Entry: 3298 – 3300
🔹 SL: 3304
✔️ TP: 3292 → 3282 → 3270
💠 Sell Zone
🔺 Entry: 3327 – 3329
🔹 SL: 3333
✔️ TP: 3322 → 3310 → 3298 → 3282
⚡️ Final Note
As we near the end of the month, expect possible volatility due to USD flows and institutional rebalancing, which could create further opportunities in the gold market.

Gold at Crucial 325x Support – What's Next for the Yellow Metal?XAUUSD D1 Forecast: Gold at Crucial 325x Support – What's Next for the Yellow Metal?
Namaste, fellow traders!
Today, let's zoom out and look at the bigger picture for Gold (XAUUSD) on the Daily (D1) timeframe. Our analysis indicates that Gold has hit a very strong, hard support level around the 325x region. This is a pivotal point that could dictate Gold's medium to long-term direction!
🌍 Macroeconomic Context: The Forces at Play for Gold
While we've seen some USD weakness due to speculations surrounding the Fed (like the rumors about replacing Powell) and expectations of rate cuts, these factors haven't completely prevented Gold's recent decline on the daily chart. Also, the sustained ceasefire between Israel and Iran is reducing Gold's safe-haven appeal.
However, the current price action at the robust 325x support level is a significant technical signal. The influence of upcoming US macroeconomic data (especially the PCE Index on Friday) and speeches from FOMC members will be crucial in confirming or negating Gold's next moves. If positive news for Gold aligns with this support holding, it could act as a strong catalyst.
📊 XAUUSD Technical Analysis (D1): Predicting Gold's Next Move
Based on the fact that Gold has encountered strong support at 325x, we can anticipate the following scenarios:
Bounce from 325x (Potential Upside Phase):
If the 325x area (which reinforces the 3264.400 support from image_e9d325.png) holds firm, we expect a strong reaction and an upward move for Gold.
The initial target for this bounce would be the 332x region, which aligns with resistance levels 3313.737 - 3330.483 from our previous analysis. On a broader timeframe (as shown in image_83845c.png), this corresponds to the resistance zone around 3326.022. This 332x area could represent a continuation pattern, meaning it might be a corrective rise before the resumption of the larger trend.
Resumption of Downtrend (After Reaching 332x):
Once Gold reaches and tests the 332x zone (3313.737 - 3330.483 / 3326.022) and shows bearish confirmation signals (e.g., a strong bearish engulfing candle, a pin bar, or a clear top formation), we anticipate a resumption of the downward movement.
The next major target for this fall would be the 317x area, which correlates well with the strong support at 3173.052 on the larger timeframe (as depicted in image_83845c.png).
🎯 XAUUSD D1 Trading Plan: Your Long-Term Strategy Ahead!
Considering the current D1 analysis, here's our actionable plan:
1. BUY PHASE (Bounce from Support):
Entry: Observe price reaction in the 325x - 326x zone (especially 3264.400). Only buy if there are clear bullish confirmations (e.g., a confirmed bullish pattern on the daily or 4-hour candle, a strong bounce from the zone with volume).
SL: Just below the 325x support zone (e.g., 3245-3240, depending on confirmation).
TP: 3280 - 3290 - 3300 - 3313.737 - 3326.022 (key 332x zone). This will be our primary target for the bounce.
2. SELL PHASE (Downtrend Resumption):
Entry: After the price reaches the 332x zone (3313.737 - 3330.483 / 3326.022) and shows bearish confirmation signals (e.g., strong bearish engulfing, pin bar, or top formation).
SL: Slightly above the 332x zone (e.g., 3335-3340).
TP: 3300 - 3290 - 3280 - 3270 - 3260 - 3250 - 3200 - 3173.052 (final 317x target).

XAUUSD: Gold's Golden Glow Fades Below $3350 XAUUSD: Gold's Golden Glow Fades Below $3350 – Navigating Key Levels Amidst USD Weakness!
Let's dive into the fascinating world of Gold (XAUUSD) today. The yellow metal is showing subtle positive movement, primarily influenced by a weaker US Dollar, but a convincing bullish breakout above the $3350 mark remains elusive.
🌍 Macroeconomic Snapshot: USD's Woes & Gold's Mild Support
Gold has seen a slight positive bias for the second consecutive day, yet it's struggling to find significant follow-through, staying below the $3350 level in early European trading.
USD Under Pressure: Reports indicating that US President Donald Trump is considering replacing Fed Governor Jerome Powell have sparked concerns regarding the future independence of the US central bank.
Cautious Outlook: This mixed bag of news calls for caution before confirming a definitive bottom for Gold or positioning for a substantial recovery from levels below $3300 (or Tuesday's two-week low). Traders are currently focused on upcoming US macroeconomic data and speeches from FOMC members, which could influence XAU/USD ahead of Friday's crucial US Personal Consumption Expenditures (PCE) Price Index release.
📊 XAUUSD Technical Analysis & Intraday Trading Plan:
Current Trend: Gold has recently experienced a sharp decline and is now in a consolidation phase, trading around the $329X mark. Price is currently below shorter-term moving averages, indicating lingering bearish pressure or an accumulation phase.
Key Levels Identified:
Strong Support Zones (Potential BUY Areas): Levels around 3294.414, 3276.122, and particularly 3264.400 are crucial demand areas.
Key Resistance Zones (Potential SELL Areas): Levels at 3313.737, 3321.466, 3330.483, and 3341.947 are identified as significant supply zones.
🎯 XAUUSD Trading Plan (Based on your specified levels):
BUY ZONE (Strong Support - Long-Term Bias):
Entry: 3266 - 3264
SL: 3270
TP: 3280 - 3284 - 3290 - 3295 - 3300 - 3305 - 3310 - 3320
BUY SCALP (Quick Buy at Intermediate Support):
Entry: 3284 - 3282
SL: 3278
TP: 3288 - 3292 - 3296 - 3300 - 3305 - 3310 - 3320 - 3330
SELL ZONE (Key Resistance):
Entry: 3331 - 3333
SL: 3337
TP: 3326 - 3320 - 3316 - 3310 - 3305 - 3300
SELL SCALP (Quick Sell at Near Resistance):
Entry: 3313 - 3315
SL: 3320
TP: 3310 - 3305 - 3300 - 3295 - 3290 - 3280
⚠️ Key Factors to Monitor Closely:
US Macro Data: The upcoming US Personal Consumption Expenditures (PCE) Price Index on Friday is critical.
FOMC Member Speeches: Any comments on monetary policy or inflation outlook will directly impact USD and Gold.
Geopolitical Stability: Developments regarding the Israel-Iran ceasefire can influence safe-haven demand.

Ready for a Fresh Rally Ahead of July FOMC Buzz?XAUUSD: Powell's "Soft Tone" Ignites Gold – Ready for a Fresh Rally Ahead of July FOMC Buzz?
🌍 Macro Landscape: Gold Reacts to Fed's Cues – Easing Rate Pressures?
The gold market (XAUUSD) is witnessing a resurgence of positive momentum, driven by recent "dovish-leaning" signals from Federal Reserve Chair Jerome Powell during his congressional testimony. Powell's acknowledgment of lower-than-expected inflation from tariffs, coupled with hints of a potential earlier interest rate cut (possibly as early as July), is creating a fresh wave of market anticipation.
While Powell cautiously noted "no need to rush," market participants are interpreting his remarks as an indication that current monetary policy might be "somewhat restrictive." Should inflation continue its sustainable deceleration, the Fed would be poised to ease policy sooner. This directly impacts gold: as rate cut expectations rise, the opportunity cost of holding gold (a non-yielding asset) diminishes, making it significantly more appealing to investors.
🏦 Central Bank Policy: Fed's Evolving Stance & Market Re-calibration
Federal Reserve (Fed): Chair Powell's nuanced message suggests a more adaptable Fed, ready to align its policy with actual inflation data. His emphasis on the Fed's independence from political influence further solidifies confidence in data-driven decisions.
Market Re-calibration: While the broader market still leans towards a September rate cut, the probability of a July cut is subtly increasing, according to the CME FedWatch Tool (with 70.1% anticipating a cut to 4.00 - 4.25% by September). This re-pricing of policy risk is a crucial supportive factor, helping gold maintain stability around the $3,300–$3,320/oz mark, indicating smart money accumulation.
This evolving Fed perspective, even a slight shift, is powerful enough to influence capital flows and investor sentiment globally, setting the stage for significant gold movements.
🌐 Capital Flows: Gold & USD – The Shifting Safe-Haven Dynamics
Global capital flows are highly sensitive to interest rate expectations and perceived risks. Historically, both gold and the U.S. dollar serve as primary safe havens during periods of uncertainty.
If Powell's "dovish tilt" gains further traction and leads to earlier rate cuts, we could anticipate a notable rotation in capital:
Outflows from USD: Lower U.S. yields would diminish the attractiveness of the USD as a yielding asset.
Inflows into Gold: The reduced opportunity cost of holding gold, combined with its intrinsic store-of-value appeal, could trigger substantial capital flows into the precious metal, especially amidst persistent global geopolitical tensions.
The market's re-evaluation of Fed policy risk is already contributing to gold's resilience, suggesting that strategic positioning for an upside move might be underway.
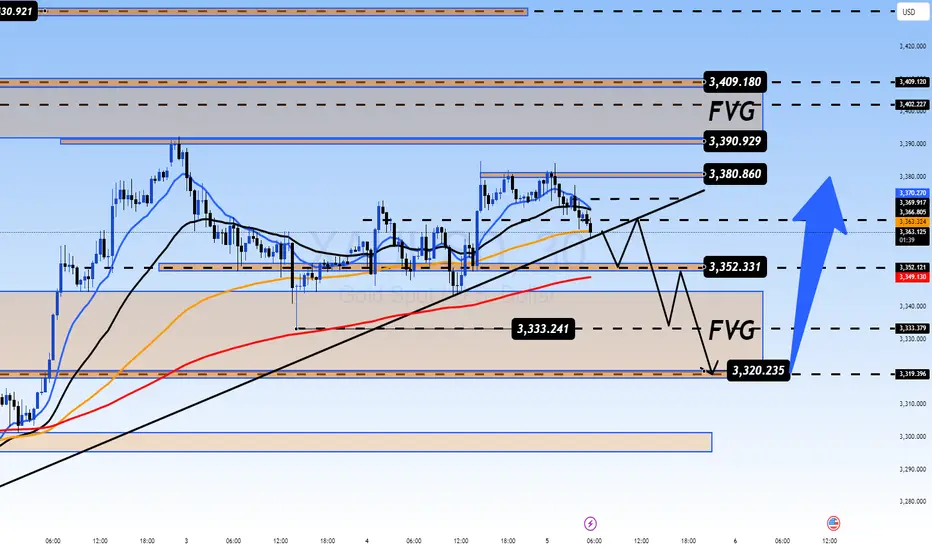
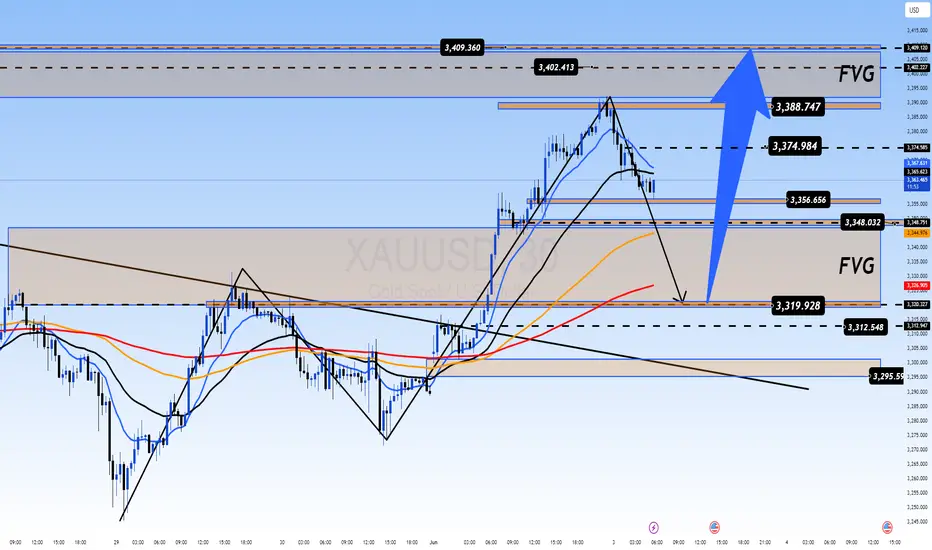
📊 Technical Structure (H4/M30 Chart Analysis): Gold Breaking Bearish Bias, Targeting Higher Levels
Based on the provided XAUUSD chart (H4/M30 timeframe):
Channel Breakout: Gold has visibly broken out of a prior descending channel, signaling a clear weakening of selling pressure and a potential trend reversal. The price is currently consolidating and appears to be forming a new accumulation pattern or a smaller ascending channel.
Key Price Levels:
Potential Sell Zone (Resistance): Around 3,352.383 - 3,371.205. This zone aligns with significant Fibonacci retracement levels (0.5 and 0.618 from the last major swing down) and represents a strong historical resistance cluster. If the price attempts to breach this zone and fails, selling pressure could emerge.
Higher Resistance: 3,391.750 - 3,395.000. This is a formidable resistance area. A decisive break above this level would confirm a more robust long-term bullish trend.
Current Buy Zone (Support): Around 3,302.939 - 3,311.214. This is a critical demand zone, where strong buying interest is likely to surface, coinciding with recent swing lows.
Next Key Support: 3,286.257. Should the 3,302.939 - 3,311.214 zone be breached, this level would be the next significant support to watch.
Moving Averages (EMA 13-34-89-200):
The price is currently trading above the shorter-term EMAs (13 & 34), indicating positive short-term momentum.
The longer-term EMAs (89 & 200) are likely transitioning from resistance to dynamic support, or showing signs of convergence, suggesting a potential shift in market structure. A 'Golden Cross' formation among these EMAs would be a powerful bullish signal.
Projected Price Action: The chart depicts a scenario where the price might retrace slightly towards the 3,317.738 support or even deeper to 3,302.939 before embarking on a strong upward rally, targeting resistance zones like 3,352.383 and further to 3,371.205.
🎯 Trade Strategy Recommendations (Based on Provided Zones):
BUY ZONE: 3286 - 3284
SL: 3280
TP: 3290 - 3294 - 3298 - 3302 - 3306 - 3310 - 3315 - 3320
BUY SCALP: 3302 - 3300
SL: 3295
TP: 3306 - 3310 - 3314 - 3318 - 3322 - 3326 - 3330
SELL ZONE: 3353 - 3355
SL: 3360
TP: 3350 - 3346 - 3340 - 3335 - 3330 - 3320
SELL ZONE: 3372 - 3374
SL: 3378
TP: 3370 - 3366 - 3362 - 3358 - 3354 - 3350
⚠️ Key Events to Watch:
Further Speeches by Fed Officials: Any new comments on inflation, economic data, or the rate path will heavily influence market dynamics.
Global Geopolitical Developments: Ongoing tensions or new uncertainties can always bolster gold's safe-haven appeal.
XAUUSD 23/06 – Bears Losing Steam as FVG Zone Returns to PlayXAUUSD – Gold Sets Up for a Strategic Bounce Amid Fed Dovish Shift and Yield Retreat
📊 MACRO & FUNDAMENTAL INSIGHTS – WEEK AHEAD
Gold enters the final week of June with renewed investor focus amid softening Fed rhetoric and weakening US Treasury yields. Here's what Indian traders need to watch:
🔻 Fed Signals & Rate Cut Bets Rising
Jerome Powell’s upcoming speech and comments from FOMC members will shape the tone. Market now prices in a 65% probability of a rate cut in September, according to CME FedWatch.
If Powell leans dovish, expect renewed demand for non-yielding assets like gold. Conversely, hawkish surprises may pressure prices downward.
📉 US Dollar and Bond Yields Losing Momentum
The US Dollar Index (DXY) is retreating after peaking, while 10-year yields hover near 4.23% but fail to break higher.
Weakening yields and profit-taking on the dollar strengthen the safe-haven narrative for gold, particularly attractive to Indian investors during times of global volatility.
🌍 Geopolitical Tensions & Capital Flow Rotation
Ongoing concerns in the Middle East, Ukraine, and Indo-Pacific increase gold’s appeal as a hedge.
Institutions have started rotating capital from equities to safe-haven assets. ETF inflows and central bank reserves—particularly from China and India—underline long-term accumulation.
🧠 TECHNICAL ANALYSIS – STRUCTURE & SENTIMENT
On the H1 chart, XAUUSD remains within a broader descending channel but has printed a potential reversal setup from the BUY ZONE (3327–3325).
The recent drop filled a Fair Value Gap (FVG), offering strong confluence support.
Price action shows early signs of accumulation with bullish divergence on RSI and price holding above the trendline support.
Immediate resistance is seen at 3355–3360, with stronger supply anticipated near the SELL ZONE (3398–3400), aligning with a high-timeframe trendline.
🎯 TRADING PLAN – UPDATED FOR SHORT/MEDIUM TERM
🔵 BUY ZONE: 3327 – 3325
SL: 3320
TP: 3330 → 3335 → 3340 → 3345 → 3350 → 3355 → 3360 → ???
This zone aligns with key structural support and the base of FVG. A break above 3360 may trigger acceleration toward 3375–3390.
🔴 SELL ZONE: 3398 – 3400
SL: 3405
TP: 3395 → 3390 → 3386 → 3380 → 3375 → 3370 → 3360
Ideal area to fade potential spikes driven by news or sentiment. Look for rejection wicks or RSI divergence before entering.
⚖️ STRATEGY OUTLOOK
With central banks tilting toward easing, gold may reclaim dominance as a macro hedge. India’s gold imports are expected to increase if prices consolidate below 3350. Patience and discipline around key zones are critical—let price validate direction.

XAUUSD – Will Gold Break Free from the Downtrend?XAUUSD – Goldman Sachs Issues a Storm Warning: Will Gold Break Free from the Downtrend?
As gold continues to trade in a narrow range for the sixth week, one major catalyst could be on the horizon — Goldman Sachs has issued a bold warning about the US debt crisis. Indian traders, this may be the signal we’ve been waiting for…
🌐 MACRO OUTLOOK – US DEBT SET TO BREAK WWII RECORDS
US public debt is approaching historic highs, with interest payments projected to exceed $1 trillion in 2025 — surpassing even defense and healthcare spending.
Goldman warns that if urgent action isn’t taken, the US may face aggressive fiscal tightening, which could shrink GDP without lowering the debt-to-GDP ratio.
Root causes: overspending, rising interest rates, and deep political division.
📌 For Indian investors, such instability in the US economy tends to weaken the USD and increase demand for gold, which has always been a trusted asset in Indian households and institutional portfolios alike.
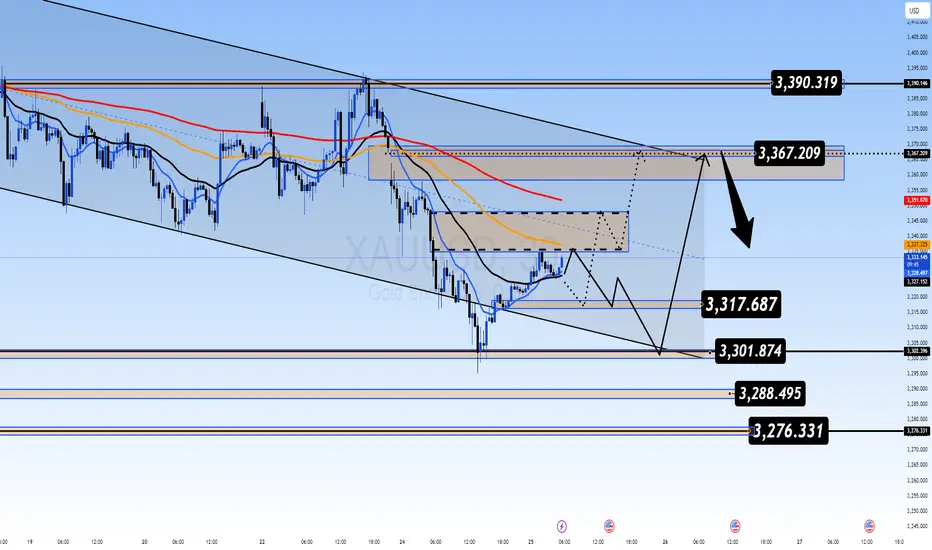
📉 TECHNICAL OUTLOOK (Updated – M30/H1)
Gold remains within a strong descending channel, and price action is currently showing signs of a bearish continuation setup.
The zone at 3,338.422 is acting as a mid-pivot. A pullback to the upper trendline (around 3,368.048) is expected before the next leg lower.
EMA ribbons are stacked downward, confirming short-term bearish momentum.
If the bounce toward 3,368 fails to break out, we expect price to revisit the FVG zone near 3,325.783, and possibly extend toward 3,309.256.
✅ TRADING PLAN (Unchanged Zones)
🟢 BUY ZONE: 3310 – 3308
SL: 3303
TP: 3314 → 3318 → 3322 → 3326 → 3330 → 3340 → 3350 → 3360 → ???
🟢 BUY SCALP: 3325 – 3323
SL: 3318
TP: 3330 → 3334 → 3338 → 3342 → 3346 → 3350 → 3360 → 3370 → ???
🔴 SELL ZONE: 3418 – 3420
SL: 3424
TP: 3414 → 3410 → 3405 → 3400 → 3396 → 3390 → 3385 → 3380
🔻 SELL SCALP: 3396 – 3398
SL: 3403
TP: 3392 → 3388 → 3384 → 3380 → 3375 → 3370
💬 FINAL THOUGHTS FOR INDIAN TRADERS
As we close the trading week, market liquidity may spike suddenly after Thursday’s US bank holiday. This could trigger a decisive move — either a breakout or a trap.
✅ Stick to your SL/TP, avoid emotional trading, and let the market confirm the direction.
Gold remains structurally bearish, but any shift in global sentiment — especially driven by US debt concerns — could flip the script fast.
Watch. Plan. Execute. Let the market come to you.

GOLD GEARS UP FOR THE NEXT MOVE? All Eyes on Middle East & FedXAUUSD – GOLD GEARS UP FOR THE NEXT MOVE? All Eyes on Middle East & Fed
🌐 MACRO VIEW – WHAT'S MOVING GOLD?
🔺 Fed stays on hold, but Powell remains hawkish – His recent speech signals that inflation may persist due to ongoing geopolitical risks and rising commodity costs...
🔥 Middle East tensions could be the game-changer for gold prices:
If the US steps in as a mediator to de-escalate tensions between Israel and Iran, gold could see a deeper correction toward the 3,357–3,345 support zone, possibly lower...
On the other hand, Trump’s reported alignment with Israel and possible airstrikes on Iran would likely send gold soaring back to 3,417–3,440 levels, acting as a safe haven trigger.
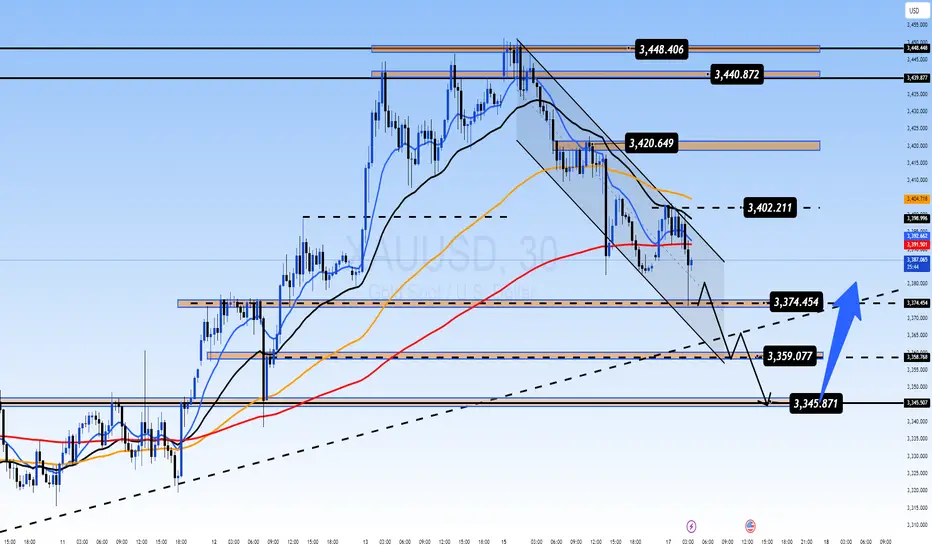
📉 TECHNICAL SETUP (M30)
Gold is moving inside a descending channel, compressing within key EMAs (13–34–89–200).
A potential inverse head & shoulders pattern is forming at the bottom, signaling possible bullish breakout if confirmed.
Support remains firm around 3,345–3,357, while price struggles to break above the upper trendline.
✅ TRADING PLAN
🔵 BUY ZONE: 3,345 – 3,357
Entry: Look for bullish rejection and confirmation
SL: Below 3,342
TP: 3,373 → 3,384 → 3,403 → 3,417 → 3,440
🔴 SELL ZONE: 3,417 – 3,440
Entry: Wait for rejection and bearish confirmation near resistance
SL: Above 3,445
TP: 3,403 → 3,384 → 3,373 → 3,357
💬 FINAL THOUGHTS FOR INDIAN TRADERS
Even though the broader trend remains bullish, gold is not yet ready for a breakout – consolidation continues. Smart traders should stay patient, watch for clean setups, and manage risk well. Keep an eye on political developments, especially involving Iran, Israel, and the US, as they could trigger sharp moves in gold.
Trade smart. Let the market come to you.

Gold Consolidates Ahead of Fed: Buy Signal or Bull Trap?🟡 XAUUSD 18/06 – Gold Consolidates Ahead of Fed: Buy Signal or Bull Trap?
🌐 MACRO & SENTIMENT OVERVIEW
The US Dollar Index (DXY) gained 0.7% to start the week, as markets anticipate the Fed may keep rates higher for longer due to rising oil prices and global geopolitical uncertainty.
However, with the upcoming FOMC meeting and US retail sales data, there is a strong potential for a shift in tone if growth shows signs of weakness.
Geopolitical tensions – particularly in the Middle East (Israel–Iran conflict) – continue to support gold’s defensive appeal, even as short-term profit-taking creates volatility.
📊 TECHNICAL OUTLOOK – M30 Chart
Gold is currently trading inside a descending channel, but price structure remains above EMA 13–34–89, keeping the potential for a bullish reversal alive.
Liquidity has been absorbed multiple times near 3,345, aligning with dynamic support from trendline and horizontal structure → a key decision zone for bulls.
On the upside, resistance between 3,440 – 3,445 remains a critical distribution zone, likely to trigger sell reactions if price fails to break convincingly.
🎯 TRADE SETUPS
🔵 BUY ZONE: 3345 – 3343
SL: 3339
TP: 3350 – 3354 – 3358 – 3362 – 3366 – 3370 – 3380 – 3400 – ???
📌 This zone overlaps with trendline and recent demand areas. Watch for bullish price action confirmation (e.g., engulfing, pin bar) before entering. If confirmed, we expect a strong bounce targeting the upper channel and beyond.
🔴 SELL ZONE: 3442 – 3444
SL: 3448
TP: 3438 – 3434 – 3430 – 3425 – 3420 – 3410 – 3400
📌 This is a strong supply area that has rejected price multiple times. Look for reversal signals like bearish divergence or rejection wicks to consider short entries.
✅ SUMMARY
Gold is caught in a critical reaccumulation zone ahead of the FOMC statement. Patience is key: allow the market to react at liquidity zones and follow price behavior instead of chasing moves.
Stick to your zones – protect your capital – and let the setups come to you.

Gold Consolidating at Key Support: Is the Next Move a Reversal?XAUUSD 17 June – Gold Consolidating at Key Support: Is the Next Move a Reversal?
After a strong rally to 3,448 – the highest level in 8 weeks – gold faced profit booking and pulled back sharply towards 3,385. However, price is now sitting at a critical confluence of technical zones, and smart money may be preparing for the next strategic leg. Let’s decode the structure...
🌐 Macro & Market Sentiment
Geopolitical heat remains: Israel–Iran tension is far from cooling. Trump's statements about evacuating Tehran and pushing for a new nuclear deal are fueling safe-haven demand.
Fed policy meeting + US Retail Sales ahead: These upcoming events will shape inflation expectations and rate path clarity. Traders are cautious but alert.
Capital rotation: Large funds may be temporarily exiting gold and shifting into oil and stocks—triggering short-term volatility, not trend reversals.
📊 Technical Breakdown (M30-H1 Confluence)
Trend channel: Gold is currently trading within a descending short-term channel after failing to hold above the 3,440–3,448 supply zone.
EMA alignment (13-34-89-200): Squeezing closer, indicating momentum exhaustion and possible bullish crossover if support holds.
Fair Value Gap (FVG) + historical support + ascending trendline align near 3,345 → strong liquidity pocket forming here.
🎯 Trade Setups for Today
✅ BUY Setup (Liquidity Rebound)
BUY ZONE: 3,344 – 3,342
SL: 3,338
Targets:
→ 3,348 → 3,352 → 3,356 → 3,360
→ 3,364 → 3,368 → 3,372 → 3,380+
🧠 Ideal entry if price forms bullish rejection candle in this zone, especially during London open. Look for long-tail or inside bar confirmation.
⚠️ SELL Setup (Scalp-Only if Rejected)
SELL ZONE: 3,440 – 3,442
SL: 3,446
Targets:
→ 3,436 → 3,432 → 3,428 → 3,424
→ 3,420 → 3,415 → 3,410
📌 Only short if there's strong rejection from this supply zone. No blind entry—wait for clear bearish momentum or reversal wick with high volume.
🧭 Market Psychology
Retail traders were trapped on the breakout—smart money likely unloading at highs.
Price is now retracing to gather liquidity. If the 3,344 zone holds, we could see a powerful impulsive recovery.
Don’t trade the noise — trade the zones. Volume behavior around these levels will reveal market intention.
📌 Final Thoughts
This is a classic case of controlled retracement after a breakout. If gold finds support at the BUY ZONE, the next bullish wave could target 3,400+ again. But if the 3,345 area fails, deeper correction toward 3,320 is possible.
🧘♂️ Stay patient. Let price come to you.
✅ Follow structure, respect SL, and trade with clarity.
Gold Drops After Asian FOMO: Bull Trap or Liquidity Grab?🟡 XAUUSD 16/06 – Gold Drops After Asian FOMO: Bull Trap or Liquidity Grab?
After a strong bullish rally in the Asian session driven by fear-based headlines and war news, gold (XAUUSD) suddenly reversed sharply — confusing many retail traders who jumped in late. But when we look deeper into price behavior and volume, the story becomes clearer...
📌 Key Fundamental Insights
🔸 Geopolitical headlines (war tensions, assassination attempts) triggered a FOMO rally in gold early in Asia.
🔸 However, the lack of follow-through volume suggests this may have been a bull trap—a smart money strategy to unload positions into emotional buying.
🔸 Big funds could be reallocating capital temporarily from gold into:
🔹 Stocks (tech & value sectors are correcting attractively)
🔹 Oil (Middle East tension = higher oil price = strong institutional interest)
🔍 Technical Outlook (M30 Chart)
The technical structure shows a textbook liquidity play:
🔻 Price spiked into resistance at 3456, then reversed
🧊 EMAs (13/34/89/200) are flattening → signs of potential bearish crossover on M15–M30
📉 Volume has been declining → confirms exhaustion of the FOMO move
📦 A large Fair Value Gap (FVG) sits below current price, acting as a magnet for liquidity
🎯 Strategy Setup
Scenario 1: BUY from FVG (Liquidity Reclaim)
Entry: 3383 – 3385
SL: 3377
TPs: 3386 → 3390 → 3394 → 3398 → 3402 → 3406 → 3410+
Structure favors a bounce from this zone if confirmed by price action during London or NY sessions.
Scenario 2: SELL if price re-tests 3456–3458
Entry: Only on clear rejection
SL: 3462
TPs: 3452 → 3448 → 3444 → 3440 → 3435 → 3430
⚠️ Avoid shorting blindly — only trade confirmed rejections with strong candle setups.
Market Psychology Right Now
Big players may be unloading gold to rotate into oil and equities
Asian FOMO = retail got trapped
Volume profile shows imbalance: market likely seeking liquidity lower before moving higher again
📝 Final Thoughts
Gold is in a volatile reaccumulation zone. Rather than chasing price, it’s better to let the market come to your planned zones. The 3383–3385 zone will be critical. If it holds, we may see a solid bounce into next week.
Discipline beats emotion. Respect your SL and stick to the zone logic.
📌 Follow for intraday updates. Will post re-entry plan during London session if price reacts early.

BTC Near $100K – Breakdown or Bounce?BTC Near $100K – Breakdown or Bounce?
BTCUSD – Will Bitcoin Hold ₹100K Support Equivalent? Signs of Weakness Amid Global Caution
🧭 Global Market Context
Bitcoin is facing some serious resistance after failing to hold above the $108K zone. And just as Indian markets react to global cues, BTC is showing signs of stress too.
🔺 US bond yields are climbing again – bad news for crypto risk appetite
🧊 Spot Bitcoin ETFs continue to attract inflows, but not strong enough to push new highs
💵 The US Dollar (DXY) is gaining strength again as investors flee risk — and that puts pressure on Bitcoin
Add to that the recent institutional sell-off, and it’s clear: BTC may need to “cool off” before another rally.
📉 Technical Picture (1H)
Bitcoin is showing a classic lower-high, lower-low pattern. A clear downtrend is in motion:
Price is below all key EMAs (34/89/200), with every rally being sold off
Important resistance sits at 106,000 – 107,000
Major support levels are now at 102,821, then 101,539, and if pressure continues — 100,419 (₹83+ lakh level for reference)
Momentum indicators like RSI are flat. No strength yet. And without a solid bullish candle from support, buyers may stay away.
🔎 Strategy Plan for Indian Traders
🔻 Short-term SELL Setup
Entry: 106,000 – 107,000
SL: 107,500
Targets: 102,821 → 101,539 → 100,419
🧠 Ideal for short-term traders looking to follow the trend
🔹 Medium-term BUY Setup (only if price reacts from 100K zone)
Entry: 100,500 – 100,800
SL: 99,800
Targets: 102,800 → 104,400 → 106,000
⚠️ Wait for bullish confirmation — avoid bottom fishing blindly
📌 Final Thought
Bitcoin is in a danger zone right now. If it loses grip on $100K support, we may see panic selling from leveraged traders. But this zone also holds opportunity — a strong bounce could spark a fresh rally.
🧘 Trade with patience. Don't chase. Let the market come to you.

Gold Surges Amid Middle East TensionsXAUUSD – Gold Surges Amid Middle East Tensions | What’s Next After 3430 Break?
🌍 Macro & Geopolitical Overview
Gold prices accelerated sharply in the Asian session on June 13 after Israel launched a large-scale airstrike campaign against Iran, targeting nuclear facilities including the Natanz uranium enrichment site.
Israeli Prime Minister Netanyahu declared the mission would continue until the Iranian nuclear threat is “completely neutralized.”
Iran suffered major losses and scrambled its air force to prepare for retaliation.
WTI oil jumped over 8%, gold spiked to $3,430/oz, and US equities dropped sharply.
While the US claimed it would not participate directly in the attack, it vowed to defend its forces in the region if threatened.
This rapidly escalating geopolitical conflict has triggered a renewed flight into safe-haven assets, with gold leading the pack.
📉 Technical Outlook – M30 / H1 Chart
🔹 Trend Structure
Gold has broken out decisively above 3,392, forming a strong bullish leg and carving new short-term support around 3,412 – 3,426.
Price action is forming a Higher High – Higher Low structure within a rising channel.
🔹 Fair Value Gap (FVG)
A visible FVG between 3,405 – 3,412 has formed. As long as price holds above this zone, bullish continuation is favored.
🔹 EMA Structure
Price is well above all key EMAs (13, 34, 89, 200), confirming a strong bullish environment. EMA13 continues to guide intraday momentum.
🔹 Key Resistance Zone
Watch for potential distribution or profit-taking around 3,441 – 3,456 – a major resistance area if no further escalation occurs.
🧠 Market Sentiment & Behavior
Investor sentiment has shifted firmly into risk-off mode.
Funds are flowing heavily into gold, oil, CHF, and JPY.
Price volatility is likely to spike further, as headlines continue to drive intraday sentiment.
🎯 Updated Trade Setup – 13 June
🔵 BUY ZONE: 3384 – 3382
Stop-Loss: 3378
Take-Profit: 3388 → 3392 → 3396 → 3400 → 3405 → 3410
🔴 SELL ZONE: 3454 – 3456
Stop-Loss: 3460
Take-Profit: 3450 → 3446 → 3442 → 3438 → 3434 → 3430
✅ Conclusion
The renewed conflict between Israel and Iran is fueling gold’s rise as global risk appetite collapses. Technically, the trend remains bullish, but volatility is extremely elevated. Traders should watch key price zones closely and avoid emotional trades during event-driven spikes.
⚠️ Trade the reaction, not the prediction. Let key levels confirm bias before entering.

XAUUSD – CPI Data Pushes Gold HigherXAUUSD – CPI Data Pushes Gold Higher | Should You Follow the Trend or Sell the Top?
Gold prices surged strongly after the US CPI report came in lower than expected. This triggered a sharp drop in the US Dollar and yields, while boosting demand for safe-haven assets. The question now: Is this the beginning of a new leg higher, or a setup for a short-term correction?
🌐 MACRO & MARKET SENTIMENT
📰 US CPI (May): Increased only 0.1% MoM and 2.4% YoY vs. forecast of 2.5%.
➤ This softer inflation reading reignited expectations that the Fed may cut rates as early as September.
📉 USD Weakness: The Dollar Index (DXY) dropped ~0.4%, making gold cheaper and more attractive for global investors.
📉 Bond Yields Falling: US 10Y yields declined, further increasing the appeal of gold as a non-yielding safe asset.
💡 Market Psychology: Traders are rotating capital back into gold ahead of FOMC and geopolitical uncertainties (China, Middle East).
📈 TECHNICAL OUTLOOK – H1 & H4 STRUCTURE
🔹 Trend Structure
Gold remains in a Higher High – Higher Low formation since the 3,312 level. Price recently broke above the 3,360–3,374 resistance and is now consolidating around 3,375 — a possible accumulation before breakout.
🔹 Price Channel
Gold is respecting an ascending channel with the lower bound aligning with the key support area at 3,339 – 3,345. As long as this zone holds, bulls are in control.
🔹 EMA Indicators
EMA13 / EMA34: Price is comfortably above both — indicating strong short-term momentum.
EMA89 / EMA200: Both EMAs are well below price action, confirming a medium-term bullish trend.
🔹 Caution Zone
Resistance at 3,392 – 3,395 is a key area to watch for reversal patterns (Pin Bars, Bearish Engulfing, etc.)
If price pulls back to 3,339 – 3,345 and holds, it can offer high-probability long entries with trend continuation.
🎯 TRADE SETUPS
🔵 BUY ZONE: 3324 – 3322
Stop-Loss: 3318
Take-Profit Targets: 3330, 3334, 3338, 3342, 3346, 3350
🔵 BUY SCALP: 3337 – 3335
Stop-Loss: 3330
Take-Profit Targets: 3341, 3345, 3350, 3354, 3360, 3370, 3380
🔴 SELL ZONE: 3392 – 3394
Stop-Loss: 3398
Take-Profit Targets: 3388, 3384, 3380, 3375, 3370, 3360, 3350
🧠 CONCLUSION
The lower-than-expected CPI has given gold a short-term macro boost, and technically, bulls remain in control. However, caution is needed near the 3,392 zone — where price could face strong supply and trigger a pullback.
✅ Trade with confirmation, not assumptions. Let the price action guide your next move.

Gold Holds Breath for CPI – Decisive Catalyst or Price Trap?XAUUSD: Gold Holds Breath for CPI – Decisive Catalyst or Price Trap?
🌍 Macro Landscape: Gold Awaits CPI, Real Interest Rate Pressure
The Gold market (XAUUSD) is in a highly sensitive phase as investors hold their breath for the upcoming U.S. Consumer Price Index (CPI) report during the U.S. session. CPI is the most crucial inflation gauge, and any deviation from expectations can trigger significant market shocks, especially for safe-haven assets like gold.
In this context, real interest rates are playing a pivotal role. If inflation cools faster than anticipated (lower CPI), pressure on the Federal Reserve (Fed) to cut interest rates will increase, leading to a drop in bond yields and making gold more attractive. Conversely, if inflation remains "sticky" (higher CPI), the Fed may maintain a "higher-for-longer" policy stance, pushing bond yields up and putting downward pressure on gold due to the increased opportunity cost of holding the non-yielding asset.
🏦 Central Bank Policy Divergence: Fed's Caution, BoJ's Waiting Game
Federal Reserve (Fed): FOMC members continue to signal patience with rate cuts. Recent inflation data shows persistent price pressures, particularly in the services sector, reinforcing the Fed's hawkish bias. This creates pressure on gold if the USD continues to strengthen due to higher interest rates.
Bank of Japan (BoJ): (While not directly related to XAUUSD, global policy divergence still impacts capital flows and sentiment. For Gold, our focus is primarily on the Fed and other major central banks.)
The divergence in global monetary policies, especially between the Fed and other major central banks, is creating a volatile environment for the gold market.
🌐 Capital Flows: Gold & USD – The Safe-Haven Race Amid Instability
Global capital flow models suggest that the USD and Gold are currently the two most sought-after safe-haven assets amidst geopolitical tensions (such as US-China tensions) and EU fiscal risks.
If the upcoming CPI data surprises the market, it could trigger significant capital flows between the USD (a yielding asset) and gold (a non-yielding asset). A lower-than-expected CPI could boost inflows into gold, while a higher CPI could reinforce USD strength and push gold prices lower.
📊 Technical Structure (M30 Chart): Gold in Decision Zone
On the M30 chart for XAUUSD:
Primary Trend: Gold prices are currently in a consolidation or slight correction phase, accumulating before the CPI news. The EMA 13 - 34 - 89 - 200 indicators present a mixed picture, with the price oscillating around the short-term MAs, while the longer-term MA (EMA 200) still acts as dynamic support/resistance. A "fan-out formation" or MA crossovers will be crucial signals confirming the next trend direction.
Crucial Resistance Zone (SELL Zone): Around 3374 - 3376. This is a strong resistance area where the price has reacted or has the potential to reverse. If the price rallies and approaches this zone before or after the CPI news without breaking through, it presents a potential selling opportunity.
Crucial Support Zone (BUY ZONE): Around 3314 - 3312. This is a strong support area where the price may find significant buying pressure to bounce. If the price corrects to this zone and shows bullish reversal signals (e.g., hammer candle, bullish engulfing), it presents a potential buying opportunity.
🎯 Trade Strategy Recommendations
Scenario 1 – BUY (Await reaction at support):
Entry: 3314 - 3312 (Wait for bullish reversal candle confirmation or strong buying pressure in this zone).
Stop-Loss: 3308 (Just below the support zone for capital protection).
Take-Profit:
TP1: 3318
TP2: 3322
TP3: 3326
TP4: 3330
TP5: 3335
TP6: 3340
Scenario 2 – SELL (Await reaction at resistance):
Entry: 3374 - 3376 (Wait for bearish reversal candle confirmation or strong selling pressure in this zone).
Stop-Loss: 3380 (Just above the resistance zone for capital protection).
Take-Profit:
TP1: 3370
TP2: 3366
TP3: 3362
TP4: 3358
TP5: 3352
TP6: 3348
TP7: 3340
⚠️ Key Events to Watch:
U.S. CPI Report (U.S. session): This is the most critical event, which will dictate gold's primary direction in the short term. Be prepared for strong volatility upon its release.
Any statements from Fed members: Comments on inflation or monetary policy can impact market sentiment.

GOLD IN SIDEWAY PHASE, WAITING FOR A BREAKOUT THROUGH KEY LEVELSXAU/USD TRADING PLAN 10/06/2025 – GOLD IN SIDEWAY PHASE, WAITING FOR A BREAKOUT THROUGH KEY LEVELS!
🌍 MACRO CONTEXT – FUNDAMENTAL ANALYSIS
Geopolitical tensions and monetary policy: The market is currently in a wait-and-see phase, with major decisions pending from important meetings, especially statements from the Federal Reserve (Fed) and global conflict situations. These factors could have a significant impact on market sentiment and volatility in gold.
Weak economic data from major economies such as the U.S. and the Eurozone indicates challenging economic conditions, leading investors to view gold as a safe-haven asset.
Interest rates: Although the Fed continues its rate hike policy, financial market uncertainties could continue to support gold as a preferred asset class.
📉 TECHNICAL ANALYSIS
On the M30–H1 timeframe, XAU/USD is currently moving within a rising channel. After the correction in Wave 4, gold has bounced back in the 335x region and is now preparing to confirm the next trend. Signals from EMA indicate accumulation, potentially setting up for a strong rally ahead.
Key resistance levels: 3,338 – 3,345 (unexplored FVG region). If gold breaks above 3,345, a continued rise to 3,353 is highly likely.
Key support levels: 3,282 – 3,275. If gold retests these levels without breaking them, the chances of a rebound are strong.
🎯 TRADE SETUPS FOR TODAY
🔵 BUY ZONE:
Entry: 3,302 - 3,304
SL: 3,296
TP: 3,306 → 3,310 → 3,314 → 3,318 → 3,325
🔴 SELL ZONE:
Entry: 3352 - 3354
SL: 3,358
TP: 3,348 → 3,344 → 3,340 → 3,330 → 3,320
⚠️ NOTE:
Risk management: Expect significant volatility as the market awaits important news this week.
Wait for confirmation: Technical signals are for guidance; clear confirmation from the charts is needed before entering trades.
📌 CONCLUSION:
Gold is currently in a sideway phase and may be preparing for a breakout if these key support and resistance levels are breached.
Traders should monitor both macroeconomic factors and strategic price zones to make informed trading decisions.

Waiting for the Breakout: Consolidation or Trend Continuation?XAUUSD – Waiting for the Breakout: Consolidation or Trend Continuation?
Gold (XAUUSD) is trading within a narrowing range, building momentum after rebounding from the 3.276 support area. Despite short-term uncertainties, the overall macroeconomic landscape continues to favor bullish scenarios — though key resistance levels must be cleared to confirm continuation.
🌍 MACRO & MARKET SENTIMENT
USD Weakness: The DXY continues to trade under pressure, increasing the appeal of non-yielding assets like gold.
US–China Trade Talks: Ongoing high-level negotiations in London could either ease geopolitical tensions or fuel safe-haven demand, depending on outcomes.
Global Risk Appetite: With US debt ceiling concerns still looming and the Fed showing hesitancy to cut rates soon, gold remains in focus as a hedge.
📈 TECHNICAL OUTLOOK (30M–H1)
The price has formed a descending wedge structure and is hovering near key EMAs (13–34–89–200).
A breakout above 3,334 could trigger a short-term bullish wave, while failure at this zone would likely lead to deeper correction toward 3,276 or lower.
📍 STRATEGIC KEY LEVELS
Resistance: 3,334 – 3,336 – 3,362 – 3,390
Support: 3,300 – 3,276 – 3,250
🧭 TRADING SCENARIOS
🔵 BUY ZONE: 3,276 – 3,274
SL: 3,270
TP: 3,280 → 3,284 → 3,288 → 3,292 → 3,296 → 3,300
🔻 SELL SCALP: 3,334 – 3,336
SL: 3,340
TP: 3,330 → 3,326 → 3,322 → 3,318 → 3,314 → 3,310
🔻 SELL ZONE: 3,362 – 3,364
SL: 3,368
TP: 3,358 → 3,354 → 3,350 → 3,346 → 3,340 → 3,335 → 3,330 → 3,320
✅ SUMMARY
Gold remains in a critical range, and traders should focus on well-defined zones to capitalize on volatility. Use confirmation-based entries and respect risk parameters — especially as macro headlines and technical patterns align for a potential breakout.

NFP STORM BREWING: WILL GOLD BREAK HIGHER OR DIVE LOWER?XAUUSD – NFP STORM BREWING: WILL GOLD BREAK HIGHER OR DIVE LOWER?
Gold enters a highly sensitive phase ahead of tonight’s Non-Farm Payrolls (NFP) release – one of the most influential data points for global financial markets. With US-China trade tensions rekindling and sovereign debt concerns mounting in the US, the yellow metal could experience a major breakout or a sharp reversal during the New York session.
🌍 MACRO & FUNDAMENTAL OUTLOOK
US-China trade talks have resurfaced, with concerns around tariffs and strategic metals dominating headlines. China's recent stance signals it may take stronger defensive actions.
The US national debt is projected to hit $55 trillion by 2034, prompting global central banks to ramp up gold purchases as a strategic hedge.
Fed Chair Powell reiterated a “no rush to cut” stance, yet political pressure is mounting – especially with Donald Trump urging immediate rate cuts following the weakest ADP job growth in two years.
Unemployment Claims released today came in slightly better than expected (236K vs. 240K), adding fuel to speculations around a softer NFP print – potentially bullish for gold.
🔍 TECHNICAL ANALYSIS (H1 – EMA 13/34/89/200)
The chart shows a clean impulsive wave structure. After hitting the resistance zone at 3408–3410, gold entered a consolidation range.
Price is currently hovering around EMA 89–200, suggesting trend divergence and uncertainty ahead of NFP.
A breakdown below the 3344–3332 support zone could push price down to the FVG (Fair Value Gap) at 3320, which may act as a strong liquidity pool for buyers.
⚠️ KEY LEVELS TO WATCH
Resistance: 3380 – 3392 – 3408 – 3436
Support: 3365 – 3350 – 3344 – 3332 – 3320
🧭 TRADE SETUPS
🔻 SELL ZONE: 3408 – 3410
Stop Loss: 3415
Take Profit: 3404 → 3400 → 3395 → 3390 → 3380 → 3370 → 3360 → 3350
🔵 BUY ZONE: 3318 – 3316
Stop Loss: 3310
Take Profit: 3322 → 3326 → 3330 → 3335 → 3340 → 3350 → 3360 → ???
✅ CONCLUSION
Gold is poised for a volatile breakout with NFP acting as the key catalyst. A soft jobs report may trigger a breakout above 3410, while stronger-than-expected numbers could fuel a bearish reversal. In this sensitive phase, traders should stick to defined zones and wait for confirmed liquidity reactions rather than chasing price impulsively.

Gold Awaits NFP Data: Will It Explode or Break Down from Range?XAUUSD – Gold Awaits NFP Data: Will It Explode or Break Down from Range?
Gold remains in a consolidation phase, coiling tightly ahead of the highly anticipated Non-Farm Payrolls (NFP) report. With traders on edge, the market is poised for a breakout – but in which direction?
🌍 MACRO & FUNDAMENTAL INSIGHT
Donald Trump reignited pressure on the Federal Reserve, calling for an immediate rate cut, especially after the recent ADP Employment Report showed the weakest job growth in over two years.
Fed Chair Jerome Powell, however, maintains a cautious stance, emphasizing that “no rush” to cut rates unless inflation convincingly trends lower.
Meanwhile, U.S. national debt is projected to hit $55 trillion by 2034, with unchecked fiscal expansion. This is fueling a global central bank gold-buying spree, with many purchases not even officially reported.
💡 This confluence of macroeconomic stress, monetary uncertainty, and geopolitical tension is pushing gold into the spotlight as a safe haven.
🔍 MARKET POSITIONING & SHORT-TERM DRIVERS
Unemployment Claims released today: 236K vs previous 240K – slightly positive, but not strong enough to offset weak labor momentum.
Treasury yields remain high (10Y at 4.55%), suggesting that while inflation fears persist, risk appetite is fragile.
The NFP release will likely serve as the catalyst for gold's next directional move, especially as liquidity builds up in a narrowing technical structure.
📈 TECHNICAL ANALYSIS (H1 – EMA 13/34/89/200)
Price is consolidating within a sideways range between 3333–3380, forming a classic liquidity trap just below key resistance.
The 3352–3333 zone is a critical structural support. A break below this level opens the door for a dip toward the FVG liquidity zone around 3320–3318.
On the upside, 3388–3400 remains a rejection zone. A clean breakout could target 3409 and even Fibonacci extension resistance at 3435–3445.
🔑 KEY TECHNICAL LEVELS
Resistance: 3388 – 3392 – 3400 – 3409
Support: 3355 – 3333 – 3320 – 3318
🧭 TRADING STRATEGY
🔵 BUY ZONE: 3320 – 3318
SL: 3314
TP: 3324 → 3328 → 3332 → 3336 → 3340 → 3350 → 3360 → ???
🔻 SELL ZONE: 3408 – 3410
SL: 3414
TP: 3404 → 3400 → 3396 → 3390 → 3386 → 3380 → 3370
✅ FINAL THOUGHTS
Gold is currently at the eye of the storm, with both fundamental and technical indicators aligned for volatility. The coming NFP release could tilt the balance sharply.
Stay disciplined: trade key zones only, wait for confirmation, and prioritize risk management. In markets like these, precision beats prediction.
Gold Stalls Ahead of Key Trade TalksGold Stalls Ahead of Key Trade Talks – Will Price Explode Out of the 3345–3370 Range?
After Monday’s explosive rally, gold is currently consolidating within a tight price range. The market is at a critical juncture, awaiting high-level trade talks between the U.S. and China — an event that could serve as a major catalyst for the next directional move.
🌍 MACRO OUTLOOK & MARKET SENTIMENT
A major trade call between Trump and President Xi Jinping is on the horizon. This conversation could reset global trade expectations and potentially trigger large moves in risk assets.
Last week’s strong U.S. jobs data (NFP) pushed back expectations of Fed rate cuts. Treasury yields remain elevated, which is temporarily capping gold’s upside.
Market sentiment is neutral-to-cautious, with traders waiting for confirmation of a breakout or breakdown before committing capital to new positions.
📈 TECHNICAL ANALYSIS (H1 – EMA 13/34/89/200)
Gold appears to be in a wave 4 correction, consolidating after completing wave 3.
EMAs remain aligned to the upside (bullish), suggesting the broader trend still favors buyers.
Key range:
Above 3370 → breakout confirmation → momentum push toward 3400–3410
Below 3345 → breakdown → fast dip to 3310–3300 to complete wave 4 and initiate wave 5 upward
🧭 STRATEGIC ZONES
🔵 BUY ZONE: 3317 – 3315
Stop Loss: 3310
Take Profits:
3322 → 3326 → 3330 → 3334 → 3338 → 3345 → 3350 → 3360
This zone aligns with a strong FVG + EMA89 support. A bullish reaction here could provide a high-probability entry for the next impulsive leg upward (wave 5).
🔻 SELL ZONE: 3372 – 3374
Stop Loss: 3378
Take Profits:
3368 → 3364 → 3360 → 3356 → 3350 → 3345
3370 is a critical resistance zone. Any rejection at this level with weak momentum or divergence could open a short-term bearish correction back toward 331x levels.
✅ SUMMARY
Gold is trapped in a decision zone between 3345–3370. The market awaits clarity from macro headlines and technical breakout signals. Until then, traders should watch key levels closely, stay patient, and position accordingly based on price action confirmation at strategic zones.

MARKET WAITS FOR TRUMP–XI TRADE CALL XAUUSD PLAN – JUNE 3XAUUSD PLAN – JUNE 3 | GOLD CORRECTS AFTER $100 SURGE | MARKET WAITS FOR TRUMP–XI TRADE CALL
After an explosive $100+ rally earlier this week, gold has entered a sharp correction phase, dropping $30 during the Asian session. This pullback comes as the market anticipates a high-level trade call between former President Trump and President Xi Jinping, which could reshape short-term expectations around US–China relations and global risk sentiment.
🌍 MACRO CONTEXT – POLITICS MEETS FINANCE:
The upcoming Trump–Xi call is expected to guide markets over the next few sessions and may impact trade risk positioning.
Investors have begun profit-taking following the aggressive rally, leading to temporary risk-off sentiment and cash-out flows.
From an Elliott Wave perspective, wave 3 (the strongest wave) may have completed, and price could now retrace into lower FVG zones to gather liquidity for the next upward move.
📈 TECHNICAL STRUCTURE (H1–H4 – EMA 13/34/89/200):
On higher timeframes (H4 and D1), gold maintains a strong bullish structure.
Price appears to have peaked near 3,402 – 3,409, and is now retracing toward the key FVG support zone between 3,320 – 3,310.
EMAs are beginning to compress after a strong expansion – suggesting the market may consolidate or correct further in the short term.
🧭 KEY PRICE LEVELS:
Support: 3,346 – 3,340 – 3,318 – 3,310 – 3,295
Resistance: 3,374 – 3,388 – 3,402 – 3,410
🔍 TRADE SETUPS:
🔵 BUY ZONE: 3,320 – 3,318
Stop Loss: 3,314
Take Profits:
3,324 – 3,328 – 3,332 – 3,336 – 3,340 – 3,344 – 3,350 – 3,360 – 3,374+
Buy on dips into the liquidity zone or after confirmation candles near EMA13–34 support. Ideal entry for positioning ahead of a potential wave 5 continuation.
🔻 SELL ZONE: 3,388 – 3,390
Stop Loss: 3,394
Take Profits:
3,384 – 3,380 – 3,376 – 3,370 – 3,366 – 3,360 – 3,350
Sell only if there is a strong rejection or bearish divergence near the recent highs – this zone marks the top of wave 3 and potential exhaustion.
📌 SUMMARY:
Gold’s macro structure remains bullish, but short-term corrections are expected. Price may dip into FVG zones to absorb liquidity before launching the next move. Avoid FOMO and follow technical zones with disciplined SL.
BULLISH GAP CONFIRMS BREAKOUT STRUCTUREXAUUSD PLAN – JUNE 2 | BULLISH GAP CONFIRMS BREAKOUT STRUCTURE | GOLD REGAINS SAFE-HAVEN DEMAND
The new trading week kicks off with a strong bullish gap in gold, signaling renewed investor confidence in safe-haven assets amid rising geopolitical tensions. With the US dollar showing early signs of weakness and no clear direction from the Fed, gold is quickly regaining strength as a defensive play.
🌍 MACRO CONTEXT:
US–China trade tensions and renewed Middle East geopolitical risks are pushing capital into gold as a risk hedge.
The US dollar is pulling back slightly, weighed by concerns over the upcoming labor data and persistent inflation.
Institutional portfolios are reportedly increasing exposure to gold as a hedge against macro instability.
➡️ In this context, gold has strong short-term upside potential, especially if price holds above the key breakout zone.
📈 TECHNICAL ANALYSIS (H1 – EMA 13/34/89/200):
Price has broken out above the descending trendline and EMA200, confirming bullish momentum.
All EMAs (13–34–89–200) are aligned upward, supporting continuation of the uptrend.
As long as gold holds above 3,309, bulls will likely target previous highs near 3,348 and 3,361.
🔍 TRADE PLAN – JUNE 2:
🔵 BUY ZONE: 3,295 – 3,293
Stop Loss: 3,289
Take Profit Targets:
3,300 – 3,304 – 3,308 – 3,312 – 3,316 – 3,320
Ideal scenario: wait for a retest of the breakout zone or EMA support (13/34) for a low-risk long entry.
🔻 SELL ZONE: 3,347 – 3,349
Stop Loss: 3,353
Take Profit Targets:
3,343 – 3,340 – 3,336 – 3,332 – 3,328 – 3,324 – 3,320
Only consider SELL if there's a strong rejection or bearish divergence at the highs.
📌 SUMMARY:
The bullish gap at the start of the week is a strong signal of trend continuation. Priority should be given to long setups if the price structure stays above key EMAs. Watch for potential fakeouts during NY session or Fed-related headlines. Stick to tight risk management.
