XAU/USD Outlook – Will This Tight Range Explode Soon?🔥 XAU/USD Outlook – Will This Tight Range Explode Soon?
📊 Technical Overview:
Gold (XAU/USD) has entered a consolidation phase after last week's sharp swings. The market is currently trapped within a tightening structure between 3,274 and 3,336, forming a potential wedge or triangle pattern. This type of structure often precedes a breakout.
Price is still hovering below the 200 EMA on the H1 timeframe, while key support zones are starting to show signs of buying interest. A hold above 3,301 could lead to a potential rally toward the upper resistance levels at 3,352 – 3,366.
🔺 Key Resistance Levels:
3,336.767
3,352.159
3,357.689
3,366.067
🔻 Key Support Levels:
3,301.370
3,291.885
3,274.779
🎯 Trade Setups:
🔵 BUY ZONE:
Entry: 3,274 – 3,276
SL: 3,270
TP: 3,284 – 3,291 – 3,301 – 3,336
🔴 SELL ZONE:
Entry: 3,357 – 3,366
SL: 3,370
TP: 3,336 – 3,301 – 3,291
📰 Today’s Market Focus:
No major economic data is expected today. However, markets may begin pricing in expectations ahead of this week’s key releases — ADP Employment Change and Nonfarm Payrolls (NFP).
Geopolitical tensions in South Asia and statements from FED officials may act as surprise catalysts for gold volatility.
🧭 Conclusion:
Gold remains stuck in a tight sideways channel. Traders should continue range trading while waiting for a confirmed breakout. A strong breakout above 3,366 or breakdown below 3,274 will set the tone for the next directional move.
👉 Trade smart and manage your risk. All eyes on U.S. data and geopolitical headlines!
Cfdtrading

Bearish Setup in Gold: Breakdown Confirmed with Strong Volume!Hey, what's up Traders! I’ve been watching Gold closely, and it seems like we’re seeing a descending channel setup. After hitting the top, it’s now testing the lower boundary. If Gold can't hold this support level, we could see a nice downward move. The entry range I’m eyeing is around 3275-3295 , with a stop loss just above at 3239 .
1st target : 3209
2nd target : 3160
Final target : 3120
The volume behind this move suggests we might see more selling pressure. If Gold breaks through the lower trendline, the downside move could gather more momentum. As always, let’s manage risk carefully, stay sharp, and watch the price action closely!
Disclaimer: This analysis is for educational purposes only. Please consult a financial advisor before making investment decisions.
If you found this helpful? Don’t forget to like, share, and drop your thoughts in the comments below.

Trading Plan – April 28, 2025: GOLD (XAU/USD) Strategy🌟 Daily Trading Plan – April 28, 2025: GOLD (XAU/USD) Strategy
📈 Technical Overview:
After the strong sell-off last week, gold is now consolidating around the key support zone 3260–3270.
Price action is tightening, forming a symmetrical triangle pattern on the M15 timeframe.
The MA 13 – 34 – 200 alignment suggests a short-term bearish trend, but selling momentum is weakening.
The chart indicates a potential retest towards resistance levels before deciding the next major move.
🎯 Key Price Zones to Watch:
Immediate Resistance: 3299 – 3313
Major Support: 3260 – 3268 – 3239
Potential Rebound Target: A retest towards 3299 – 3313 before a possible sell-off resumes.
📌 Trading Scenarios:
Primary Strategy: Look for short-term BUY setups near the 3260–3268 support zone, aiming for a corrective move towards resistance, then watch for SELL signals.
🎯 Detailed Plan:
🔵 BUY Zone: 3260 – 3258
Stop Loss: 3254
Take Profit: 3264 – 3268 – 3272 – 3276 – 3280 – 3290
🔴 SELL Zone: 3299 – 3301
Stop Loss: 3306
Take Profit: 3294 – 3290 – 3286 – 3282 – 3275
📢 Important Notes:
Today's price range could move between 60–80 pips, with no major economic events scheduled.
However, the market remains highly sensitive to geopolitical news, especially concerning India–Pakistan tensions and U.S.–China relations.
Always stick to your TP/SL plans and avoid FOMO during rapid price movements.
✅ Summary:
This is a high-sensitivity period for gold. Prioritize trading high-probability setups: BUY at support – SELL at resistance, and only scale in positions after clear confirmation!

Gold Retreats as Trump’s Trade Talk Flip Sparks CautionGold Retreats as Trump’s Trade Talk Flip Sparks Caution – Friday Volatility Expected 💥📉
🟡 Market Recap & Sentiment
Gold prices jumped over 1% this week, reaching around $3,500/oz, as investors sought safe-haven assets amid a weakening USD and global uncertainty. However, analysts believe this Price surge is driven by greed and needs a healthy correction.
“Gold might consolidate in the near term, but we’re still in a bull market. Dips will be bought,” said analyst Wong.
Meanwhile, the US Dollar and equities are losing their appeal as investors digest contradictory signals from President Trump. He confirmed that US-China trade negotiations are ongoing, while China denied any talks – sending shockwaves across markets and triggering a sharp pullback in gold during the Asian session.
This political flip-flop is adding confusion, and traders are advised to stay cautious before jumping into any positions.
📉 Fundamental Triggers Today
Core Retail Sales (US) – releasing later today during the US session.
It’s also Friday – which means potential for weekly candle closure volatility and liquidity grabs.
Coupled with the ongoing tariff headlines and geopolitical drama, today could be extremely unpredictable.
📍 Key Levels to Watch
Resistance: 3366 – 3384 – 3406 – 3428 – 3445
Support: 3308 – 3288 – 3270
🔹 Trade Setup Suggestion
🔸 BUY ZONE: 3288 – 3286
SL: 3282
TP: 3292 – 3296 – 3300 – 3304 – 3310
🔸 BUY ZONE: 3270 – 3268
SL: 3264
TP: 3274 – 3278 – 3282 – 3286 – 3290
🔻 SELL ZONE: 3384 – 3386
SL: 3390
TP: 3380 – 3376 – 3372 – 3368 – 3364 – 3360 – ???
🔻 SELL ZONE: 3406 – 3408
SL: 3412
TP: 3400 – 3396 – 3392 – 3388 – 3384 – 3380 – 3370 – 3360
⚠️ Risk Management Reminder
Be cautious today – it’s a Friday with major data and geopolitical uncertainty.
✅ Always respect TP/SL levels.
✅ Let the market show confirmation before entering positions.
Sit tight and let the market come to your zone – don’t rush in with FOMO during uncertain sentiment.

Gold Surge: 80 Price Bounce from Key Support Gold Surge: 80 Price Bounce from Key Support – What’s Next for the Market? 💰📈
Market Overview:
Gold has surged by 80 pips today, bouncing from the support level at the end of the U.S. session yesterday after liquidity was swept at the 3260 zone. Investors are now looking to buy the dip after the 250+ pip drop in gold over the past few days. Currently, after the strong 80 pip rally, gold is consolidating at the 0.382 Fibonacci retracement zone, with selling pressure mounting.
Key Price Levels to Watch:
Resistance: 3343, 3358, 3376, 3410, 3446
Support: 3210, 3286, 3275, 3230
Market Sentiment:
There’s a strong sell reaction at current levels, which suggests that the price could continue to push lower in both the Asian and European sessions to fill liquidity in the Fair Value Gap (FVG). After the 80 pip rally and 40 pip reaction, the market seems to be consolidating between 3328 and 3320. We expect a price movement range of 80-100 pips today, so caution is advised, especially around key levels at 3376-3378, where a potential sell can be placed.
Next Potential Movements:
If gold fails to break through the 3376-3378 resistance zone, we could see a continuation of the downward move. If the 3376-3378 zone holds strong, this could be a good opportunity to sell.
Should the price break through this zone, we’ll observe the next key resistance around 3410. A break above 3410 could signal a reversal to the upside, turning the trend into a BUY instead of SELL.
Today's Strategy:
For today, the focus will be more on SELL opportunities as gold pushes back to fill the FVG liquidity around 3288. Once we see how the price reacts at these levels, we can start planning for BUY entries.
Watch out for Unemployment Claims data from the U.S. later in the session, as this could trigger volatility. Be cautious when trading around news events, especially in a sensitive market.
Trade Setup:
BUY ZONE: 3230 - 3228
SL: 3224
TP: 3234 - 3238 - 3242 - 3246 - 3250 - 3254 - 3260
SELL ZONE: 3376 - 3378
SL: 3382
TP: 3372 - 3368 - 3364 - 3360 - 3355 - 3350
SELL ZONE: 3408 - 3410
SL: 3414
TP: 3402 - 3398 - 3394 - 3390 - 3386 - 3382 - 3375 - 3370
Risk Management:
It’s important to manage your risk appropriately given the current market conditions. Ensure you’re following your TP/SL levels strictly to protect your capital from market volatility.

Gold Faces 200 Pips Drop – Will It Recover or Continue Falling?Gold Faces 200 Pips Drop – Will It Recover or Continue Falling? 🔥📉
Market Overview:
Gold (XAU/USD) saw a sharp drop of nearly 200 pips yesterday, falling from the historic high of around $3500 to $3318. This marks the strongest correction in the recent bullish trend. The market is currently volatile, and the question is whether gold will find support at lower levels or continue its downward movement.
What’s Causing the Drop?:
Fed Rate News: The latest news from the Federal Reserve triggered strong profit-taking, which resulted in the sharp decline.
USD Technical Rebound: The USD has rebounded after significant losses, putting pressure on gold.
Market Sentiment Shift: Investor sentiment changed rapidly, leading to mass sell-offs.
Key Levels to Watch:
Support: 3300-3320 (Critical level for a potential bounce)
Resistance: 3378-3380 (Key resistance area)
Next Steps for Gold:
Support at 3300-3320: If gold holds above this range, a strong recovery could follow.
Break below 3300: A breakdown below 3300 may lead to further declines, potentially towards the next support at 3250.
Trading Strategy:
SELL ZONE:
3378 - 3380
SL: 3384
TP: 3374 - 3370 - 3366 - 3362 - 3358 - 3350
SELL ZONE:
3408 - 3410
SL: 3414
TP: 3404 - 3400 - 3396 - 3392 - 3386 - 3380
BUY ZONE:
3292 - 3290
SL: 3286
TP: 3296 - 3300 - 3304 - 3308 - 3312 - 3316 - 3320
Important Notes:
Risk Management: Due to high volatility, make sure to use appropriate stop losses (SL) and take profits (TP).
Watch for Key Levels: Pay close attention to the 3300-3320 zone for signs of a potential bounce or further breakdown.
Adapt to Market Movement: Given the uncertainty, stay flexible and adjust your strategy accordingly.
Conclusion:
Gold’s market is in a highly volatile phase. Key support and resistance levels will determine the next move. Keep a close eye on market reactions and act accordingly.

Buying Opportunities Based on Key Support and Resistance LevelsGold Strategy for Today: Buying and Selling Opportunities Based on Key Support and Resistance Levels 📈💰
Market Overview:
Gold (XAU/USD) is currently trading in a narrow range, with slight pullbacks but maintaining its upward trend. Below are the key levels that traders should pay attention to today:
Key Support Levels:
3,353.708: A strong support level, potentially a good buy entry if gold pulls back to this level.
3,334.067: Another support zone to keep an eye on for potential bounce if buying pressure remains strong.
Key Resistance Levels:
3,412.327: The primary resistance level; if gold breaks above this, it could continue pushing upwards.
3,419.386: The next significant resistance zone; watch for price action around this level.
Trading Strategy:
BUY ZONE:
3,353 - 3,334
SL: 3,328 (Stop loss to ensure protection)
TP: 3,368 - 3,380 - 3,390 - 3,400 - 3,420
SELL ZONE:
3,412 - 3,420
SL: 3,430 (Stop loss to ensure protection)
TP: 3,400 - 3,390 - 3,380 - 3,370 - 3,360
Outlook:
Gold is still in a strong uptrend, with key support levels at 3,353 and 3,334 providing good buying opportunities. However, as the price approaches resistance levels at 3,412 and 3,419, caution is advised when selling if the price fails to break through and continues higher.
Short-Term Strategy:
During the Asian and European sessions, traders can look for buy opportunities at the nearest support levels if the price pulls back while maintaining its upward momentum.
If the price reaches key resistance zones, consider selling with clear reversal signals.
Important Reminder:
Always stick to your TP/SL levels to ensure risk management and avoid large losses during volatile market conditions.

Consolidation Phase Before Breakout – Key Levels to Watch Bitcoin Technical Analysis: Consolidation Phase Before Breakout – Key Levels to Watch 📈💰
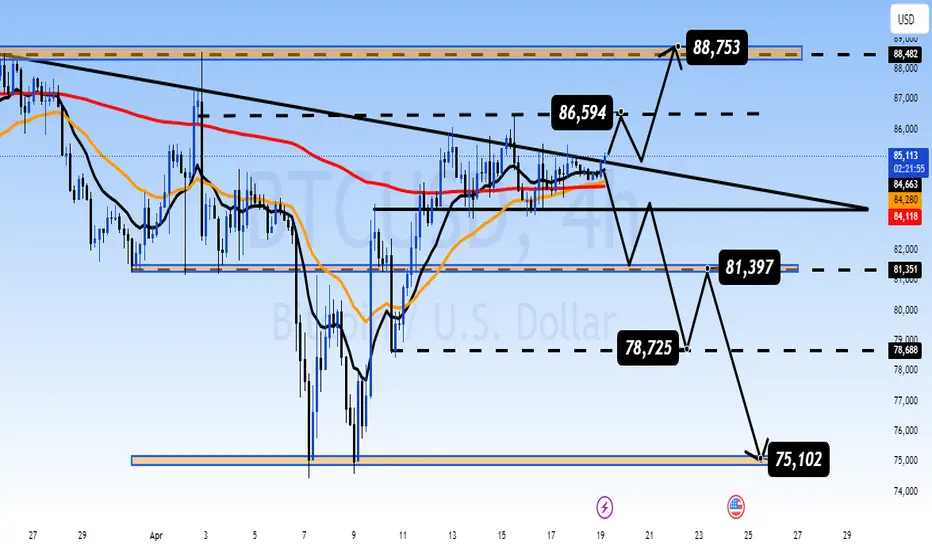
Market Overview: Bitcoin (BTC/USD) is currently navigating through a consolidation phase, forming a symmetrical triangle pattern on the 4-hour chart. The price action has been fluctuating between significant resistance at 86,594 and support at 78,725. As we approach the apex of the triangle, volatility is expected to rise, and a breakout from this range could set the direction for the next major move in Bitcoin's price.
Key Technical Levels:
Resistance: 86,594, 88,753
Support: 78,725, 75,102
Technical Indicators:
Bitcoin is holding above both the 50-day and 200-day moving averages (MA), confirming the overall bullish structure in the market. The price’s proximity to key resistance levels suggests that BTC is preparing for either a breakout or a pullback.
Currently, BTC is testing the upper trendline of the triangle, which means the market is gearing up for a potential decisive move. A break above the 86,594 level could send the price toward 88,753, and potentially higher, with 91,000 as a psychological target.
Chart Analysis:
Symmetrical Triangle Pattern: Bitcoin’s price movement has been restricted within the triangle’s boundaries. If the price breaks the 86,594 resistance, we could see BTC push to 88,753, and possibly even 91,000. However, if the breakout fails, BTC might retrace to the support levels at 78,725 or 75,102, which could provide better entry points for long positions.
The formation of the triangle indicates that the market is waiting for a clear direction. A breakout will likely be followed by a sharp movement either upwards or downwards, so traders should be prepared for a spike in volatility.
Macro Factors and Market Sentiment:
Geopolitical Tensions and Economic Uncertainty: The ongoing geopolitical tensions between major global economies, particularly the U.S. and China, have increased demand for safe-haven assets like Bitcoin. In addition, global inflation concerns continue to push investors toward digital gold as a store of value.
U.S. Federal Reserve Policies: The Fed’s actions regarding interest rates and monetary policy will have a direct impact on Bitcoin’s price. Any dovish stance or indications of more easing could benefit Bitcoin, as it is seen as a hedge against inflation and currency devaluation.
Market Outlook:
Bullish Scenario: A breakout above 86,594 could lead Bitcoin towards 88,753 and potentially 91,000. With Bitcoin’s bullish setup and safe-haven status, the next move might be strongly in favor of the bulls.
Bearish Scenario: If Bitcoin fails to break through resistance, we might see a retracement towards the support zones at 78,725 or 75,102, where buying opportunities may arise.
Trading Strategy:
BUY Zone: 78,725 - 75,102 (Look for a confirmation above support levels)
SELL Zone: 86,594 - 88,753 (Watch for a breakout above resistance for further upside)
Conclusion:
Bitcoin’s current consolidation phase has set the stage for a potential breakout. The price is testing crucial resistance levels, and the next few days could determine whether BTC will make a new push towards ATHs or pull back to retest lower levels. With the broader economic and geopolitical conditions favoring Bitcoin as a hedge, the long-term outlook remains bullish, but short-term volatility is expected.
GOLD WEEKLY OPEN – Sellers Hit Early, But Market Psychology🟡 GOLD WEEKLY OPEN – Sellers Hit Early, But Market Psychology Will Lead the Way
Gold kicked off the new week with a sharp drop during the Asian session, falling over 40 points from the previous highs (around 3018) down into the 297x zone. This reflects lingering sell pressure from the previous week’s volume.
However, gold quickly bounced back by nearly 40 points, confirming strong buy interest around 297x — a key level on the higher timeframes.
📌 This 297x zone is a critical support on H4/D1. A confirmed break below it could open the door for a deeper sell-off into 295x and beyond.
🔍 Technical Overview:
The broader trend on H4 and D1 still leans bullish.
However, psychological reactions from market participants are currently stronger than clean technical patterns.
On H1 and H2, price is now reacting to the 0.5 Fibonacci retracement.
A close below 3030 could trigger a renewed bearish move toward the 295x target.
🧠 Sentiment Will Drive Direction:
So far, only Asian and Australian sessions have participated.
We’ll need to monitor the London & US sessions closely to confirm directional conviction.
This is a sentiment-led market, not one purely ruled by structure → only trade from key zones with clean reaction signals.
🧭 KEY PRICE LEVELS:
🔺 Resistance:
3055 – 3076 – 3107
🔻 Support:
3024 – 3005 – 2970 – 2952
🎯 TRADE PLAN
🟢 BUY ZONE: 2980 – 2978
SL: 2974
TP: 2984 – 2988 – 2992 – 2996 – 3000
🔴 SELL ZONE: 3076 – 3078
SL: 3082
TP: 3072 – 3068 – 3064 – 3060 – 3056 – 3050
📅 Important this week:
Major data coming: CPI – PPI – FOMC Speeches → Expect potential spikes midweek. Stay alert, and I’ll update key reaction zones as the sessions unfold.
Stick to clear plans and always use TP/SL — capital protection comes first.
Good luck team,
— AD | Money Market Flow

GOLD ANALYSIS – NEW ATH AFTER TRADE TARIFF SHOCK!📊 GOLD ANALYSIS – NEW ATH AFTER TRADE TARIFF SHOCK!
Former U.S. President Donald Trump has officially announced a comprehensive global tariff policy, targeting multiple countries and regions. This unexpected move triggered strong risk-off sentiment, resulting in:
📉 Massive asset sell-offs
💵 A sharp decline in USD strength
🪙 And another all-time high (ATH) for GOLD
Gold broke out aggressively from a long-standing sideways triangle pattern, confirming strong bullish momentum. The counter-tariff reactions from other countries were far more aggressive than forecast, further fueling gold’s safe-haven appeal.
🔍 Technical Perspective
Yesterday, we successfully identified and traded within the triangle pattern by connecting recent highs and lows. The breakout came exactly as expected, especially nearing the end of the consolidation range — a classic price behavior traders should always watch for!
Now that the breakout has occurred, our focus shifts to BUYING on a retest of the breakout zone. Early entries during the Asian and European sessions are preferred, while we’ll reassess during the U.S. session due to upcoming economic data.
🔔 Note: With major events like Nonfarm Payrolls (NFP) coming soon, stay alert for volatility and unexpected moves.
📌 Key Resistance Levels:
3167 (ATH) - 3175 - 3185 - 3198 - 3206 (psychological/Fibonacci extensions – wait for candle confirmation)
📌 Key Support Levels:
3140 - 3132 - 3120
🎯 Trade Setups
BUY ZONE: 3132 – 3130
Stop Loss: 3126
Take Profits: 3136 – 3140 – 3144 – 3148 – 3152 – 3156 – 3160
SELL ZONE: 3185 – 3187
Stop Loss: 3191
Take Profits: 3180 – 3176 – 3172 – 3168 – 3160
⚠️ Final Notes:
The uptrend is clearly dominant — no need to FOMO sell at current highs. Be patient, wait for the market to reach key resistance zones (psychological or Fibonacci-based), then reassess.
📌 Avoid overtrading or aggressive selling — the tariff announcement is a global macro driver with deep market impact.
We’ll wait for Friday’s NFP to reassess broader sentiment.
As always: Respect your TP/SL levels to protect your capital.
Stay safe & trade smart! 💼📈

GOLD MARKET – Early Asian Spike Meets Resistance Ahead of ADP🟡 GOLD MARKET UPDATE – Early Asian Spike Meets Resistance Ahead of ADP
Gold saw a strong early move during the Asian session, rallying back into the 313x zone — largely supported by consistent buying flow from Asian and Middle Eastern investors, as seen in the bullish momentum early in recent Asian sessions.
However, price quickly reacted to the key resistance zone at 3130–3135, which was highlighted in yesterday’s plan. With selling pressure reappearing at this level, my view remains to look for sell setups in both the Asian and London sessions if price retraces upward again.
📉 Technical Structure:
Gold is approaching the tip of a symmetrical triangle pattern, suggesting an imminent breakout.
→ As always: wait for the breakout, then trade the retest in the breakout direction.
📰 Fundamental Watch:
All eyes will be on tonight’s ADP Non-Farm Employment data from the U.S.
Expectations are fairly optimistic — if the data comes in near or better than forecast, this could strengthen the USD and push gold lower, aligning with my bearish view toward the 308x–307x target zone.
🧭 Key Levels to Watch:
🔺 Resistance: 3128 – 3135 – 3142 – 3148
🔻 Support: 3110 – 3100 – 3080 – 3070
🎯 Trade Setup:
🟢 BUY ZONE: 3102 – 3100
SL: 3096
TP: 3106 – 3110 – 3114 – 3118 – 3122 – 3126 – 3130
🔴 SELL ZONE: 3148 – 3150
SL: 3154
TP: 3144 – 3140 – 3136 – 3132 – 3128 – 3124 – 3120
📌 Caution: Watch out for increased volatility during the US session with ADP release.
In Asia and Europe, stick to the technical zones above and always manage your TP/SL properly to protect your capital.
Good luck, stay sharp.
— AD | Money Market Flow

Gold Kicks Off April with a New ATH – Bulls Remain in Control Gold continued its explosive rally during the early Asian session today, printing yet another All-Time High (ATH) after retesting the 3,12x zone overnight.
The U.S. stock market reversed sharply higher in the New York session, and if this bullish momentum continues, gold could see a short-term pullback near current resistance before heading higher again.
However, if equities fail to hold and roll over, gold may push further into uncharted territory, eyeing extended targets around 315x – 317x.
📰 Macro Focus:
Investors seem to have interpreted Trump’s latest trade stance as more "measured" than previously feared.
In his latest comments, he signaled that “tariffs may play a smaller role in the overall economic strategy.”
This has calmed markets slightly but hasn’t slowed down the gold rush.
📈 Price Action & Outlook:
With current momentum and sentiment, gold still looks likely to print fresh ATHs this week.
The next major upside target sits around 316x – 318x, where we may finally see a significant pullback as FOMO cools down.
For now, watch the 312x – 311x zones for potential short setups at local resistance — as marked in AD’s key levels.
🧭 Key Technical Levels:
🔻 Support: 3133 – 3122 – 3111 – 3100
🔺 Resistance: 3158 – 3166 – 3172 – 3180
🎯 Trade Zones:
🟢 BUY ZONE: 3122 – 3120
SL: 3116
TP: 3126 – 3130 – 3134 – 3138 – 3142 – 3146 – 3150
🔴 SELL ZONE: 3170 – 3172
SL: 3176
TP: 3166 – 3162 – 3158 – 3152 – 3148 – 3144 – 3140
📊 What to Watch Today:
Investors will be closely watching ISM Manufacturing PMI and JOLTS Job Openings during the US session — expect volatility spikes.
As gold hovers near new ATHs, stay disciplined:
✅ Respect SL/TP
✅ Manage risk according to your account size
✅ Don’t get caught up in emotional trades
Wishing you a powerful and profitable start to the new month. Let’s flow smart.
— AD | Money Market Flow

GOLD SURGE CONTINUES – FEAR, WAR & END-OF-MONTH VOLATILITYGold opened this week with a strong upside gap, once again reminding us of how unpredictable Mondays can be following highly volatile weekends.
As always, when the market gaps significantly after the weekend, it's best to wait for price to absorb the remaining volume before locking into new setups.
As mentioned in previous outlooks, the current BUY pressure is still high, driven by a global wave of FOMO and fear, caused by:
Rising geopolitical tensions,
Global economic instability,
And even natural disasters now hitting parts of Asia.
Asian stock markets dropped sharply this morning after weekend developments escalated — with the Russia–Ukraine war showing no signs of de-escalation. In fact, new reports suggest a broader regional impact, further boosting risk-off sentiment.
💡 Safe Haven Flows Are Back in Full Force
Right now, gold is the #1 asset investors are paying attention to.
It's being treated as the ultimate flight-to-safety amid global panic and uncertainty.
And with this momentum, new ATHs may still be ahead.
📅 End-of-Month Candle Close – Expect Whipsaws
Today also marks the final trading day of the month, meaning we could see aggressive stop hunts and liquidity sweeps as large players look to close their monthly books.
➡️ Be extra cautious today — sharp moves up or down may occur due to end-of-month positioning.
Whether BUY or SELL, it’s best to trade tight, scalp smart, and respect your SL/TP.
Key Levels for 01/04:
🔺 Resistance: 3116 – 3132
🔻 Support: 3092 – 3085 – 3076 – 3066
🎯 Trade Plan:
SELL ZONE: 3130 – 3132
SL: 3136
TP: 3125 – 3120 – 3115 – 3110 – 3105 – 3100
BUY ZONE: 3066 – 3064
SL: 3060
TP: 3070 – 3075 – 3080 – 3085 – 3090 – 3095 – 3100
Stay sharp and trade with discipline.
End-of-month volatility is not for the weak hands.
— AD | Money Market Flow

Gold Price Analysis: Breakout, Pullback & Next Support LevelsHello Traders! In today's post, we’ll explore the technical analysis of Gold, one of the most reliable assets that traders look to for long-term gains. It’s an important tool for identifying potential breakout points in trending markets. If you want to learn how to trade these breakouts effectively, mastering the patterns in Gold is essential.
This chart of Gold (CFDs on Gold in USD) gives us a clear picture of the recent price movement and key levels to watch. After a period of consolidation, we saw a strong breakout towards the end of February 2025, signaling a continuation of the bullish trend. The price shot up, hitting notable targets a 10% gain to 253.91 and then another 10% to 267.34. However, as with any trend, there was a minor pullback, around a 2.31% drop, which is something traders should keep an eye on.
Now, the next crucial level to watch for Gold is the support zone around 2,791.048. If the price retraces and touches this support, it could be a strong buying opportunity for traders who are looking for a good entry point. The key here is whether Gold holds above this support level; if it does, the upward momentum could resume, leading to higher highs. This chart is a great reminder that while the market moves in waves, understanding these key levels helps us stay ahead in the game.
Disclaimer:- This analysis is for educational purposes only. Please trade responsibly and consult a financial advisor before making any decisions.
If you found this analysis helpful, don’t forget to like, follow, and share your thoughts in the comments below! Your support keeps me motivated to share more insights. Let’s grow and learn together—happy trading!

JP225 SHOWING A GOOD BREAKOUT MOVE WITH 1:15 RISK REWARD JP225 SHOWING A GOOD BREAKOUT MOVE WITH 1:15 RISK REWARD
DUE TO THESE REASON
A. its following a rectangle pattern that stocked the market
which preventing the market to move any one direction now it trying to break the strong resistant lable
B. after the break of this rectangle it will boost the market potential for break
C. also its resisting from a strong neckline the neckline also got weeker ald the price is ready to break in the outer region
all of these reason are indicating the same thing its ready for breakout BREAKOUT trading are follws good risk reward
please dont use more than one percentage of your capitalfollow risk reward and tradeing rules
that will help you to to become a bettertrader
thank you

US 30 Trade Idea Setup - Dow has been moving impulsively for the past months
- The important outlook here is that the trend is slowing down and one rebalancing is needed
- You can keep longing as long as Dow doesn't invalidate 38,900 post that you still need a confirmation
- Calling the TOP out here is stupidity
- follow the trend and long whenever you see deep retracements

US OIL BULLISH MOMENTUM DETECTEDUS OIL faceing a trendline support on week chat
Hence a good opportunity for all forex and CFD user to grab this one
It will be bullish for more than 1 mongth
Due to week chat analysis
Hence analyse yourself for short-term trade
just buy side only
Market is bullish
So trade only buy side on your trade setup

US100/ Nasdaq 100 Scalp Trade Setup - Nasdaq's price action looks tricky to play out
- Nasdaq can either fall clear some imbalanced inefficiencies
- Trade this cautiously before you want to enter a trade here

SPX SP500 Scalp Long Setup - Spx is currently hovering near the overhead supply
- Spx can throw up big soon
- I think before shaking out bears SPX can again grab some liquidity from the demand zone
- Retrace more and add back up
- Risk here is 0.3%

Long EUR/CADAfter the breakout from the rectangle on the hourly charts the pair is now testing the support. Stops will be below the range or in this case in the middle of the range. Instead of using the target here we can just use the moving average to ride the trend for as long as possible on the hourly time frame. One can also use the ichimoku for the same

Short sell DAXGerman DAX has been consolidating in a range for a while now and today it is breaking below the key level where it was bouncing from. This is on the back of the jobs data from the US but it had been pretty weak even before that. We are looking at the target of 15,000 in the index.

quick trade in jp morgan shortsideHello guys i had find this high RR quick trade in jp morgan it has made double top and breaking structure we can sell from here for the above sl and below support tg also do your own analysis before taking any position thank you
