Options OI Trade Outlook — Bullish Setups Only________________________________________
📊 Options OI Trade Outlook — Bullish Setups Only
“This analysis is shared purely for educational purposes and market awareness — not a trading recommendation.”
(Educational Purpose | Not Financial Advice | SEBI Compliant)
Hello Traders 👋,
Here are today’s 7 Bullish Option Setups based on OI + Price Action + IV + Greeks study.
This is strictly for learning and educational purposes only.
________________________________________
🟢 1. ITC 410 CALL
LTP: 7.25
Sentiment: Bullish | Trend: Up | Strength: 5/5 (Strong)
IV: 13.3 | Delta: 0.55 | Theta: -0.20 | Vega: 0.46
Buildup: Long Build-up
Why?
410 CE shows a strong Long Build-up with price ↑ 70.6% and OI ↑ 31.2%.
Volume jumped +305.9%, confirming active participation.
Low IV makes premiums attractive. Delta 0.55 indicates higher ITM probability.
________________________________________
🟢 2. CGPOWER 700 CALL
LTP: 23.5
Sentiment: Bullish | Trend: Up | Strength: 5/5 (Strong)
IV: 30.9 | Delta: 0.52 | Theta: -0.65 | Vega: 0.79
Buildup: Long Build-up
Why?
700 CE surged +127% in price with OI ↑ 216.5% — strong long confirmation.
Volume spiked +2962%, showing aggressive buying.
IV rising (+10.3%) supports premium expansion.
________________________________________
🟢 3. COLPAL 2340 CALL
LTP: 61.7
Sentiment: Bullish | Trend: Up | Strength: 5/5 (Strong)
IV: 22.4 | Delta: 0.53 | Theta: -1.52 | Vega: 2.64
Buildup: Long Build-up
Why?
2340 CE gained +89.8% in price with OI ↑ 146.9%.
Volume surged +2357%, indicating strong trader interest.
Moderate IV gives a balanced risk-reward setup.
________________________________________
🟢 4. LT 3600 CALL
LTP: 76.25
Sentiment: Bullish | Trend: Up | Strength: 5/5 (Strong)
IV: 15.9 | Delta: 0.55 | Theta: -2.34 | Vega: 4.06
Buildup: Long Build-up
Why?
3600 CE rose +29.2% with OI ↑ 3.6%.
Volume ↑ 71%, confirming active participation.
Delta 0.55 signals higher ITM chances with bullish momentum.
________________________________________
🟢 5. BRITANNIA 5800 CALL
LTP: 172
Sentiment: Bullish | Trend: Up | Strength: 5/5 (Strong)
IV: 21.6 | Delta: 0.57 | Theta: -3.46 | Vega: 6.52
Buildup: Long Build-up
Why?
5800 CE rallied +49.6% with OI ↑ 16.5%.
Volume jumped +566%, confirming buying momentum.
IV rising (+9.4%) shows strong premium expansion potential.
________________________________________
🟢 6. ASIANPAINT 2500 CALL
LTP: 77
Sentiment: Bullish | Trend: Up | Strength: 3.9/5 (Strong)
IV: 20.8 | Delta: 0.59 | Theta: -1.40 | Vega: 2.79
Buildup: Short Covering
Why?
2500 CE benefited from short covering — price ↑ 21% while OI ↓ 21.6%.
This indicates shorts exiting, fueling bullish momentum.
Volume dipped (-15.9%), so position sizing should be careful.
________________________________________
🟢 7. DMART 4800 CALL
LTP: 101
Sentiment: Bullish | Trend: Up | Strength: 5/5 (Strong)
IV: 20.2 | Delta: 0.50 | Theta: -3.53 | Vega: 5.40
Buildup: Long Build-up
Why?
4800 CE rose +12.1% with OI ↑ 17.5% — strong long confirmation.
Volume ↑ 159.9% adds conviction.
IV easing (-6.1%) ensures better fills with controlled risk.
________________________________________
⚠️ Disclaimer – Please Read Carefully
The information shared here is meant purely for learning and awareness.
It is not a buy or sell recommendation and should not be taken as investment advice.
📌 I am not a SEBI-registered investment advisor.
📌 All views expressed are based on personal study, chart patterns, and publicly available data.
📌 Trading in stocks or options carries risk. Markets can move unexpectedly. Losses can exceed capital.
📌 Past setups do not guarantee future outcomes.
👉 Beginners: Use this for study & paper trading only.
👉 Experienced traders: Apply your own risk management & strategy filters.
👉 Always consult a SEBI-registered financial advisor before real trades.
________________________________________
💬 Found this useful?
🔼 Boost this post to help more traders learn.
✍️ Share your thoughts/setups in comments — let’s grow together.
🔁 Share with fellow traders & learners.
👉 Follow for more clean, structured breakdowns with discipline at the core.
🚀 Stay Calm. Stay Clean. Trade With Patience.
Trade Smart | Learn Zones | Be Self-Reliant 📊
________________________________________
CGPOWER

CG power : keep adding 6670
Stock is given good results and it is trading above the demand zone.
Enter with long term views if 1250 in 1.5 years. Enter around 660,645, 600
Sl? 533
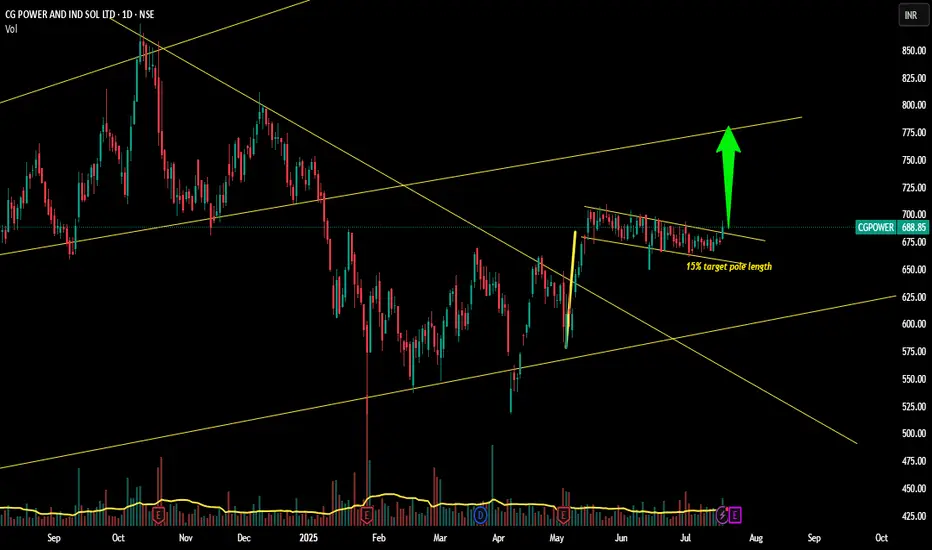
CGPOWER Bullish flag Breakout!!!!Yes!!!
Chart looks good for a good upmove
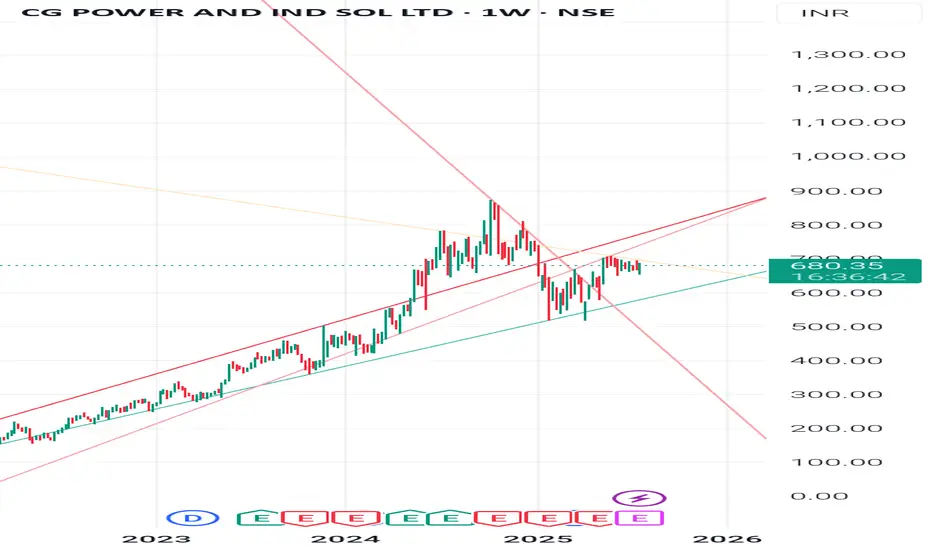
Weekly chart shows a GOOD BREAKOUT(shown below)
Daily chart shows a Bullish flag and pole and BREAKOUT WITH VOLUME TODAY !!!!
SL can be taken as 666....(bit wider) or the low of todays candle...
Targets-715,730,752
Just my view...not a tip nor advice!!!
Thank you!!!!
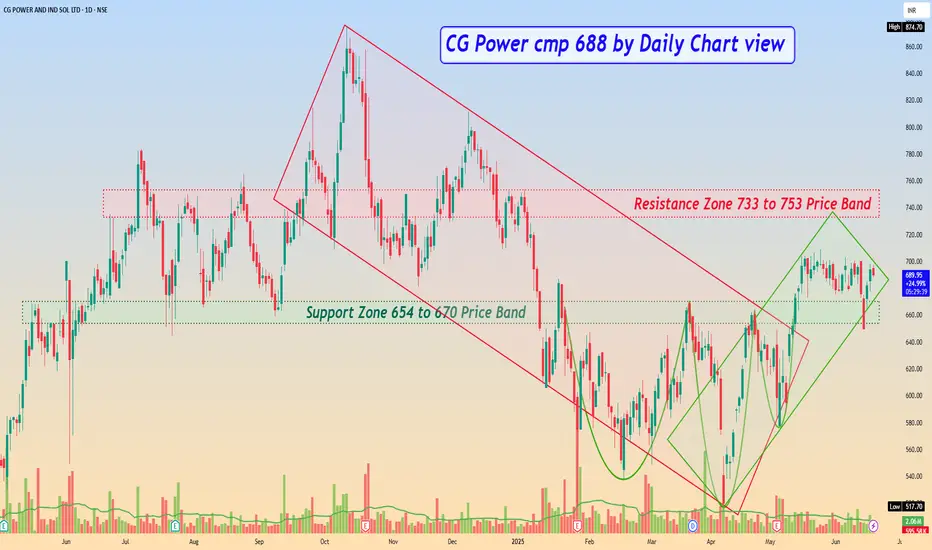
CG Power cmp 688 by Daily Chart viewCG Power cmp 688 by Daily Chart view
- Support Zone 654 to 670 Price Band
- Resistance Zone 733 to 753 Price Band
- Back to Back repeated Bullish Rounding Bottoms
- Volumes are in good sync of avg traded quantity
- Falling Parallel Price Channel Breakout has well sustained
- Rising Parallel Price Channel momentum going up steadily
- Stock Price under consolidation and sustaining decently above Support Zone
CG POWER AND IND SOL LTDCGPOWER has been trading within a descending channel pattern for the past several months.
The stock is testing the upper trendline of this descending channel. A breakout above this descending channel would indicate a trend reversal. The daily candle is bullish, with a close near the high of the day, showing positive momentum. If it breaks and sustains above 705, it could reach 740 and 780

CGPOWER INVERSE H&S REVERSAL PATTERNCgpower is breaking inverse h&s reversal pattern
breaking 200 ema also
with good volume,bullish rsi
breakoing and holding 690 can take it 750-800
NO BUY/SELL RECOMENDATION

CG Power : Showing signs of reversal#CGpower is showing signs of reversal - will it sustain ?
- The volatility in the stock has shot up significantly in past 2 days !
- Technically, the CG Power solutions has given early signs of reversal in weekly charts, with 530-540 acting as support zone, while 640, followed by 680 - 700 will act as strong resistance for Feb series
- On the fundamental side, CG Power share price is trading at P/E ratio of ~ 99 (high), and may limit big upside for time being.
- Any -ve news can hammer the stock back to 420- 450 zone (series of supports are placed !)
#learn_at_stoxsense #Learntradingwithsudhir #StockMarketIndia #Optiontrading #learntrading

CGpowerBearish trend reversal pattern head and shoulder is clearly evident
711-685 is crucial level to break down.

CGPOWER DOUBLE BOTTOM BREAKOUTCGPOWER breaking double bottom reversal pattern
with good volume strong rsi
after breaking 780 #target 874
sl can be 730
NO BUY/SELL RECOMENDATION

CG Power and Industrial Solution - Breakout Setup, Move is ON...#CGPOWER trading above Resistance of 783
Next Resistance is at 1014
Support is at 647
Here are previous charts:
Chart is self explanatory. Levels of breakout, possible up-moves (where stock may find resistances) and support (close below which, setup will be invalidated) are clearly defined.
Disclaimer: This is for demonstration and educational purpose only. This is not buying or selling recommendations. I am not SEBI registered. Please consult your financial advisor before taking any trade.

CGPOWER -Cup and Handle -Breakout - DailyThe chart for CG Power and Industrial Solutions Ltd. shows a clear Cup and Handle pattern, which is a bullish continuation pattern. This is confirmed by both price action and volume. Below is a breakdown of the technical and fundamental aspects of the stock.
Technical Analysis:
Cup and Handle Pattern:
The chart clearly depicts a Cup shape, where the stock gradually moved lower and then formed a rounded bottom.
The Handle follows a smaller, tighter consolidation just before a breakout.
A breakout from the handle suggests a potential continuation of the previous uptrend, which has already been confirmed by a move above 814.40 INR.
Volume:
There is an evident volume spike during the breakout from the handle, indicating strong buying pressure, which is a key confirmation for this bullish pattern.
This increasing volume during the breakout is essential to validate the move upward, and it suggests a likely continuation of the rally.
Price Targets:
The measured move from the bottom of the cup to the resistance (around 136.25 INR) is projected upwards from the breakout point.
The first target is set around 919.25 INR, which is approximately 17.42% above the current breakout level.
An extended target can be projected beyond this, but the 919.25 INR level acts as the immediate resistance.
Support Levels:
782.45 INR is the key support level, acting as the breakout point of the handle.
643.15 INR is a more extended support level based on historical price action. If the stock retraces, this level might be tested.
Trend:
The overall trend is bullish, supported by the stock’s higher highs and higher lows. The recent consolidation was necessary for the continuation of the uptrend.
Risk Management:
A stop-loss can be placed below 782.45 INR or 643.15 INR, depending on risk tolerance.
Fundamental Analysis:
Company Overview:
CG Power and Industrial Solutions Ltd. is involved in manufacturing electrical equipment and industrial solutions, which includes transformers, switchgears, and motors.
With increasing investments in infrastructure and industrial sectors, the company stands to benefit from both domestic and international growth.
Financial Health:
The company has seen improved financial performance in recent quarters, with growing revenues and improved margins due to operational efficiencies.
Key financial metrics like Return on Equity (RoE) and Net Profit Margin have improved, signaling strong financial health.
Sector Outlook:
The power and industrial solutions sector is expected to witness strong demand, driven by investments in infrastructure and renewable energy.
Government policies encouraging industrial expansion and power grid modernization further support a bullish outlook for companies like CG Power.
Recent Developments:
Recent earnings reports have indicated significant improvements, and management’s forward guidance has been positive, hinting at sustained growth in the upcoming quarters.
Conclusion:
Technical Outlook: The Cup and Handle pattern suggests a potential rally towards 919.25 INR, with strong buying interest indicated by volume spikes.
Fundamental Outlook: The company's fundamentals are sound, with increasing revenues, improved profit margins, and a favorable industry outlook.
The stock has a bullish setup both technically and fundamentally, making it attractive for medium to long-term investors. However, appropriate risk management is essential, especially around key support levels.

CGPOWER RECTANGLE BREAKOUTCGPower breaking a rectangle pattern
huge volume building up with strong rsi
macd crossover done
#target 900 sl 750
EDUCATIONAL IDEA

CGPOWER BREAKOUTTrendline has already broken. Now the stock is ready to break ATH
Disclaimer
The ideas and views shared here are for educational and informational purposes only and should not be considered financial advice. Trading and investing in financial markets involve significant risk, and past performance does not guarantee future results. Please do your own research (DYOR) and consult with a certified financial advisor before making any trading or investment decisions. I will not be liable for any financial losses or gains resulting from following these ideas. Trade carefully and at your own risk.

CG POWER is again RockingThere is a one more stock Which is showing a great opportunity again, stock is near resistance and ready to blast already moved a little today in 4 hour TF. what is your view please comment it down. We are NISM Certified. All views shared on this channel are my personal opinion and is shared for educational purpose and should not be considered advise of any nature.

CG Power looks strongNSE:CGPOWER has declared a strong set of numbers and continues to do well even in a weak market. Keep a stop loss at 540 (for short term traders) and continue to ride momentum here.

CG Power and Industrial Solution - Breakout Setup, Move is ON...#CGPOWER trading above Resistance of 527
Next Resistance is at 647
Support is at 417
Here is previous chart:
Chart is self explanatory. Levels of breakout, possible up-moves (where stock may find resistances) and support (close below which, setup will be invalidated) are clearly defined.
Disclaimer: This is for demonstration and educational purpose only. This is not buying or selling recommendations. I am not SEBI registered. Please consult your financial advisor before taking any trade.

CG Power: Range breakout on back of expected good QTR NumbersNSE:CGPOWER - Technical Analysis Update 🚀📊
Current Price: ₹479.65 (as of Jan 5, 2024, 12:08 PM)
Key Indicators:
Opening Price: Above critical level of ₹469.75, indicating a positive trend 🟢
Moving Averages: Recent bullish crossover in EMA and MA
MACD: Anticipated crossover in next 1-2 days; Current MACD at 6.85, Signal at 7.82
Stochastic RSI: Recovery from oversold, K at 61.25, D at 33.09
%R: -31.76, still below upper band
Fisher Transform: Positive crossover at 0.08 (Fisher), -0.37 (Trigger)
Market Outlook:
Positive momentum observed, with a break in the short-term price range.
Bullish signals from moving average and MACD crossovers.
Trading Targets:
First Target: ₹488.50 🎯
Second Target: ₹503.55 🎯
Caution:
STOP LOSS: exit around ₹461.55 - ₹461.80 (0.382 Fibonacci level).
Monitor closely for sustaining the upside movement. ⛔
Conclusion:
CG Power shows strong potential for growth, with key indicators pointing towards a bullish trend. Ideal for investors looking at short to mid-term gains. Stay vigilant and trade smartly! 🌟⚡
Disclaimer:
Informational Purpose: This analysis is for informational purposes and does not constitute financial advice.
No Guarantee: The accuracy or completeness of the information is not guaranteed.
Investment Risks: Stock market investments are subject to market risks, including the loss of principal.
Independent Research: Investors should conduct their own research and consult a financial advisor before making investment decisions.
No Responsibility: The author is not liable for any losses or damages arising from the use of this analysis.
Regulatory Compliance: This analysis is not a guarantee against regulatory risks.
Hashtags:
#CGPower #StockMarketIndia #TechnicalAnalysis#InvestingTips #NSEIndia #TradingView #StocksToWatch #MarketInsights #Finance #TradingSignals #WealthManagement #InvestmentStrategy #BullishTrends #FinancialPlanning

CGPOWER all time high breakout stock you can buy this stockCG POWER all-time high breakout stock you can buy this stock intraday as swing above 431 for the stop loss of @424 on the closing basis

Breakout in CG Power and Industrial Solutions Ltd...Chart is self explanatory. Levels of breakout, possible up-moves (where stock may find resistances) and support (close below which, setup will be invalidated) are clearly defined.
Disclaimer: This is for demonstration and educational purpose only. This is not buying or selling recommendations. I am not SEBI registered. Please consult your financial advisor before taking any trade.

CG Power to take long entryCG Power in an uptrend. It can take a long entry above 380 as per the price action movement. All important levels are marked on the charts. This is for your educational purpose only.

CGPOWERCGPOWER:- If it sustains after giving a breakout, then a good movement to the upside can be seen, till then keep an eye on the stock.
Hello traders,
As always, simple and neat charts so everyone can understand and not make it too complicated.
rest details mentioned in the chart.
will be posting more such ideas like this. Until that, like share and follow :)
check my other ideas to get to know about all the successful trades based on price action.
Thanks,
Ajay.
keep learning and keep earning.

CGPOWER - Ichimoku Bullish Breakout Stock Name - CG Power and Industrial Solutions Ltd
Ichimoku Cloud Setup :
1). Today's close is above the Conversion Line
2). Future Kumo is Turning Bullish
3). Chikou span is slanting upwards
All these parameters are showing bullishness at Current Market Price
and more bullishness AFTER crossing 355
#This is not Buy and Sell recommendation to any one. This is for education purpose and a helping hand to learn trading in Market.
# Cloud Trading
# Ichimoku Cloud
# Ichimoku Followers
I hope you all like my analysis.
Please do share your thoughts into comment section.
Please give a like, share & subscribe for daily analysis.

1 Support based and 1 Breakout based trade for 10 mayI daily make educational content videos for swing trading
