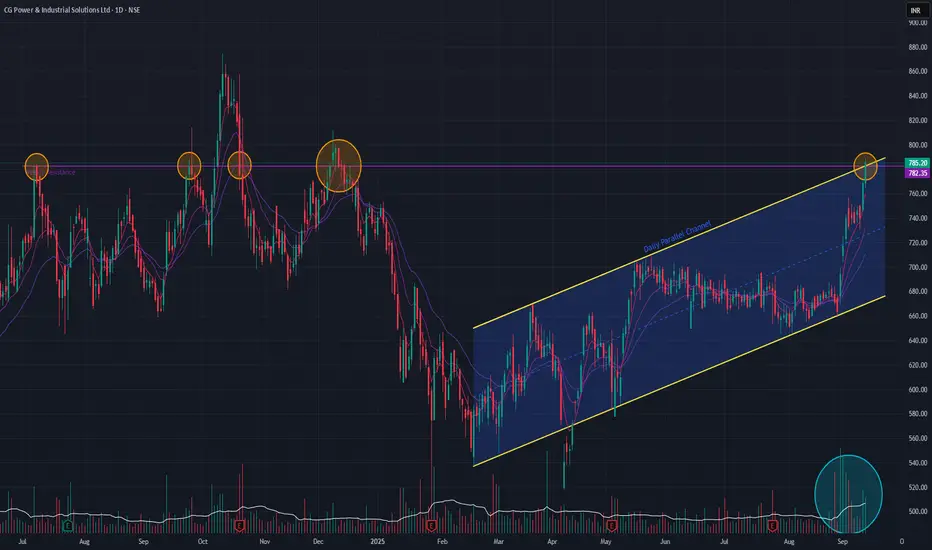
CG Power (Daily Timeframe) - Potential BreakOut CG Power has been consolidating below a major horizontal resistance line established in July 2024, which has so far prevented new all-time highs. Following a downtrend that began in October 2024, the stock has been trading within a well-defined parallel channel.
Today's price action is particularly bullish, as the stock is attempting a breakout from a confluence of resistance: the top of the parallel channel and the long-term horizontal trendline.
This significant move is supported by two key technical indicators:
The short-term EMAs are in a Positive Crossover (PCO) state.
An SMA Golden Cross occurred just a few days ago.
A sustained breakout above this confluence would be a strong signal that the uptrend is resuming.
Cgpowerandindsolutions
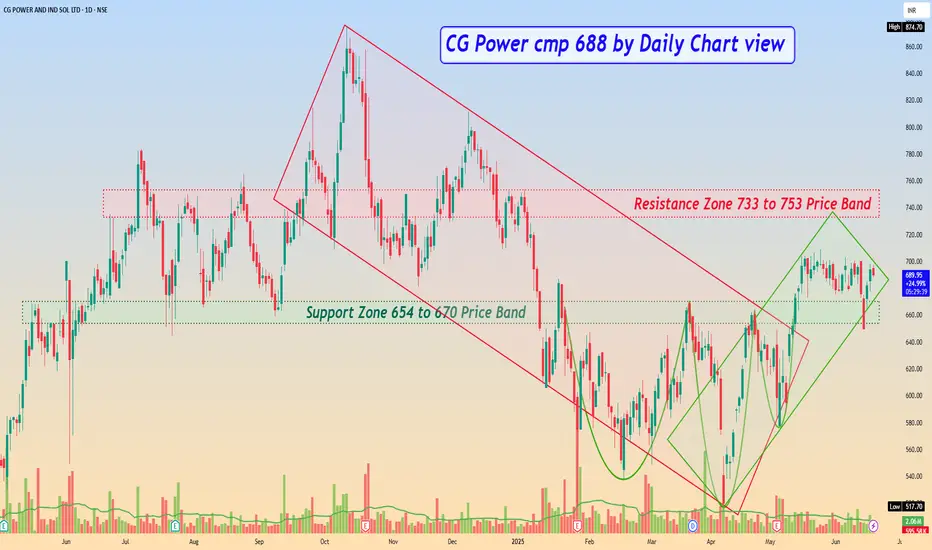
CG Power cmp 688 by Daily Chart viewCG Power cmp 688 by Daily Chart view
- Support Zone 654 to 670 Price Band
- Resistance Zone 733 to 753 Price Band
- Back to Back repeated Bullish Rounding Bottoms
- Volumes are in good sync of avg traded quantity
- Falling Parallel Price Channel Breakout has well sustained
- Rising Parallel Price Channel momentum going up steadily
- Stock Price under consolidation and sustaining decently above Support Zone