GMDC - Chart of The Week, Testing Trendline, Change of PolarityNSE:GMDCLTD has a beautiful structure on the Weekly Timeframe to qualify for my Chart of the Week idea. It saw Decent Above-Average Volumes and confirmed a Change of Polarity and is Now Testing the Falling Trendline with RSI and MACD trending upwards.
About:
NSE:GMDCLTD is primarily engaged in 2 sectors, i.e. mining and power. Its projects include Lignite, Bauxite, Fluorspar, Multi-Metal, Manganese, Power, Wind and Solar.
Trade Setup:
It could be a good Swing Trade if it breaks the trendline and the Change of Polarity is Still Intact.
If the Trade gets activated after breaking the trendline, then keep this Week's Low as the Stop Loss or Even Take RSI and MACD as a Stop Loss Signal.
📌Thank you for exploring my idea! I hope you found it valuable.
🙏FLLOW for more
👍BOOST if useful
✍️COMMENT below with your views.
Meanwhile, check out my other stock ideas on the right side until this trade is activated. I would love your feedback.
Disclaimer: "I am not SEBI REGISTERED RESEARCH ANALYST AND INVESTMENT ADVISER."
This analysis is intended solely for informational and educational purposes and should not be interpreted as financial advice. It is advisable to consult a qualified financial advisor or conduct thorough research before making investment decisions.
Changeofpolarity

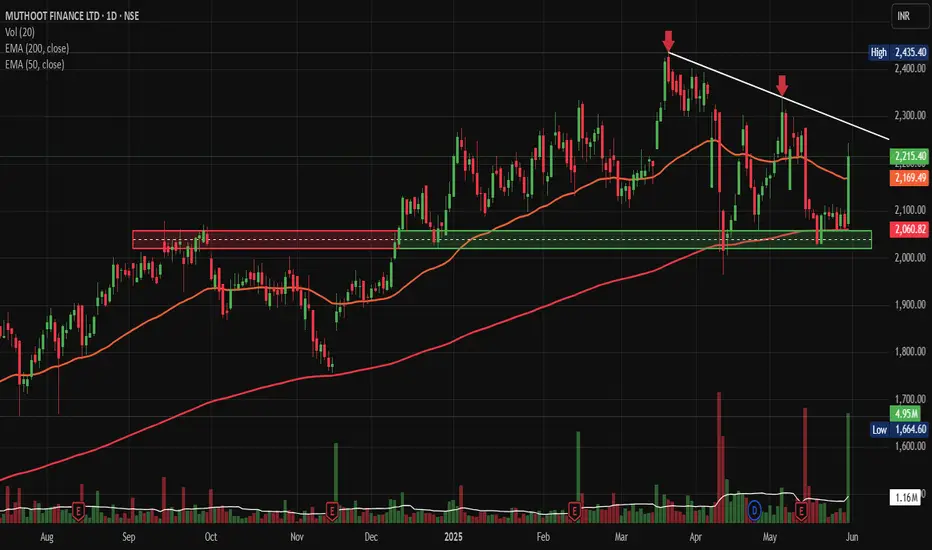
Muthoot Fin. bounce from Polarity LevelsNSE:MUTHOOTFIN made a good bounce from Polarity Levels with a huge candle again with high Volumes and closing above 50 DEMA, taking Support of 200 DEMA.
On the back news of the finance ministry seeking relaxation in the new rules on gold loans proposed by the central bank, they proposed that small ticket borrowers below 200,000 rupees should be excluded from the tighter rules to ensure speedy disbursements.
Price Action & Volume Analysis:
The stock has been consolidating in a well-defined range between ₹2,060-2,070 (support zone) and ₹2,400-2,435 (resistance zone) since April 2025. Today's strong move with above-average volume of 1.16M shares (compared to the 20-day average) suggests institutional participation and potential breakout momentum.
The price action shows a classic "coiling" pattern within the broader range, with decreasing volatility over the past few weeks, often a precursor to significant directional moves.
Key Technical Levels:
Support Zones:
- Immediate Support: ₹2,169-2,180 (50 EMA confluence)
- Strong Support: ₹2,060-2,070 (tested multiple times since April)
- Critical Support: ₹1,950-1,980 (October 2024 breakout level)
Resistance Zones:
- Immediate Resistance: ₹2,300-2,320
- Major Resistance: ₹2,400-2,435 (multiple rejections)
- Extension Target: ₹2,500-2,550
Base Formation & Pattern Recognition:
The stock has formed a robust Ascending Triangle pattern since the October 2024 lows. The horizontal resistance at ₹2,400-2,435, combined with rising support levels, creates a bullish continuation pattern. The triangle's apex is approaching, suggesting an imminent breakout.
Additionally, there's a clear Flag and Pole formation visible from the March-April rally, with the current consolidation representing the flag portion.
Moving Average Analysis:
- 50 EMA (Orange): Currently at ₹2,169, acting as dynamic support
- 200 EMA (Red): Located around ₹2,000, providing long-term trend support
- The stock is trading above both key EMAs, confirming the bullish trend structure
Trade Setup & Strategy:
Bullish Breakout Play:
Entry Strategy:
- Primary Entry: ₹2,320-2,330 (on volume breakout above resistance)
- Alternative Entry: ₹2,280-2,290 (pullback entry if direct breakout fails)
Target Levels:
- Target 1: ₹2,500 (measured move from triangle base)
- Target 2: ₹2,650 (extension target)
- Target 3: ₹2,800 (psychological resistance)
Risk Management:
- Stop Loss: ₹2,150 (below 50 EMA and swing low)
- Risk-Reward Ratio: 1:2.5 to 1:3.5
Position Sizing:
Risk should only be 1-2% of portfolio capital, given the stop loss distance.
Volume Confirmation:
Today's volume spike to 1.16M shares is encouraging, representing nearly 25% above the average. This volume expansion, coinciding with price advancement, suggests institutional accumulation. Watch for sustained volume above 1M shares for breakout confirmation.
Sectoral & Fundamental Backdrop:
NBFC Sector Dynamics:
The Non-Banking Financial Company (NBFC) sector has been gaining traction due to:
- Improving the credit growth environment
- RBI's supportive regulatory stance
- Rising rural credit demand
- Digital transformation initiatives
Muthoot Finance Fundamentals:
- Dominant player in gold financing with 5,000+ branches
- Strong asset quality with minimal NPAs
- Consistent dividend payout history
- Beneficiary of rising gold prices and rural credit demand
- Digital initiatives expanding customer base
Macro Tailwinds:
- Monsoon predictions favouring the rural economy
- Wedding season demand for gold loans
- Formalization of the gold loan market
- Potential interest rate stabilization
Risk Factors:
Technical Risks:
- Failure to sustain above ₹2,300 could lead to range continuation
- Broader market correction could impact individual stock performance
- Sector rotation away from financials
Fundamental Risks:
- Gold price volatility affecting loan demand
- Regulatory changes in the NBFC space
- Competition from banks in the gold loan segment
My Take:
NSE:MUTHOOTFIN presents an attractive risk-reward setup with its ascending triangle breakout potential. The combination of strong fundamentals, sector tailwinds, and technical setup creates a compelling investment thesis. However, strict adherence to stop losses and position sizing remains crucial given the inherent market volatility.
The stock appears poised for a significant move, with the technical pattern suggesting a higher probability of an upside breakout. Traders should wait for volume confirmation above ₹2,320 levels before initiating positions.
Keep in the Watchlist.
NO RECO. For Buy/Sell.
📌Thank you for exploring my idea! I hope you found it valuable.
🙏FOLLOW for more
👍BOOST if you found it useful.
✍️COMMENT below with your views.
Meanwhile, check out my other stock ideas on the right side until this trade is activated. I would love your feedback.
Disclaimer: "I am not SEBI REGISTERED RESEARCH ANALYST AND INVESTMENT ADVISER."
This analysis is intended solely for informational and educational purposes and should not be interpreted as financial advice. It is advisable to consult a qualified financial advisor or conduct thorough research before making investment decisions.