MPHASIS 1 Week Time Frame 📊 Weekly Support & Resistance Levels
(From recent weekly technical outlook)
Resistance
R1: ₹2,863 – ₹2,865 region
R2: ~₹2,920 – ₹2,919
R3 (Bullish breakout): ~₹2,965
Support
S1 (Immediate): ~₹2,762
S2: ~₹2,717
S3 (Strong support): ~₹2,660
This gives a probable weekly trading range of ~₹2,660 to ₹2,965.
📉 Pivot Point Reference (Short-Term)
From a recent pivot calculation — can help identify intra-week turning points:
Classic pivot point around ~₹2,817 with:
S1: ~₹2,796
S2: ~₹2,776
S3: ~₹2,755
R1: ~₹2,817
R2: ~₹2,837
R3: ~₹2,858**
📈 Current Technical Signals Context
EMA/SMA and oscillators on daily/weekly are mixed to neutral-bullish — some sources show buy bias while others show weak trend — indicating no strong breakout trend yet and trending within range unless a clear break happens.
✅ Summary for 1-Week Level Strategy
Bullish break above: ~₹2,920–₹2,965
Key support zone to watch: ~₹2,660–₹2,762
Neutral pivot: ~₹2,800–₹2,830
Chart-patterns

BTC/USD 1 Month Time Frame 📊 Current Price Snapshot (Latest Available)
$90,478.00
📊 1‑Month Key Levels — BTC / USD
🛑 Resistance Levels (Upside)
These are areas where price has struggled to break above recently:
1. Major Resistance: ~$108,000–$112,000
• Multiple tests and sellers here — strong supply zone.
2. Intermediate Resistance: ~$100,000
• Psychological barrier and past pivot point.
💡 A successful break above these could signal bullish continuation and a shift in momentum.
🟩 Support Levels (Downside)
These are floors where price tends to stabilize or bounce:
1. Immediate Support: ~$84,000–$87,000
• Critical support zone on monthly chart — losing this could strengthen bearish momentum.
2. Secondary Support Zone: ~$80,000
• Structural support from past price action.
3. Lower Support: ~$75,000
• Major defense area if broader sell‑offs continue.
📉 If these support levels break decisively with volume, risk increases for deeper pullbacks.
📌 How to Use These Levels
🕐 1‑Month Time Frame Interpretation
Bullish bias if BTC holds above ~$90k–$100k, especially with higher highs.
Neutral / Range‑bound if price oscillates between ~$84k–$108k.
Bearish bias if BTC breaks below ~$84k with conviction (higher volume and clear close below).
These levels reflect recent technical structure and psychological zones, commonly used by traders to set entries, exits, and risk management.

STEELCAS 1 Day Time Frame 📊 Current Price Snapshot (Latest Available)
Approx Live Price: ~₹210–₹213 per share (recent session)
Today’s Day Range (recent close): ~₹208–₹214
📈 Accurate Daily Support & Resistance Levels
🔹 Pivot Point (Day Reference)
Pivot: ~₹206.55–₹213.62 (central reference)
📉 Support Levels
S1: ~₹203.7–₹205.8 – first key support
S2: ~₹197.1–₹201.1 – stronger secondary support
S3: ~₹188.8–₹193.3 – deep support zone
📈 Resistance Levels
R1: ~₹218.5–₹218.3 – first resistance
R2: ~₹226.8–₹226.1 – next upside target
R3: ~₹233.4–₹230.7 – higher resistance
🧠 How to Use These Levels (Daily Time Frame)
Bullish scenario
Break and hold above R1 (~₹218–219) could signal continuation toward R2 (~₹226+).
Sustained break above R2 strengthens trend.
Bearish scenario
Failure under Pivot (~₹206–213) with close below S1 (~₹204–206) may open S2 (~₹197) and S3 (~₹188).
Look for volume confirmation on breakdowns.
📍 Quick Reference Summary (Daily Levels)
Level Price Approx
R3 ~₹230–₹233+
R2 ~₹226–₹227
R1 ~₹218–₹219
Pivot ~₹206–₹213
S1 ~₹203–₹206
S2 ~₹197–₹201
S3 ~₹188–₹193

HCLTECH 1 Month Time Frame 📌 Current Price Snapshot
Approx. live share price: ₹1,640–₹1,650 range on NSE today.
📅 1‑Month Price Context
Over the past month, HCLTECH has generally traded between roughly ₹1,590 – ₹1,680 before recent moves.
📊 Key 1‑Month Technical Levels
🔹 Immediate Support Levels
These are short‑term levels where price may find buying interest:
S1: ~₹1,620
S2: ~₹1,605
S3: ~₹1,592
(support levels from pivot analysis)
Additional support areas if price falls further:
~₹1,580–₹1,570 (psychological region and recent consolidation area)
🔺 Immediate Resistance Levels
These are short‑term levels where price may face selling pressure:
R1: ~₹1,647–₹1,650
R2: ~₹1,660
R3: ~₹1,670–₹1,675
(pivot‑based resistance zones)
If bulls push higher:
~₹1,690–₹1,700 is a possible zone of next resistance before bigger range tests.
📈 Trend & Moving Averages (1‑Month)
20 DMA: ~₹1,659
50 DMA: ~₹1,610
100 DMA: ~₹1,536
200 DMA: ~₹1,564
(latest moving averages reflect neutral‑to‑bullish alignment with price above most SMAs)
📌 How to Use These Levels
Bullish scenario:
If HCLTECH sustains above ₹1,650–₹1,660, the next resistance to watch is ₹1,675–₹1,700, and potential testing of recent broader highs.
Bearish scenario:
If it breaks below ₹1,592–₹1,580, short‑term support weakens and price could drift toward ₹1,550–₹1,570.

RELIANCE 1 Week Time Frame 📌 Current Price Snapshot
RELIANCE.NS is trading around ~₹1,507 – ₹1,510 per share on NSE.
📉 Key Weekly Support Levels
These are levels where price may find buying support on pullbacks:
🟩 Support 1: ~₹1,518 – ₹1,520 — near short‑term pivot support zone for the week.
🟩 Support 2: ~₹1,498 – ₹1,500 — next floor if sellers dominate early week.
🟩 Lower Support: ~₹1,479 – ₹1,480 — broader weekly downside reference.
👉 A weekly close above ₹1,518 would suggest short‑term stabilization before potential bounce.
📈 Key Weekly Resistance Levels
Levels where upside may face selling pressure:
🔴 Resistance 1: ~₹1,555 – ₹1,560 — nearest upside hurdle.
🔴 Resistance 2: ~₹1,600 – ₹1,612 — mid‑week challenge zone (~52‑week area).
🔴 Higher Resistance: ~₹1,630 – ₹1,668 — stretch target if bullish momentum picks up.
👉 A weekly close above ~₹1,612–₹1,620 would signal stronger bullish bias and possible follow‑through to higher levels.
📊 Weekly Price Range Estimate
Expected trading corridor for this week:
📉 Downside: ~₹1,498 – ₹1,500
📈 Upside: ~₹1,630 – ₹1,668
This range represents the key support and resistance boundaries traders may watch for breakouts or breakdowns during the week’s sessions.

RAMCOCEM 1 Week Time Frame📌 Current Price (Approx)
~₹1,060 per share (latest trading range) — stock has been trading around this level recently.
📉 1-Week Key Levels (Support & Resistance)
🔹 Support Levels
Support 1: ~₹1,050 — short-term support zone.
Support 2: ~₹1,040–₹1,042 — secondary support.
Support 3: ~₹1,032–₹1,035 — deeper weekly support.
👉 If price closes below ₹1,040 on weekly basis, it may signal short-term weakness.
🔺 Resistance Levels
Resistance 1: ~₹1,068–₹1,070 — first near-term hurdle.
Resistance 2: ~₹1,077–₹1,078 — higher weekly resistance.
Resistance 3: ~₹1,087–₹1,093 — extended resistance zone.
👉 Break above ₹1,070–₹1,078 could open room toward ~₹1,087–₹1,093+ levels this week.
📊 Weekly Price Action Summary
Price has been trading near ~₹1,060 range, making this region a pivotal short-term level.
Short-term oscillators and technical ratings are mixed/neutral to mild buy.
Bullish bias this week if price stays above ₹1,050–₹1,055 and takes out ₹1,070+.
Bearish tilt if price closes below ₹1,040–₹1,050 on a weekly chart.
📍 Summary: 1-Week Levels
Level Type Price Zone
Major Support ₹1,050
Next Support ₹1,040–₹1,042
Lower Support ₹1,032–₹1,035
First Resistance ₹1,068–₹1,070
Higher Resistance ₹1,077–₹1,078
Extended Resistance ₹1,087–₹1,093+

LODHA 1 Week Time Frame 📌 Current Price Snapshot
LODHA is trading around ₹1,055 – ₹1,085 on NSE recently.
📊 Weekly Time Frame Levels (Support & Resistance)
🔹 Key Support Levels (Weekly)
Levels where price may find buying interest this week:
Support 1: ~₹1,063 – ₹1,064 (primary weekly support)
Support 2: ~₹1,060 – ₹1,061 (secondary zone)
Support 3: ~₹1,051 – ₹1,055 (deeper weekly support range)
📌 A decisive weekly close below ~₹1,050 – ₹1,055 could signal further downside momentum.
🔹 Key Resistance Levels (Weekly)
Levels where price may run into supply/selling:
Immediate Resistance / Pivot: ~₹1,077 – ₹1,082
Resistance 1: ~₹1,091 – ₹1,092
Resistance 2: ~₹1,097 – ₹1,100
Higher Resistance: ~₹1,110 + if bullish momentum accelerates
📌 Weekly close above ₹1,090 – ₹1,100 strengthens short‑term bullish bias.
📌 Weekly Trading Context
Bullish Scenario
Break & close above ~₹1,090‑₹1,100 on weekly chart → watch for continuation toward higher resistances.
Bearish Scenario
Breakdown and weekly close below ~₹1,063‑₹1,055 → could open path to deeper support near ~₹1,030‑₹1,020 in extended bearish move.

KALYANKJIL 1 Week Time Frame 📉 1‑Week Price Movement & Technical Snapshot
The share price has fallen by ~4–5% over the last week.
Current quote (around 9–10 Dec 2025) is in the ₹468–473 range.
From its 52‑week high of ₹794.60, the stock is down more than 40%.
Technical‑analysis commentary suggests “bearish momentum” and “mixed signals” — indicating consolidation or possible further downside in the short term.
📊 Fundamentals & Market Context
Recent financials show some strength: the company reported good revenue growth and profitability in recent quarters.
On the valuation side: the stock quotes a high P/E (price-to-earnings) and P/B (price-to-book) compared with some peers — implying expectations are already priced in.
Some analysts as per recent reports have highlighted structural headwinds (like weaker jewellery demand, gold‑price volatility, cautious consumer spending), which may weigh on near‑term performance.

VARROC 1 Day Time Frame 📈 Where VARROC stands now
Recent quotes put VARROC around ₹ 659 – ₹ 692 per share.
On a 1‑day / very short‑term basis, the stock recently showed a jump of ~4‑5%.
The 52‑week range for the stock has been roughly ₹ 374 – ₹ 674–689 — so current levels are near the upper end of that band.
⚠️ What to keep in mind / Risks in 1‑day frame
The stock remains relatively volatile — intraday swings (highs/lows) have been wide in recent sessions.
Short‑term moves may be driven more by news/event‑driven sentiment (like EV contract wins) than by underlying long‑term fundamentals; such moves can reverse quickly if news is not sustained.
✅ My take (for a 1‑day horizon)
If you are looking at a 1‑day trade: VARROC could still have some upside — especially if momentum continues, given recent positive news + technical breakout. But treat it as a high‑risk, high‑reward speculative trade.
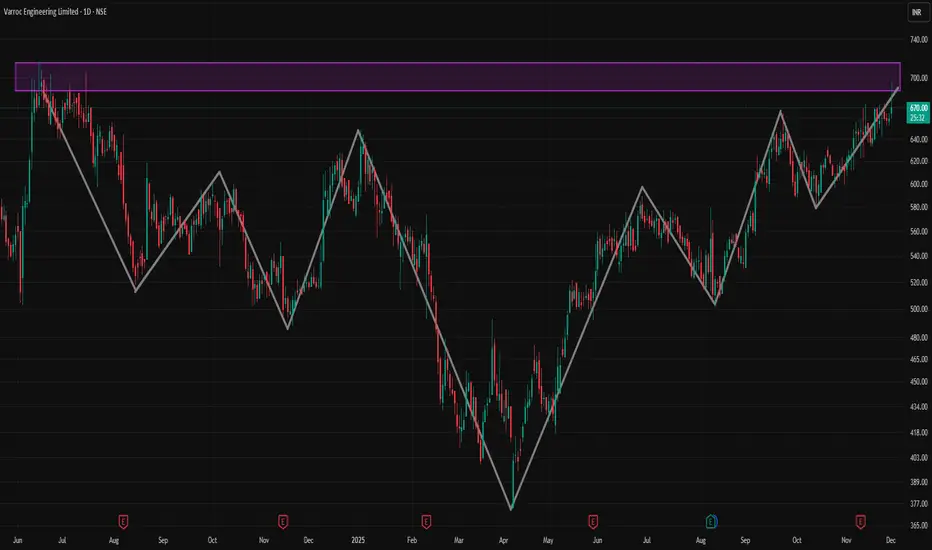
Long term: V bottom / Inverted H&SLong term: V bottom / Inverted H&S
- Stock didn't have strong momentum and had a channel resistance
- Pattern target is yet to reach
- Long term position (3-5 years)
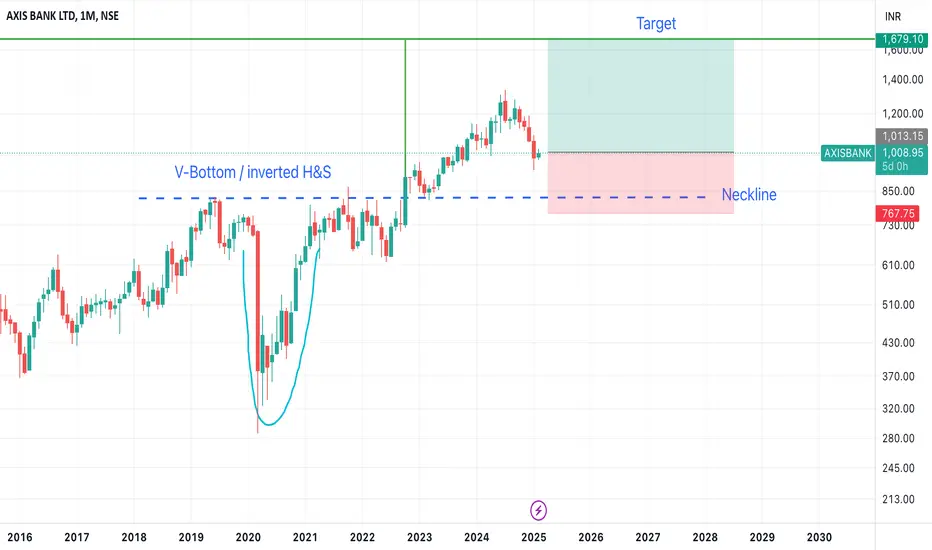
Nifty looking bullish as inverted head and shoulder in formationNifty looking bullish as inverted head and shoulder in formation

one can go long as per your risk appititeone can go long as per your risk appitite
go long and put a sl tight as market is volatile
NSE:KPRMILL


Idea before the Channel break out! Update on Black Rose!BSE:BLACKROSE will breakout of this channel around 29th April if I am precise enough!!!
However if not date, the price Reversal Box shown on the Chart shows high probability of Price correction to exhaust and Bulls rush in lifting the Stock up to the Moon.
Confirmation awaited around Rs148-Rs154 levels.
The predictions and observations are educational and personal views. It doesn't indicate trading advice whatsoever


RAMCO CEMENTS - Short Term positional callRAMCO CEM is in uptrend. The stock had hit levels of 664 earlier and had bounced back. But has been range bound.
The stock and market both have shifted to uptrend so look at a buy opportunity at 641 and sell at around 710 in 7-9 days.
Stop loss at 610
Note - Do your market research carefully, and trade well. This is NOT an investment or trading advice.

bitcoin trend will have change soon.bitcoin trend will have change soon to can drop down. properly i can't say that but i think who we can look the trend line , to after touch then maybe this trend can be down below

HMVL - Long Trade SetupHMVL looks like formed a butterfly harmonic pattern. can test 280 SL below 256.
