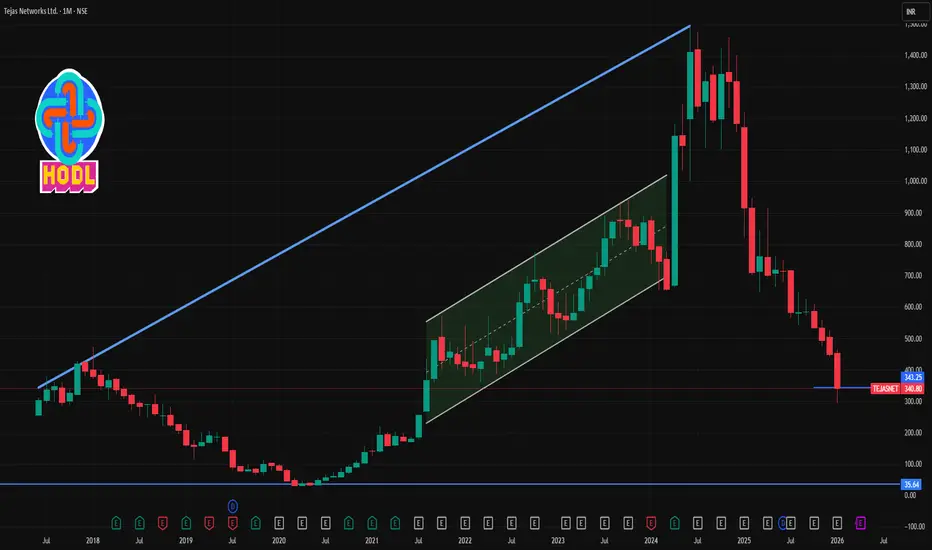
TEJASNET 1 Month Time Frame 📊 Current Price Snapshot (Approx)
Last traded price ~ ₹330-₹345 on NSE/BSE during late Jan 2026, after recent volatility and sell-offs.
📉 1-Month Timeframe — Key Levels
🔻 Support Levels (Downside)
These are levels where the stock could find buyers or pause losses on a 1-month chart:
Support Zone Significance
₹320 – ₹325 Immediate support; recent intraday floor (current price region)
₹301 – ₹315 Secondary support zone from pivot breakdowns
₹285 – ₹300 Deeper support if broader bearish momentum continues
📈 Resistance Levels (Upside)
Resistance Zone Importance
₹355 – ₹360 1st resistance from short-term moving average relevance
₹370 – ₹375 Next resistance cluster near recent intraday reactions
₹390 – ₹395 Higher resistance if bounce gains strength
🧠 Technical Indicator Context (1-Month)
📉 Trend Bias: Bearish overall, price trading significantly below major moving averages (20-day, 50-day, etc.).
📊 RSI: Near oversold but not confirmed bottom — suggests bearish momentum but potential for short-term rebounds.
📉 MACD & STOCH: Bearish signals persist, indicating weak price action on the 1-month chart.
🗂 Summary — 1-Month View
⚠️ Bearish Bias: The stock is in a short-term downtrend, trading below key moving averages and suffering weak momentum.
🛑 Support in Focus: ₹320-₹315 first; further deeper zone near ₹285-₹300 if bears intensify.
📈 Resistance Roadblock: ₹355-₹360 key for initial bounce; stronger rally needs break above ₹370+.
📉 Bearish Technicals: RSI not strongly indicating reversal yet; MACD remains bearish.
Chartanalyse
DIXON 1 Day Time Frame 📊 Current Price Snapshot (Daily)
Latest traded price: ~₹10,300 – ₹10,460 approx on NSE/BSE (mid-day range).
Today’s price range: ₹9,835 (low) – ₹10,843 (high).
52-week range: ₹9,835 – ₹18,471.
Bias: The stock remains below key short-term averages (e.g., 20/50/100-day EMAs), indicating a bearish daily trend until price successfully closes above resistance levels.
📈 Daily Pivot & Technical Levels (1-Day Time Frame)
🔹 Pivot Point (Daily Centre)
• Pivot: ~₹10,276 – ₹10,496 (central reference for today’s bias)
🚧 Resistance Levels (Upside)
1. R1: ~₹10,496 – ₹10,500 (1st resistance zone)
2. R2: ~₹10,656 – ₹10,660 (daily push-back region)
3. R3: ~₹10,876 – ₹10,880 (higher barrier)
👉 A sustained daily close above ~₹10,500–₹10,650 is needed to reduce near-term bearish momentum.
📉 Support Levels (Downside)
1. S1: ~₹10,116 – ₹10,120 (initial support)
2. S2: ~₹9,896 – ₹9,900 (secondary cushion)
3. S3: ~₹9,736 – ₹9,740 (deeper support)
👉 Breach of ₹9,900 and then ₹9,740 could expand downside risk on the daily chart.
💡 Quick Trading Reference — Today
Bullish bias resume only if price closes above:
✔️ ₹10,500 (initial breakout)
✔️ ₹10,650+ (confirmation of relief rally)
Bearish pressure sustained while below these:
⏬ ₹10,116 → first downside target
⏬ ₹9,896 – ₹9,740 → strong support zones

HPCL 1 Month Time Frame 📌 Current Price Reference
HPCL’s share price is around ₹410 – ₹435 in late January 2026.
📊 1‑Month Technical Levels
🔵 Support Levels (Downside)
These are zones where the price historically finds buying interest or could rebound if selling increases:
1. Major Support: ~ ₹449–₹454 — key near‑term support zone (weekly lower support).
2. Secondary Support: ~ ₹460 — if price consolidates above this level, trend may hold.
3. Deeper Support Zone: ~ ₹454–₹449 (extended pullback).
4. Additional Lower Band: Recent pivot around ₹440–₹435 from broader charts (may act short‑term cushion).
➡️ Break below these can signal further downside to the 1‑month range.
🔴 Resistance Levels (Upside)
These are levels where price might face selling pressure or may struggle to sustain gains:
1. Immediate Resistance: ~ ₹478–₹481 — short‑term ceiling.
2. Next Key Barrier: ~ ₹484–₹486 — stronger resistance zone.
3. Stretch/Upper Target: ~ ₹490–₹494 (+) — if momentum continues bullishly.
⚖️ Pivot Reference
Pivot Level: ~ ₹449 — central point indicating bias above this tends mildly bullish, below could favor sellers.

CREDITACC 1 Week Time Frame 📌 Current Price Context (21 Jan 2026)
Approx current price: ~₹1,330 – ₹1,370 on NSE as of recent trading session.
📊 Weekly Technical Levels (1-Week Timeframe)
These levels are derived from recent weekly pivot analysis (reflecting highs/lows and average weekly trend):
Weekly Pivot Point: ~ ₹1,300 – ₹1,305
Weekly Resistance Levels:
R1: ~ ₹1,325 – ₹1,330
R2: ~ ₹1,350 – ₹1,360
R3: ~ ₹1,375+
Weekly Support Levels:
S1: ~ ₹1,275 – ₹1,280
S2: ~ ₹1,250 – ₹1,255
S3: ~ ₹1,225 – ₹1,220
(Classic pivot study — see weekly pivot table)
📈 Short Summary of Weekly Bias
Bullish scenario:
if the price sustains above weekly pivot (~₹1,300) and breaks above R1 (~₹1,330), momentum favors moves toward R2 (~₹1,350-1,360) and possibly R3 (~₹1,375) for the coming week.
Neutral / Range scenario:
Between ₹1,275 to ₹1,330, price tends to oscillate within the weekly range with no clear directional bias — traders watch pivot and R1/S1 zones.
Bearish scenario:
A break below S1 (~₹1,275) increases the risk of deeper probes toward S2 (~₹1,250) or S3 (~₹1,220) on the weekly chart.
📌 How to Use These Levels
1. Short-term traders (swing): Watch catalystsensing breaks above R1/R2 for bullish continuation setups or break below S1/S2 for bearish setups.
2. Position traders: Weekly pivot and 50/100 SMA clusters (around ₹1,300-₹1,340) act as key decision zones for holding or trimming positions.

BEL 1 Month Time Frame📌 Key Levels & Observations
Current price: approximately ₹ 416.35 per share.
Recent range: Daily highs ~₹ 423–424, lows ~₹ 415.50.
52-week high ~₹ 436 and 52-week low ~₹ 240.25.
🎯 Short-Term (1-Month) Important Levels
Support zone: ~₹ 405-410 — falling below this may weaken short-term structure.
Resistance zone: ~₹ 430-435 — breaking above this could open scope toward ₹ 440.
Near-term target range: If bullish momentum holds, look toward ~₹ 430-440.
Risk zone: If momentum falters and the support zone fails, price may drift back toward ~₹ 400 or lower.
⚠️ Caveats
These levels are technical estimates, not fundamental valuations or guarantees.
Market sentiment, order flows (for BEL), defence‐policy changes, etc. can shift the picture quickly.
Always use stop-loss or risk controls.

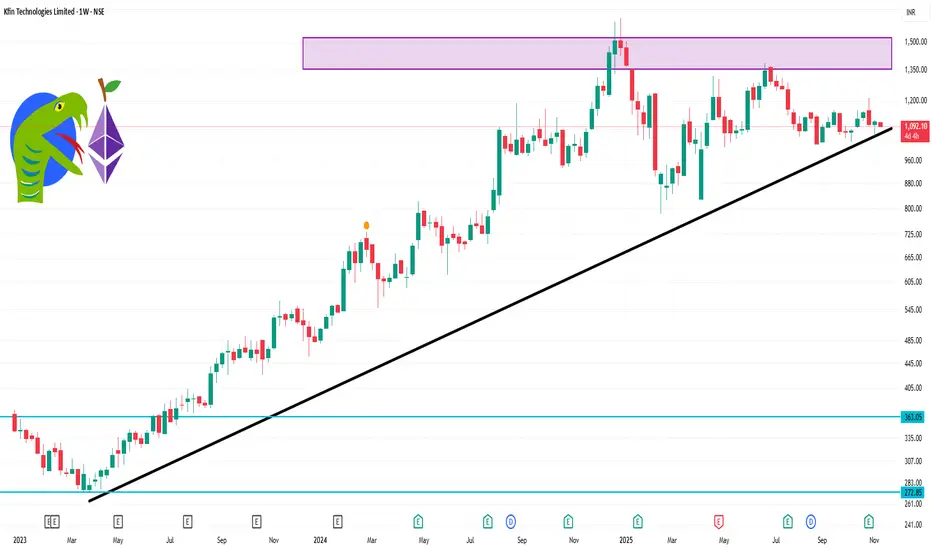
KFINTECH 1 Week Time Frame 🔍 Weekly Structure & Level View
Support zones
Immediate support around ₹1,054-₹1,060 (just under S1).
Deeper support around ₹1,010-₹1,020 (S2 zone).
If broken, next meaningful structural support around ₹930-₹950 (S3).
Also, from Market Screener: mid-term support ~ ₹1,021.20.
Resistance zones
Key pivot resistance around ₹1,134.77.
Short-term upside target / next resistances: ~ ₹1,178-₹1,258.
Medium-term further resistance ~ ~ ₹1,300+ (R3).
From Market Screener: resistance ~ ₹1,174.80 in short term.
Falling Wedge Pattern breakout in ICICIPRULIicici prudential life insurance company
Key highlights: 💡⚡
✅On 1Week Time Frame Stock Showing Breakout of Falling Wedge Pattern.
✅ Strong Bullish Candlestick Form on this timeframe.
✅It can give movement up to the Breakout target of 785+.
✅Can Go Long in this stock by placing a stop loss below 430-.

Double Top pattern in MARICOMARICO LTD
Key highlights: 💡
✅ On 1 Day Time Frame Stock Showing Reversal of Double Top Pattern.
✅ It can give movement upto the Reversal final target of below 545-.
✅ There have chances of breakdown of Support level too.
✅ After breakdown of Support level this stock can gives strong downside rally upto below 505-.

Uptrend Channel Pattern Reversal in BIOCONBIOCON LTD
Key highlights: 💡⚡
📊On 1Day Time Frame Stock Showing Reversal of Uptrend Channel Pattern .
📊 It can give movement upto the Reversal target of Above 280 +.
📊There have chances of Breakout of Resistance level too.
📊 After Breakout of Resistance level this stock can gives strong upside rally upto above 310+.
📊 Can Go Short in this stock by placing stop loss below 240- or last swing Low.

Falling wedge pattern reversal in MAHANAGAR GAS LTDMAHANAGAR GAS LTD
Key highlights: 💡⚡
📈On 1Day Time Frame Stock Showing Reversal of Falling wedge Pattern .
📈 It can give movement upto the Reversal Final target of above 1065+.
📈There have chances of breakout of Resistance level too.
📈 After breakout of Resistance level this stock can gives strong upside rally upto above 1145+.

Bullish flag pattern breakout in LUPINLUPIN LTD
Key highlights: 💡⚡
✅On 1 Hour Time Frame Stock Showing Breakout of Bullish flag Pattern .
✅ Strong Bullish Candlestick Form on this timeframe.
✅It can give movement up to the Breakout target of 875+.
✅Can Go short in this stock by placing a stop loss below 765-.

CONCOR Daily Time Frame AnalysisWelcome your valuable comments on this script
For Short Term Can Buy at Current Cpm
With Stop Loss 560 that is recent Swing Low
For Long Term wait for All Time High Breakout
All Time High Resistance 666
Share Will Strong Bullish Above 730
for Target 1000 to 1100
I am not a SEBI registered adviser. All the information provided by me are for educational/informational purposes only. Never invest more then 2 % Capital In Single trade. Trade on your own Risk and analysis

JSWSTEEL - CMP 266.85 TEchnically looks good for short termTechnically trading at the good demand zone
and should not break 261-256 zone
Technical levels to watching for 270-276-285
