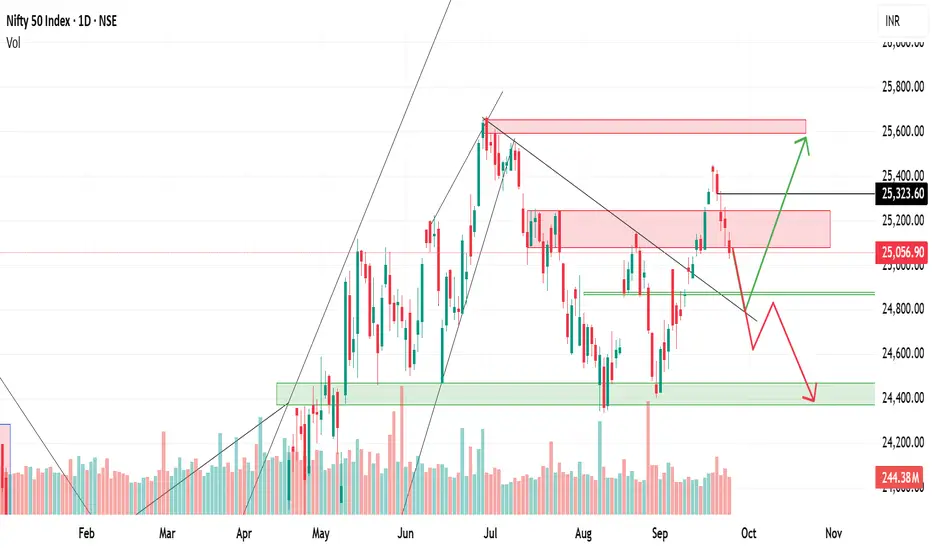
Nifty weak after failed retest – Key supports at 24,900–24,800📉 Nifty Outlook – Breakdown After Failed Retest
Nifty tried to retest the breakout zone of 25,150–25,250, but failed to hold above it. This rejection has shifted the structure towards weakness, and the index may now revisit crucial lower levels.
🔴 Failed Retest – A Bearish Signal
The zone of 25,150–25,250 was earlier acting as a breakout area. A successful retest would have confirmed strength for higher levels. However, Nifty failed to sustain, which indicates that buyers are losing control near this resistance.
📉 Next Support – Trendline Breakout Zone
The immediate support lies in the 24,900–24,800 band, which coincides with the earlier trendline breakout zone. If Nifty can stabilize here, a short-term bounce may still be possible.
⚠️ Deeper Downside Risk
If the 24,900–24,800 zone is broken on the downside, then the structure opens up for a deeper correction. In such a case, levels of 24,500–24,300 become very much possible in the coming sessions.
✅ Summary
Resistance rejected at 25,150–25,250
Weakness likely unless Nifty reclaims this zone
Supports at 24,900–24,800, below which 24,500–24,300 may come into play.
Chartbysachin
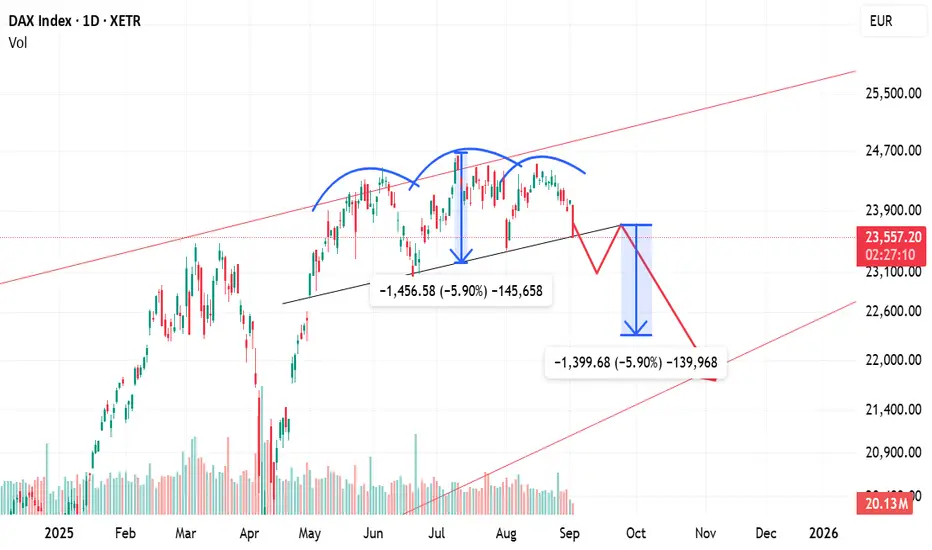
DAX Breaks H&S Pattern – Eyes 22,300–22,200🔎 Chart Setup
DAX has given a breakdown of the Head & Shoulders pattern on the daily chart. This is a strong bearish reversal pattern, usually signaling further downside.
⚖️ Downside Targets
With the breakdown confirmed, the pattern target lies in the 22,300–22,200 zone.
As long as 24,000 (on a closing basis) is not reclaimed, the bearish bias remains intact.
🔄 Retest Scenario
After such breakdowns, it’s common for the index to retest the neckline.
In this case, a pullback up to 23,700 is possible before resuming the downward move.
✅ Summary
DAX has entered a bearish phase after breaking down from the Head & Shoulders pattern. Unless it closes back above 24,000, the path of least resistance remains down toward 22,300–22,200.

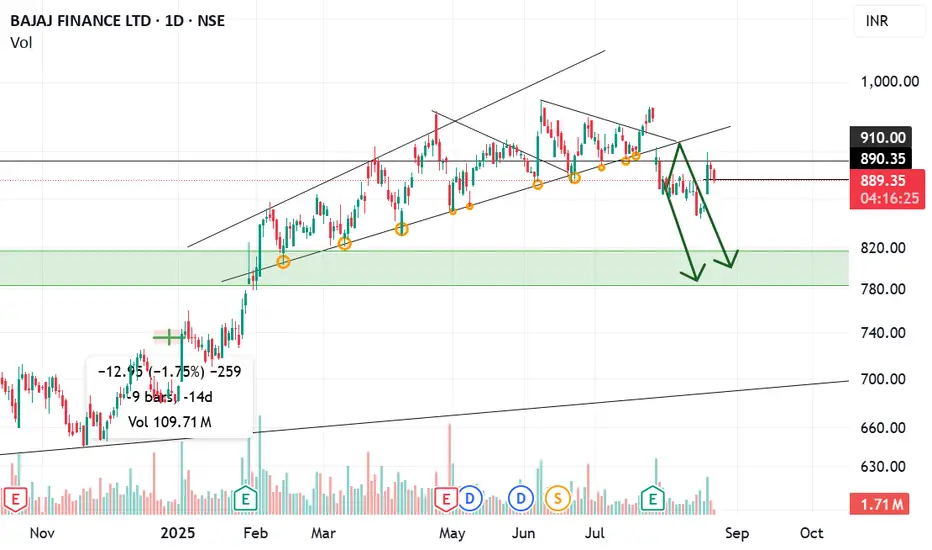
Chart Analysis – Bajaj Finance LtdThe stock was trading inside a rising channel for a long time but eventually broke down from it.
After the breakdown, a retest of the broken support trendline was observed, confirming weakness.
Currently, the price is struggling near the ₹890–₹900 zone, which is acting as a resistance.
The critical support lies around ₹850.
⚠️ If the stock closes below ₹850, it will confirm further bearish momentum.
The next support levels open up towards ₹820–₹800, which is also a strong demand zone (green highlighted area on chart).
📌 Summary:
Unless the stock reclaims and sustains above ₹900, the bias remains weak. A close below ₹850 can accelerate the fall toward ₹820–₹800.
Nifty Eyes 25,500 if Breaks Out; Risk of 24,300 if RejectedNifty bounced strongly from the 24,450–23,350 support zone and is now approaching the 25,100–25,250 resistance band. If it sustains above this level, it will confirm a double bottom pattern and open the path toward 25,500–25,600. However, if Nifty faces rejection at this resistance, it may again slip back to test the 24,400–24,300 zone. A retracement before breaking out is also possible, so next week’s price action will be crucial.
🔹 Bullish Case
Nifty bounced from the strong support zone of 24,450–23,350.
Now trading near the 25,100–25,250 resistance zone.
If it sustains above this band, it confirms a double bottom breakout.
Upside targets will be 25,500–25,600 in the short term.
🔹 Bearish Case
If Nifty fails to cross 25,100–25,250 and faces rejection,
Selling pressure may drag it back toward the 24,400–24,300 support zone.
A breakdown below this could extend weakness further.
🔹 Retracement Scenario
Nifty may first retrace a bit lower from current levels,
Then reattempt the breakout above 25,100–25,250 after retesting.
This would be a healthier breakout with stronger follow-through.
✅ Summary: Next week is crucial — a sustained breakout above 25,250 is bullish, while rejection may send Nifty back toward 24,400–24,300. Retracement before breakout is also possible.

NVDA Breaks Trendline, Eyes $155–150 SupportNVIDIA recently gave a trendline breakdown on the chart, indicating that bullish momentum has weakened. After the breakdown, the stock also retested the broken trendline from below, which is a common technical behavior — often referred to as a breakdown and retest pattern. This confirms that the broken trendline has now turned into a resistance level.
⚖️ Implications
Since the retest failed to reclaim the trendline, selling pressure is likely to continue.
The stock is now vulnerable to further downside and may gradually drift lower.
The immediate support zone lies at $155–150, which coincides with prior demand areas where buying interest previously emerged.
✅ Key Levels
Resistance (Invalidation): The broken trendline — if price reclaims and sustains above it, bearish momentum weakens.
Support: $155–150 zone (short-term target area).
Trend Bias: Bearish as long as the stock trades below the retested trendline.

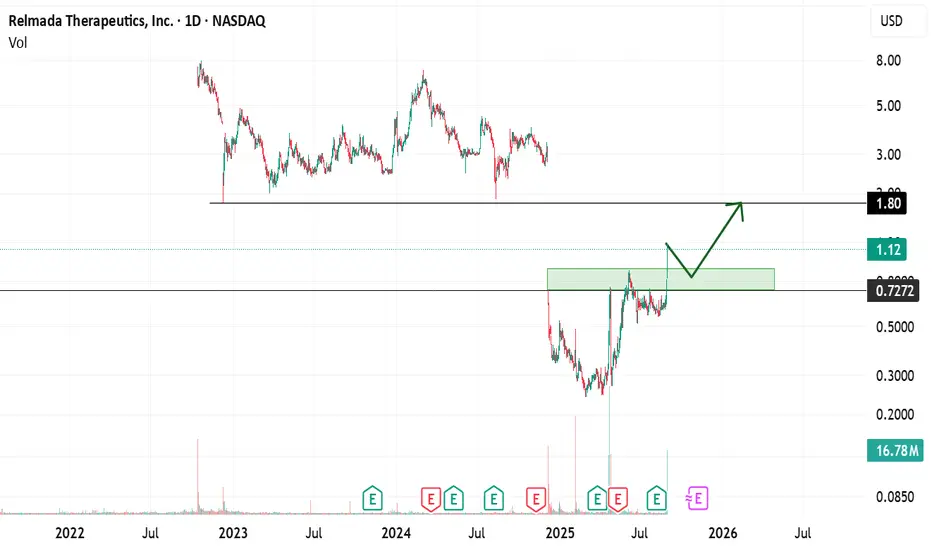
RLMD — Breakout After 10-Month ConsolidationRLMD has finally broken out above its long-standing resistance after nearly 10 months of consolidation. The breakout is supported by good volume, which adds strength and reliability to the move.
🔑 Why This is Significant
Long consolidation: When a stock trades sideways for months, it builds strong accumulation. Once price escapes the range, moves are often sharp and sustained.
Volume confirmation: Breakouts on higher-than-average volume signal real demand, reducing the chances of a false breakout.
Gap to fill: There’s a price gap up to $1.70. Gaps act like magnets — if the breakout holds, price often travels to fill them.
🎯 Levels to Watch
Breakout trigger: $0.70 → needs to sustain trading above this level.
Immediate targets: $1.40 → $1.70 (gap-fill).
Invalidation: A daily close back below $0.70 would signal a failed breakout and likely return to consolidation.
✅ Conclusion
As long as RLMD holds above $0.70, bias stays bullish with a possible gap-fill move toward $1.70. Traders should watch for retests of $0.70 acting as support, along with continued volume confirmation.
Head & Shoulders on DAX Daily Chart – Watch for BreakdownThe DAX index is currently forming a Head and Shoulders pattern on the daily chart, a well-known bearish reversal formation. This pattern typically signals a potential shift in trend from bullish to bearish if the breakdown occurs.
Left Shoulder – Formed when prices peaked, followed by a correction.
Head – A higher peak, marking the top of the uptrend, followed by another decline.
Right Shoulder – A lower high compared to the head, showing weakening bullish momentum.
Neckline – The key support line connecting the lows between the shoulders and the head.
⚖️ Implications
If the DAX breaks below the neckline with strong volume, it will confirm the pattern.
This breakdown could trigger further downward momentum, with potential targets calculated by measuring the distance from the head to the neckline and projecting it downward.
✅ Summary
Pattern: Head & Shoulders (bearish) on daily chart.
Trigger: Breakdown below the neckline.
Outcome: Increased probability of further decline, with downside targets extending to lower support zones.
Bitcoin Analysis – Support Break & Next LevelsBitcoin has broken below its key ascending trendline and also lost the horizontal support around 111k–112k.
The breakdown was followed by a retest of the trendline, which got rejected, confirming the weakness.
🔑 Key Levels to Watch
124,272 → Major resistance (recent swing high).
111k–112k → Broken support, now acting as resistance.
100,407 (~100k)→ Next important support zone to test.
92k–90k (red zone) → Strong demand area if 100k fails.
76,719 → Deeper support if selling continues.
📊 Possible Scenarios
1. Bearish Continuation (Base Case):
Price likely to move toward 100k support. A bounce is possible here, but if Bitcoin closes below 100k on daily timeframe, next downside targets are 96k → 92k–90k.
2. Bullish Invalidation:
If BTC reclaims 112k and sustains above it, short-term bearish outlook weakens.
A break above 120k could reopen the path toward 124k.
✅ Conclusion
Right now, the bias remains bearish below 112k, with 100k as the immediate support to watch. Reaction at 100k will decide whether we see a bounce back to 111k or a deeper correction into the 90k zone.
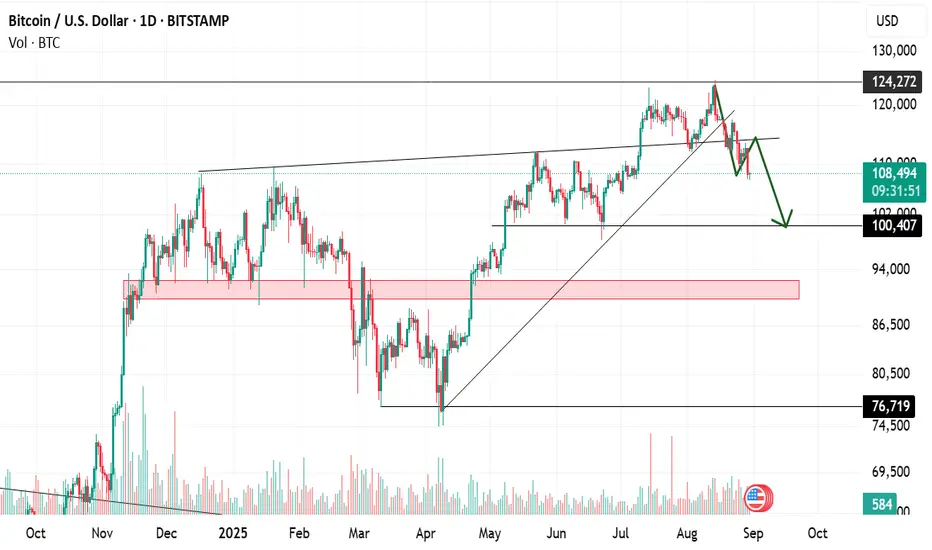
Chart Analysis - Dow Jones (Breaking Important Resistance)The US30 index has successfully broken through an important resistance level today, which is a key technical development. This breakout suggests the potential beginning of a strong bullish trend, provided the index is able to sustain itself above the red zone. If it continues to hold above this zone, buyers will likely remain in control, paving the way for higher upside targets in the coming sessions.
However, if the index fails to stay above this red zone and falls back below it, the breakout will be considered a false breakout, which could lead to renewed selling pressure and possible downside movement. In short, the red zone is the make-or-break level that will decide whether the trend continues upward or reverses.
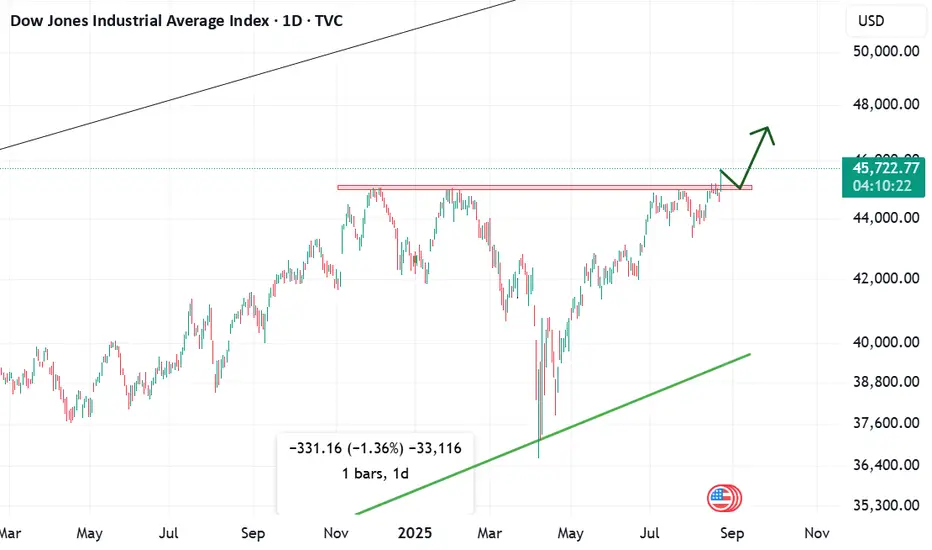
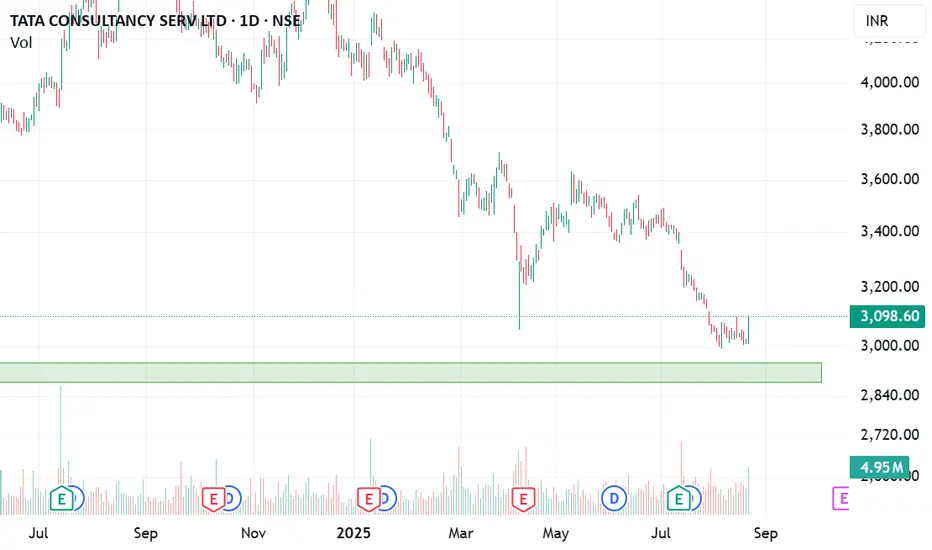
Chart Analysis - TCS1) Weekly support (context)
Price is sitting near a multi-week demand zone (prior swing lows / consolidation base). Weekly supports matter because bigger timeframes filter noise and attract institutional flows.
When price returns to a weekly support and stabilizes, it often transitions from distribution to accumulation.
2) Daily double bottom (pattern)
A double bottom forms when price tests a low, bounces, then retests roughly the same low and rejects it again. That shows buyers defending the level twice.
The neckline is drawn across the swing high between the two lows. A daily close above the neckline confirms the pattern.
3) Volume confirmation
Healthy: rising volume on up-days, especially on the rally from the second bottom and on the neckline breakout. That says demand is active, not just a technical bounce.
4) Risk line (“invalidates below today’s low”)
Your statement “bullish till it holds today’s low” defines a clear invalidity level. If price closes below today’s low, it suggests the second bottom failed—cut risk there.
5) Trade planning (illustrative, not advice)
Entry ideas:
(a) Aggressive: near current price with stop just below today’s low.
(b) Conservative: on a confirmed close above the neckline, or on a pullback/retest to the neckline that holds.
Stops: A few ticks below today’s low (aggressive) or below retest low (conservative).
Management: Scale partial at interim resistance; trail stop under higher lows / 20-EMA on the daily.
6) What would weaken the setup
Weak or declining volume on rallies, repeated rejections at the neckline, or a decisive daily close below today’s low/weekly support.
In short: Weekly support + daily double bottom + volume = constructive. Confirmation comes with a neckline break; invalidation is a close below today’s low.
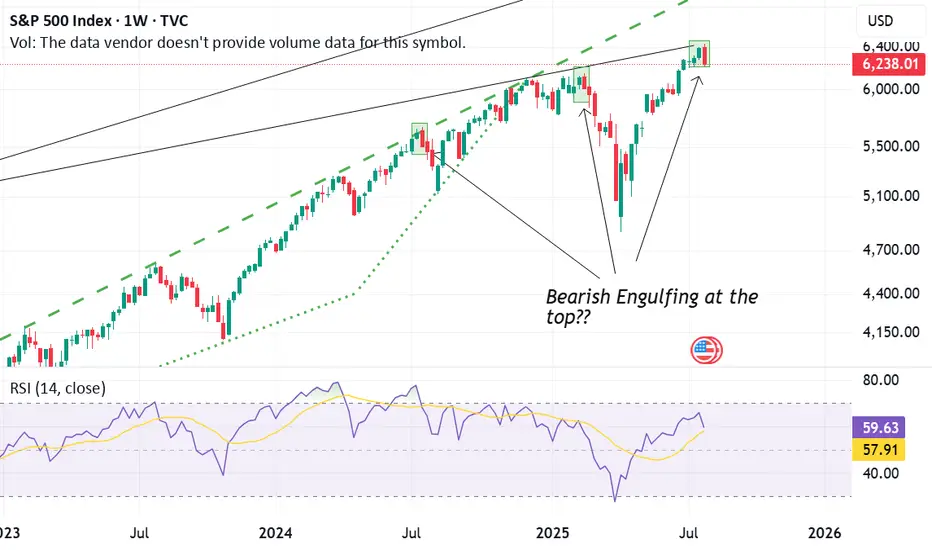
SPX forms a bearish engulfing candle again Last week, the S&P 500 Index (SPX) printed a bearish engulfing candle on the weekly chart. This candlestick pattern occurs when a larger red (bearish) candle completely "engulfs" the body of the previous green (bullish) candle. It is a classic reversal signal, often indicating that the momentum may be shifting from bullish to bearish.
What makes this significant is the recurring pattern we've observed:
At each of the last three market tops, the SPX formed a bearish engulfing pattern—and each time, this was followed by a notable correction or pullback.
The current candle mirrors those past setups almost identically, suggesting that the market may again be vulnerable to a short-term decline.
However, the big question remains:
"Will this time be different?"
In short, the bearish engulfing pattern is a warning sign—especially given its historical reliability at tops—but confirmation is key.
Ask ChatGPT
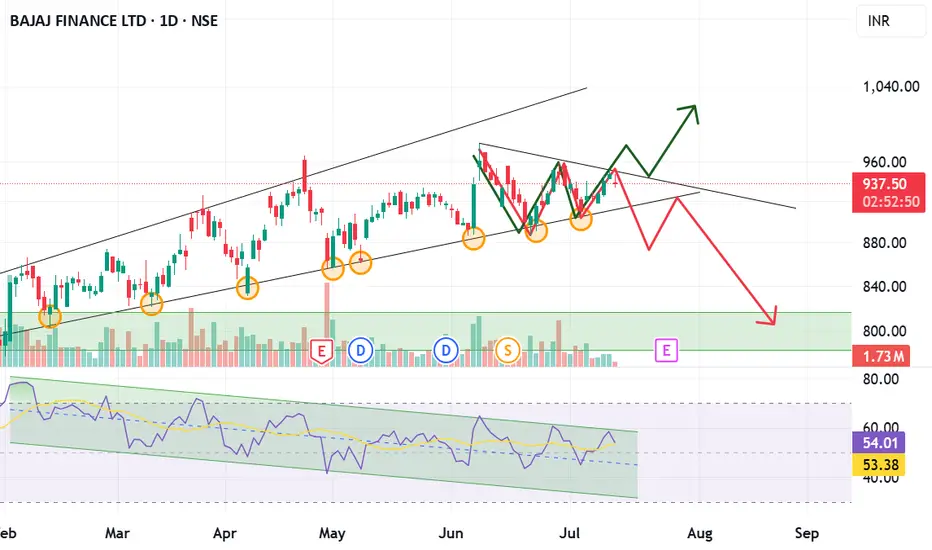
Green or Red Which path Bajaj Finance will take ?Bajaj Finance is currently consolidating, showing potential for a strong move in either direction. A bullish breakout could lead to an uptrend, while a bearish breakdown may signal a decline. The stock is forming a base, and whichever path it takes next may define its trend for the coming weeks.