DIXON 1 Day Time Frame 📊 Current Price Snapshot (Daily)
Latest traded price: ~₹10,300 – ₹10,460 approx on NSE/BSE (mid-day range).
Today’s price range: ₹9,835 (low) – ₹10,843 (high).
52-week range: ₹9,835 – ₹18,471.
Bias: The stock remains below key short-term averages (e.g., 20/50/100-day EMAs), indicating a bearish daily trend until price successfully closes above resistance levels.
📈 Daily Pivot & Technical Levels (1-Day Time Frame)
🔹 Pivot Point (Daily Centre)
• Pivot: ~₹10,276 – ₹10,496 (central reference for today’s bias)
🚧 Resistance Levels (Upside)
1. R1: ~₹10,496 – ₹10,500 (1st resistance zone)
2. R2: ~₹10,656 – ₹10,660 (daily push-back region)
3. R3: ~₹10,876 – ₹10,880 (higher barrier)
👉 A sustained daily close above ~₹10,500–₹10,650 is needed to reduce near-term bearish momentum.
📉 Support Levels (Downside)
1. S1: ~₹10,116 – ₹10,120 (initial support)
2. S2: ~₹9,896 – ₹9,900 (secondary cushion)
3. S3: ~₹9,736 – ₹9,740 (deeper support)
👉 Breach of ₹9,900 and then ₹9,740 could expand downside risk on the daily chart.
💡 Quick Trading Reference — Today
Bullish bias resume only if price closes above:
✔️ ₹10,500 (initial breakout)
✔️ ₹10,650+ (confirmation of relief rally)
Bearish pressure sustained while below these:
⏬ ₹10,116 → first downside target
⏬ ₹9,896 – ₹9,740 → strong support zones
Chartdigger

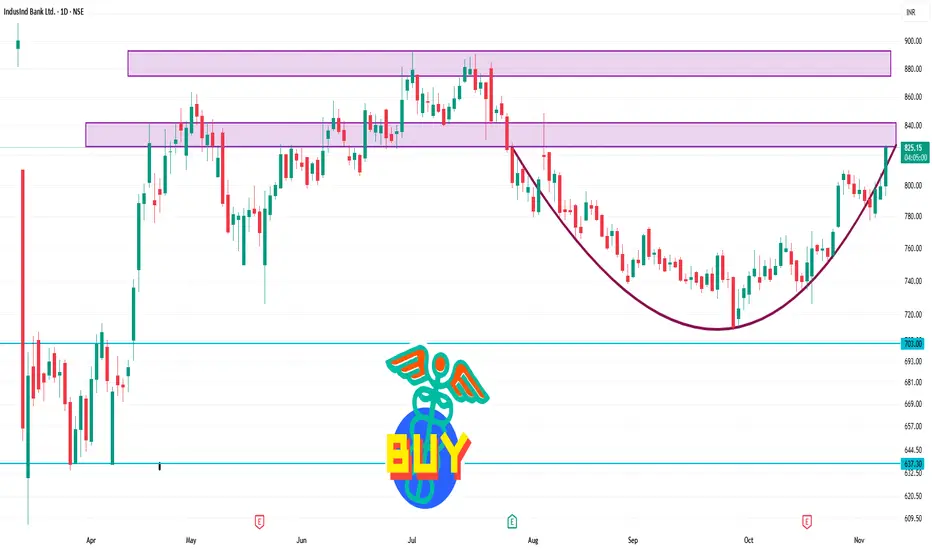
INDUSINDBK 1 Day Time Frame Level 🔍 Current snapshot
Latest live price: ~ ₹825.00.
Today’s approximate range: Low ~ ₹792.80, High ~ ₹826.00.
52-week range: Low ~ ₹606.00, High ~ ₹1,086.55.
📈 Key support & resistance levels
Support zone: ~ ₹790-₹800 — because price has held above ~₹792 today and that region shows earlier low of day.
Immediate resistance: ~ ₹825-₹830 — since the current price is around ₹825; breaking above that may open up.
Stronger resistance: ~ ₹850+ — if momentum builds, aim toward next psychological level.
Deeper support: if price falls below ₹790, next meaningful support could be ~ ₹760-₹770 (not precisely calculated but logical given range).