HINDCOPPER: Trendline and Triangle Breakout, Chart of the MonthWhy This NSE:HINDCOPPER Chart Could Signal India's Next Major Commodity Play, even after giving such a robust run so far. Let's Understand in the "Chart of The Month"
As per the Latest SEBI Mandate, this isn't a Trading/Investment RECOMMENDATION nor for Educational Purposes; it is just for Informational purposes only. The chart data used is 3 Months old, as Showing Live Chart Data is not allowed according to the New SEBI Mandate.
Disclaimer: "I am not a SEBI REGISTERED RESEARCH ANALYST AND INVESTMENT ADVISER."
This analysis is intended solely for informational purposes and should not be interpreted as financial advice. It is advisable to consult a qualified financial advisor or conduct thorough research before making investment decisions.
Price Action Analysis:
Long-Term Trend Structure:
- Historical Peak and Correction: The stock witnessed a spectacular rally in early 2010, reaching an all-time high of ₹658, marking its glory days during the global commodity super-cycle. This was followed by a brutal multi-year correction that took the stock down approximately 90% to levels near ₹55 by 2013.
- Extended Consolidation Phase (2013-2020): After the sharp decline, the stock entered a prolonged seven-year consolidation phase, oscillating between ₹40 and ₹90, building a massive base structure. This extended sideways movement allowed weak hands to exit and created a solid accumulation zone.
- The 2020-2023 Recovery Rally: Post-COVID recovery and commodity reflation themes triggered a strong upward movement from pandemic lows around ₹30-40 to the ₹90-120 range, marking the beginning of a structural reversal.
- Triangle Breakout Formation: The chart clearly displays a large ascending triangle pattern formed between 2020 and 2025, with the stock making higher lows while testing resistance near the ₹420-450 zone multiple times. The recent price action shows a decisive breakout above this multi-year resistance.
Current Price Action:
- Breakout and Retest: The stock has broken out from the ascending triangle pattern and is currently trading around ₹475.60 (as of December 27, 2025), showing a gain of approximately 45% from its recent breakout point.
- Intraday Movement: Current session shows strong volatility with an intraday high of ₹480.85 and a low of ₹443.25, indicating active participation from both bulls and bears near record levels.
- Short-Term Performance: The stock has surged over 75% in calendar year 2025 and has gained approximately 74.8% in the last six months, significantly outperforming the broader Nifty 50 index, which is up only 10.83% year-to-date.
Volume Spread Analysis:
- Volume Surge: The volume panel shows exceptional activity in recent sessions, with December 27 recording 494.78 million shares traded versus the 20-day average of 166.43 million shares, representing nearly 3x the normal volume. This indicates strong institutional and retail interest.
- Second Best Volume in History: Recent sessions have recorded the second-highest volume in the stock's trading history, suggesting a major accumulation or distribution phase.
- Volume Confirmation: The breakout from the triangle pattern is accompanied by robust volume expansion, which validates the move and reduces the probability of a false breakout.
Key Technical Levels:
Support Zones:
- Immediate Support: ₹415-420 zone, which represents the upper boundary of the recently broken triangle pattern. This level previously acted as resistance and should now provide support on any pullback.
- Secondary Support: ₹380-390 range, coinciding with the previous swing high from mid-2024.
- Major Support Base: ₹300-320 zone, which served as a strong consolidation area during the triangle formation phase. This represents a critical support level for the medium-term uptrend.
- Long-Term Base: ₹200-220 area, which marks the ascending trendline of the triangle pattern and would be a key level to watch in case of a deeper correction.
Resistance Zones:
- Immediate Resistance: ₹480-490 zone, representing the current all-time high region for this rally phase.
- Psychological Barrier: ₹500 level, a round number that often acts as psychological resistance.
- Historical Peak: ₹658 (all-time high from 2010), which remains the ultimate resistance target. However, adjusting for inflation and changed market conditions, this level may need to be recalculated.
Base Formation:
- Multi-Year Base (2020-2024): The stock carved out a large accumulation base between ₹150 and ₹450 over approximately four years, characterised by higher lows and repeated tests of the ₹400-420 resistance zone.
- Base Depth and Width: The base shows a well-structured pattern with good width (4+ years) and reasonable depth, which typically precedes significant upward moves.
Technical Patterns:
Ascending Triangle Pattern:
- Formation: Clear ascending triangle pattern visible from 2022 to 2025 with a flat top around ₹420-450 and rising bottoms connecting approximately ₹200 to ₹380.
- Breakout: Decisive breakout occurred in late 2024/early 2025 with strong volume confirmation.
Symmetrical Triangle:
- The cyan-colored triangle marked on the chart shows a shorter-term symmetrical compression pattern forming during 2024-2025, which has also been broken to the upside.
- This pattern suggests continuation of the bullish momentum with potential targets in the ₹500-550 range in the near term.
Higher Highs and Higher Lows:
- Since the 2020 bottom, the stock has consistently printed higher highs and higher lows, establishing a clear uptrend structure across multiple timeframes.
- Each correction has found support at progressively higher levels, indicating strong underlying demand.
Sectoral Backdrop:
Global Copper Market Dynamics:
- Supply-Demand Imbalance: The global copper market is sliding into a deficit, with the International Copper Study Group expecting a refined copper shortfall of around 150,000 tonnes in 2026, reversing previous surplus forecasts.
- Production Challenges: UBS forecasts deficits of 230,000 tonnes in 2025 and more than 400,000 tonnes in 2026 as mine disruptions in Chile, Peru and Indonesia collide with rising demand.
- Price Rally: International copper prices have surged approximately 36% year-to-date, reaching near-record levels above $12,000 per tonne on the LME, driven by tight supply and robust demand.
Structural Demand Drivers:
- AI and Data Centres: Data centres are estimated to need around 1.1 million tonnes of copper annually by 2030, close to 3% of global demand, representing a massive new source of inelastic demand.
- Electric Vehicles: Copper demand from the EV sector is projected to climb from 1.7 million tonnes per annum today to 4.3 million tonnes by 2035, growing at an annual rate of 10%.
- Energy Transition: The shift to renewable energy systems will require an additional 2 million tonnes of copper supply over the next decade, according to Wood Mackenzie research.
- Emerging Market Growth: India and Southeast Asia are expected to add 3.3 million tonnes of demand by 2035, translating to average annual growth rates of 7.8% and 8.2% respectively.
India-Specific Dynamics:
- Strategic Positioning: India is expected to surpass the United States as the world's third-largest copper consumer by 2050, reflecting rapid industrialisation and infrastructure development.
- Import Dependence: India currently imports a significant portion of its copper requirements, making domestic producers like Hindustan Copper strategically important.
- Government Focus: Copper has been included in the US Critical Minerals list, and similar designations globally highlight its strategic importance for economic and national security.
Fundamental Backdrop:
Company Overview:
- Monopoly Position: Hindustan Copper is the only Indian company mining copper and owns all the operating mining leases of copper ore in India, having access to about 45% of India's copper ore reserves and resources as of FY25.
- Vertical Integration: The company is India's sole vertically integrated copper producer, with operations spanning mining, ore beneficiation, smelting, refining, and rod extrusion.
- Government Backing: HCL is a Miniratna Category-I Central Public Sector Enterprise under the Ministry of Mines, providing it with government support and strategic importance.
Production and Operations:
- Production Capacity: Hindustan Copper produced approximately 537,000 tonnes of copper in the financial year 2025, outperforming private sector peers.
- Resource Base: The company holds resources and reserves of 755.32 million tonnes estimated as of April 1, 2024.
- Operational Units: HCL operates mines at Malanjkhand (Madhya Pradesh), Khetri (Rajasthan), and the Indian Copper Complex at Ghatsila (Jharkhand), along with smelting and refining facilities.
Recent Financial Performance:
- Strong Growth: Hindustan Copper reported a 39.1% quarter-on-quarter increase in consolidated revenues for Q2 FY 2025-26, with year-on-year growth of 38.5%.
- Profitability: Net profit increased 38.5% QoQ and 83% YoY in Q2 FY26, demonstrating strong operational leverage.
- Debt Reduction: The company has significantly reduced its debt burden, improving financial health and flexibility for expansion projects.
Strategic Initiatives:
- Revival of Rakha Mine: The company successfully executed a mining lease deed for the strategically important Rakha Mine in September 2024, which should boost future copper output.
- International Collaboration: HCL signed an MoU with CODELCO, Chile's state-owned copper mining giant, in April 2025 to exchange expertise and enhance capabilities in mineral exploration and processing.
- Expansion Plans: An MoU with NTPC Mining Ltd was signed in December 2025 to jointly pursue copper and critical minerals block auctions, indicating an aggressive expansion strategy.
- State-Level Partnerships: MoU signed with Madhya Pradesh State Mining Corporation for exploration of critical minerals, including copper, in the state.
Valuation Metrics:
- PE Ratio: The stock trades at a trailing PE of approximately 80x, which is elevated but reflects its monopoly position and growth expectations.
- Market Capitalisation: As of December 27, 2025, the company's market cap stands at approximately ₹42,992 crore.
Key Developments:
- LIC Stake Sale: Life Insurance Corporation of India reduced its stake from 6.086% to 4.072% through open market sales between August 2024 and December 2025, representing a booking of profits after the strong rally.
Risk Factors:
Technical Risks:
- Overextension: The stock has rallied 75% year-to-date and is trading well above its intrinsic value estimates, suggesting vulnerability to profit-booking.
- Resistance Ahead: The stock is approaching psychological resistance at ₹500 and faces uncertain price discovery beyond current levels.
- Volume Concerns: Extremely high volumes could indicate climactic buying, which sometimes precedes consolidation or correction phases.
Fundamental Risks:
- Commodity Price Volatility: As a pure-play copper producer, the company is susceptible to international copper price fluctuations.
- Production Constraints: Several of the company's smelting and refining facilities have remained suspended since 2019, limiting downstream value addition.
- Operational Efficiency: The company currently sells copper concentrate rather than finished products from some facilities, reducing margins.
- Execution Risk: Ambitious expansion plans through auctions and partnerships carry execution and capital deployment risks.
Market Risks:
- Valuation Multiple Compression: At current elevated valuations, any disappointment in earnings growth or copper prices could trigger sharp corrections.
- Global Economic Slowdown: Recession fears or China slowdown could impact copper demand despite structural growth drivers.
- Supply Response: Higher prices may eventually incentivise new supply additions globally, potentially easing the deficit.
Bull Case:
- India's Only Copper Miner: Monopoly position in copper ore mining provides strategic moat and pricing power.
- Structural Demand Drivers: AI, EVs, renewable energy, and India's industrialisation create multi-year demand tailwinds.
- Supply Deficit: Global copper market moving into deficit with limited near-term supply additions supporting prices.
- Operational Leverage: Fixed cost base means higher copper prices flow directly to the bottom line.
- Strategic Importance: Government backing and critical mineral status provide support for expansion.
Bear Case:
- Extreme Valuation: Trading at a 257% premium to intrinsic value leaves little room for error.
- Production Limitations: Suspended facilities and the concentrate sales model limit revenue potential.
- Execution Uncertainty: New projects through auctions are years away from production.
- Commodity Cyclicality: Copper prices could correct sharply if macro conditions deteriorate.
- Institutional Profit-Booking: LIC stake reduction signals some smart money taking profits.
My 2 Cents:
NSE:HINDCOPPER is at a critical juncture, benefiting from a rare combination of technical breakout, commodity super-cycle dynamics, and structural demand shifts driven by AI and electrification. But at these elevated valuations, be cautious and have disciplined risk management.
Full Coverage on my Mid-Week Newsletter coming Wednesday.
Keep in the Watchlist and DOYR.
NO RECO. For Buy/Sell.
📌Thank you for exploring my idea! I hope you found it valuable.
🙏FOLLOW for more
👍BOOST if you found it useful.
✍️COMMENT below with your views.
Meanwhile, check out my other stock ideas on the right side until this trade is activated. I would love your feedback.
As per the Latest SEBI Mandate, this isn't a Trading/Investment RECOMMENDATION nor for Educational Purposes; it is just for Informational purposes only. The chart data used is 3 Months old, as Showing Live Chart Data is not allowed according to the New SEBI Mandate.
Disclaimer: "I am not a SEBI REGISTERED RESEARCH ANALYST AND INVESTMENT ADVISER."
This analysis is intended solely for informational purposes and should not be interpreted as financial advice. It is advisable to consult a qualified financial advisor or conduct thorough research before making investment decisions.
Chartofthemonth

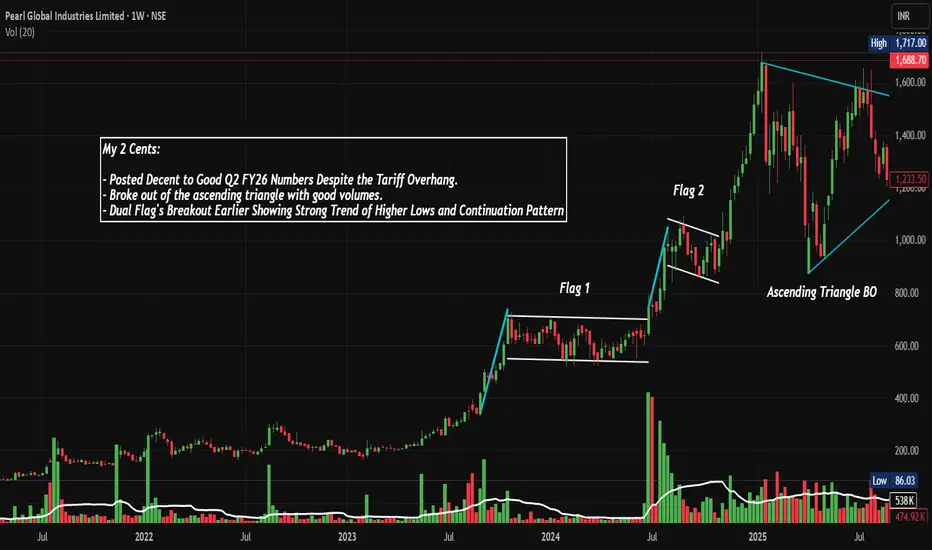
PGIL: Dual Flags and Asce. Triangle Breakout, Chart of the MonthFrom Dual Flags to Triangle Breakouts: How NSE:PGIL Spun a 10x Return Story While Tackling Global Tariff Headwinds and Posting Strong Q2 FY26 Numbers. Lets Analyse in Chart of the Month.
As per the Latest SEBI Mandate, this isn't a Trading/Investment RECOMMENDATION nor for Educational Purposes; it is just for Informational purposes only. The chart data used is 3 Months old, as Showing Live Chart Data is not allowed according to the New SEBI Mandate.
Disclaimer: "I am not a SEBI REGISTERED RESEARCH ANALYST AND INVESTMENT ADVISER."
This analysis is intended solely for informational purposes and should not be interpreted as financial advice. It is advisable to consult a qualified financial advisor or conduct thorough research before making investment decisions.
Price Action Analysis:
Long-Term Trend Structure (2022-2025):
- The stock has demonstrated a phenomenal structural uptrend from its base near Rs 142 in early 2022, currently trading at Rs 1,688.70 (as of Nov 29, 2025)
- This represents an impressive gain of approximately 1,090% from its low, showcasing one of the most powerful trends in the apparel sector
- The weekly chart shows a consistent pattern of higher highs and higher lows, indicating strong bullish conviction and accumulation throughout the multi-year uptrend
Base Formation & Consolidation Zones:
- Primary Base (2022-2023): Stock formed a strong accumulation base between Rs 142-200 for nearly 12 months, which provided the launching pad for the subsequent rally
- First Consolidation Zone (Mid-2024): After the initial rally to around Rs 800, the stock consolidated between Rs 600-800 for approximately 5-6 months, forming Flag Pattern 1
- Second Consolidation Zone (2025): Following the breakout above Rs 1,000, another consolidation formed between Rs 1,200-1,600, creating Flag Pattern 2
Key Technical Patterns Identified:
Ascending Triangle Breakout (Current):
- The most recent pattern visible on the weekly chart is a well-defined ascending triangle with a flat resistance at Rs 1,600 and rising support trendline
- The breakout occurred with substantial volume above Rs 1,600, confirming the pattern's validity
- The breakout candle shows strong momentum with a nearly 20% move to Rs 1,688.70
Dual Bull Flag Patterns:
- Flag 1 (Mid-2024): The first consolidation after the initial rally formed a classic bull flag, which broke out strongly with volumes
- Flag 2 (Early-Mid 2025): Second flag pattern formed after another leg up, again breaking out with conviction
- Both flags demonstrated textbook continuation patterns, indicating strong underlying trend
Higher Lows Pattern:
- Throughout the entire uptrend from 2022, the stock has maintained a pristine pattern of higher swing lows
- Each pullback has been bought aggressively, indicating strong institutional accumulation
- The ascending trendline connecting these lows (cyan line on chart) has acted as dynamic support multiple times
Current Price Action Characteristics:
- Stock closed at Rs 1,688.70 on Nov 29, 2025, down Rs 53.30 (-3.06%) but still near its 52-week high of Rs 1,993.30
- The recent correction from the high represents a healthy pullback of approximately 15%, which is normal after such a massive rally
- Price is currently testing the upper boundary of the ascending triangle, which could now act as support
- The stock has shown tendency to gap up on positive news, indicating strong institutional interest
Volume Spread Analysis:
Volume Characteristics During Key Phases:
Accumulation Phase (2022-Early 2023):
- Average volumes during base formation were around 100K-200K shares
- Volume picked up noticeably during breakout attempts, showing institutional interest
Breakout Phases:
- Flag 1 Breakout: Volume spiked to approximately 300K+ during the breakout
- Flag 2 Breakout: Even higher volume expansion to 400K+ confirmed the breakout
- Ascending Triangle Breakout: Massive volume spike to 870.68K (current volume), the highest seen on the chart
Volume-Price Relationship:
- Classic volume expansion on price advances and contraction during pullbacks, confirming healthy trend
- The recent volume spike of 870.68K represents approximately 4-5x the average daily volume, indicating strong institutional participation
- Volume spikes have consistently occurred at breakout points, validating the technical patterns
- Current volume profile suggests continued institutional accumulation at higher levels
Volume Analysis of Recent Rally:
- The breakout above Rs 1,600 came with exceptional volume (870.68K), suggesting conviction behind the move
- Even during minor pullbacks, volume has remained above average, indicating that dips are being bought
- The volume signature suggests this is not a retail-driven rally but has strong institutional backing
Key Support and Resistance Levels:
Historical Support Zones:
- Primary Base Support: Rs 142-200 (2022 lows) - This is the ultimate support if the entire uptrend were to reverse
- First Major Support: Rs 600-700 zone - This was the previous consolidation area and breakout base
- Second Major Support: Rs 1,000-1,200 - Previous resistance turned support after Flag 2 breakout
- Immediate Support: Rs 1,400-1,500 - Lower boundary of the ascending triangle and recent consolidation
Dynamic Support:
- Ascending Trendline Support (Cyan Line): Currently around Rs 1,200-1,300 level
- This trendline has been respected multiple times since 2022 and represents the spine of the uptrend
Resistance Levels:
- Immediate Resistance: Rs 1,700-1,750 - Recent high zone before pullback
- Major Resistance: Rs 1,993.30 - 52-week high and all-time high
- Psychological Resistance: Rs 2,000 - Round number resistance
Key Price Zones to Watch:
Critical Zone Rs 1,400-1,600:
- This is the most critical support zone as it represents the breakout level from the ascending triangle
- A sustained break below Rs 1,400 would negate the current bullish setup
- As long as the stock holds above Rs 1,500, the structure remains intact
Breakout Zone Rs 1,600-1,700:
- This was the apex of the ascending triangle
- Now acts as a pivot zone - support on the way up, resistance on any further dips
Technical Pattern Analysis:
Ascending Triangle Pattern (Most Recent):
Pattern Characteristics:
- Formed over 6-7 months from mid-2024 to late 2025
- Flat top at Rs 1,600 and ascending bottom trendline
- Minimum of 3 touches on the flat resistance and 2 touches on the ascending support
- Breakout confirmed with massive volume spike
Bull Flag Patterns:
Flag 1 (Mid-2024):
- Pole: Vertical rally from Rs 400 to Rs 800 (100% gain)
- Flag: Consolidation between Rs 600-800 for 4-5 months
- Breakout: Strong move above Rs 800 with volume
- Target achievement: Target of Rs 1,000+ was achieved
Flag 2 (Early 2025):
- Pole: Rally from Rs 800 to Rs 1,200 (50% gain)
- Flag: Tight consolidation between Rs 1,100-1,300
- Breakout: Decisive move above Rs 1,300
- Target achievement: Target of Rs 1,500-1,600 was achieved
Higher Lows Progression:
- Each swing low since 2022 has been progressively higher, indicating sustained demand
- The lows have occurred at: ~Rs 150 (2022), ~Rs 400 (2023), ~Rs 650 (2024), ~Rs 1,200 (2025)
- This creates a powerful ascending trendline that has defined the entire bull market
- The consistency of this pattern suggests strong hands are accumulating on every dip
Continuation Pattern Sequence:
- The chart displays a textbook example of a trending market with continuation patterns
- Pattern sequence: Base → Rally → Flag 1 → Rally → Flag 2 → Rally → Triangle → Breakout
- Each consolidation has been briefer than the previous one, indicating acceleration of the trend
- The pattern suggests the stock is in a mature but still healthy uptrend
Technical Indicators & Market Context:
Trend Strength Assessment:
- The multi-year trend structure is exceptionally strong with clean, well-defined patterns
- The stock has demonstrated the ability to digest gains through healthy consolidations rather than sharp corrections
- The ascending trendline has not been violated once in nearly 3 years, showing remarkable consistency
- Momentum appears to be building rather than waning, as evidenced by the most recent volume spike
Stage of Trend Analysis:
Based on the Stan Weinstein Stage Analysis:
- The stock appears to be in Stage 2 (Advancing Phase) of the market cycle
- It has completed approximately 3-4 years of Stage 2, which can last 5-7 years in strong bull markets
- The pattern of consolidation and continuation suggests the trend is mature but not exhausted
- No signs of Stage 3 (Top Formation) yet, as there are no lower highs or distribution patterns
Sectoral Backdrop:
Indian Textile & Apparel Industry Overview:
Market Size and Growth:
- The domestic textile and apparel market is valued at $225 billion in 2025 and is growing at 10-12% CAGR
- The Indian textile and apparel market reached $222.08 billion in 2024 and is expected to reach $646.96 billion with a CAGR of 11.98% during 2025-2033
- The textile industry employs over 45 million people and produces approximately 22,000 million pieces of garments annually
Export Strength:
- India's textile exports currently stand at $35.14 billion with a target of reaching $100 billion by 2030
- In FY26 (April-June 2025), total exports of textiles and apparels stood at $9.40 billion, with Ready Made Garments having the largest share at 45%
- India ranks among the top five global exporters in several textile categories
Government Support & Policy Framework:
Key Initiatives:
- The government launched the PM MITRA Park Scheme with an outlay of Rs 4,445 crore to create integrated textiles value chain from spinning to manufacturing at a single location
- Union Budget 2025-26 increased allocation to the Textile Ministry from Rs 4,417.03 crore in 2024-25 to Rs 5,272 crore, registering a 19% increase
- Production-Linked Incentive (PLI) Scheme for promoting MMF fabrics and technical textiles
- A five-year Cotton Mission launched with an allocation of Rs 600 crore aimed at revitalizing India's cotton sector
Infrastructure Development:
- Government plans to set up 12 new industrial parks and 5-6 mega textile parks
- 276 operational Special Economic Zones (SEZs) across various textile sectors as of March 2025
- Technology Upgradation Fund Scheme (TUFS) providing financial assistance for modernization
Industry Trends & Opportunities:
Technological Advancement:
- Manufacturers are turning to automation, AI and IoT-connected machinery, and digital fabric printing to increase production
- Digital textile printing is growing over 10% annually, driven by e-commerce and fast fashion
- Smart textiles and technical textiles emerging as high-growth segments
E-commerce Boom:
- The e-commerce industry in India is estimated to reach close to $160 billion in 2025, with apparel/textiles constituting a large part
- Online platforms have opened market access for traditional textile players and D2C brands
- E-commerce has backed unique segments like athleisure, fusion wear, and sustainable fashion
Sustainability Focus:
- Growing demand for eco-friendly and sustainable textiles
- Adoption of organic cotton, recycled materials, and eco-friendly manufacturing processes
- Consumers increasingly conscious of environmental impact of textile production
Global Supply Chain Dynamics:
China+1 Strategy:
- Buyers are seeking alternatives to China and Bangladesh through changes in global supply chains
- Trade agreements like India-UK FTA opening new opportunities
- India positioned to capture increased global apparel sourcing demand
Market Diversification:
- Reduced dependence on single markets
- Growing demand from US, UK, Europe, Japan, and Australia
- Expansion opportunities in emerging markets
Fundamental Backdrop:
Business Overview:
Core Business:
- Pearl Global Industries is engaged in manufacturing, sourcing, distribution, and export of ready-to-wear apparel through domestic and global facilities
- The company provides end-to-end supply chain solutions to brands across the globe
- Product range includes tops, shirts, dresses, sleepwear, hoodies, activewear, athleisure, children's wear, workwear, and denim apparels
Global Manufacturing Footprint:
- Geographical segments include Bangladesh, Hong Kong, India, Vietnam, and Others
- The company is one of India's largest listed garment exporters, manufacturing from multiple sourcing regions: South Asia (India, Bangladesh), South-East Asia (Vietnam, Indonesia) and Central America (Guatemala)
- 25 manufacturing units with total annual production capacity of 93.2 million pieces
Key Clientele:
- Global clientele includes Chicos, Kohls, Muji, Old Navy, Poligono, Primark, PVH, Ralph Lauren, Target and other marquee names
- Serving global brands such as Gap, Zara, Muji and Ralph Lauren
Recent Financial Performance (Q2 FY26):
Revenue Growth:
- In Q2 FY26, the company reported revenue of Rs 1,313 crore, up 9.2% YoY
- In H1 FY26, revenue reached Rs 2,541 crore, marking a 12.7% YoY growth
- Revenue growth driven by high value-added product sales in Vietnam and Indonesia
Profitability Metrics:
- Adjusted EBITDA (excluding ESOP expenses) stood at Rs 122 crore, a 23.6% YoY rise in Q2 FY26
- EBITDA margin increased by 108 bps to 9.3%
- Excluding tariff costs/losses at Guatemala and Bihar, the EBITDA margin was 10.1%
- PAT increased 29.4% YoY to Rs 72 crore in Q2 FY26
Half-Year Performance:
- Adjusted EBITDA rose 18.4% YoY to Rs 236 crore in H1 FY26
- Profit After Tax grew 17% YoY to Rs 138 crore in H1 FY26
Operational Highlights:
Production Volumes:
- The company shipped 19.9 million pieces in Q2 FY26, its highest-ever Q2 shipment volume, up from 19.3 million pieces in Q2 FY25
- Current capacity at 93.6 million pieces annually with plans to exceed 100 million pieces by mid-FY27
Financial Strength:
- Cash and bank balance (excluding cash earmarked for LC payments) stood at Rs 416 crore, with an additional Rs 128 crore in mutual funds, totaling Rs 544 crore as on September 30, 2025
- Networth as on September 30, 2025 stood at Rs 1,271 crore compared to Rs 1,146 crore as on March 31, 2025
- Working capital days at 33 days, indicating efficient operations
- ROCE improved by 375 bps to 29% in H1 FY26
Shareholder Returns:
- Board declared first interim dividend of Rs 6 per equity share with a face value of Rs 5 each for FY26, representing a 20% payout ratio
Strategic Initiatives & Growth Drivers:
Geographical Diversification:
- The US now contributes approximately 50% of group revenue, down from 86% in FY21, reflecting a successful geographical diversification strategy
- The company has ramped up investments in India and Bangladesh and is executing a Rs 250-crore capex plan
- Investing Rs 250 crore in capacity expansion and sustainability initiatives across India and Bangladesh
Capacity Expansion:
- Plans include addition of up to 6 million pieces in Bangladesh and 3 million pieces in India
- Targeting additional capacity of 5-6 million pieces to drive efficiency improvements
Sustainability Leadership:
- The adoption of eFlow Nanobubble technology in Bangladesh has enabled a 32% reduction in water use, a 9% decrease in power consumption, and a 20% improvement in production time efficiency
- Focus on eco-friendly manufacturing and sustainable practices
Challenges & Risk Factors:
US Tariff Impact:
- The company is navigating trade complexities, including 50% US tariff on India
- US customers are asking for a 14-15% discount to mitigate the 25% penalty tariff
- Management stated they negotiate based on services provided and for some large customers are not giving any discounts
Volume Growth Moderation:
- Volume growth was moderate at 3% for H1 FY26, compared to 30% last year, partly due to macroeconomic factors and tariff impacts
New Facility Ramp-up:
- Tariff costs and losses from new facilities in Guatemala and Bihar impacting margins
- These are expected to normalize as facilities reach full capacity
Management Outlook & Guidance:
Management Commentary:
- Management expects normalization in US tariff situation in coming quarters and remains confident in ability to adapt swiftly to changing requirements
- With diversified customer base across US, UK, Japan and Australia, and ongoing discussions on new FTAs, company remains well positioned to capture increased demand
Growth Strategy:
- The company aims to diversify market base and is targeting Rs 6,000 crores revenue by 2028
- Focus on markets like Australia, Japan, and Europe
- Continuing to push where sustainable opportunities are seen
Operational Excellence:
- Growth led by sustained momentum in Vietnam and Indonesia, which delivered double-digit volume expansion
- Multi-hub production capabilities balancing scale with agility
Institutional Interest:
- Institutional holdings stand at 20.52%, reflecting confidence from investors with substantial analytical resources
- Stake has seen a slight increase, suggesting favorable outlook on company's fundamentals
Competitive Positioning:
Industry Standing:
- One of India's largest listed garment exporters
- Return on Capital Employed (ROCE) of 15.87% in recent quarters, indicating effective utilization of capital
- Strong relationships with marquee global brands providing stability
Differentiators:
- Multi-country manufacturing model providing flexibility
- End-to-end supply chain solutions
- Focus on value-added products and higher realizations
- Strong emphasis on sustainability and innovation
My 2 Cents:
Overall Technical Assessment:
Trend Status: BULLISH
- All major trend indicators point to a sustained uptrend
- Higher highs and higher lows pattern intact
- Multiple continuation patterns successfully completed
- No signs of trend exhaustion or distribution
Pattern Reliability: HIGH
- Clean, textbook patterns with volume confirmation
- Each pattern target achieved before next formation
- Consistency in pattern execution over 3 years
Current Phase: POST-BREAKOUT CONSOLIDATION
- Stock has broken out from ascending triangle
- Currently consolidating gains near all-time highs
Risk Factors to Monitor:
Technical Risks:
- Break below Rs 1,400 would signal trend weakening
- Sustained trading below ascending trendline (Rs 1,200-1,300) would be concerning
- Formation of lower high below Rs 1,900 would indicate potential trend change
- Excessive volume on down days compared to up days
Fundamental Risks:
- Escalation of US-India tariff tensions
- Significant margin compression due to competitive pressures
- Loss of major clients or market share
- Adverse changes in global trade policies
- Sharp appreciation of Indian Rupee affecting export competitiveness
Sector Risks:
- Global economic slowdown reducing apparel demand
- Competition from Bangladesh, Vietnam intensifying
- Raw material cost inflation impacting margins
- Disruptions in global supply chains
Rationale:
- Strong technical structure with multiple confirmed patterns
- Robust fundamental performance with consistent growth
- Well-positioned to benefit from sector tailwinds
- Successful geographical diversification strategy
- Strong balance sheet and cash generation
Avoid:
- Panic selling on minor dips if fundamentals remain intact
- Over-leverage given the stock's volatility
- Ignoring stop losses in case of trend reversal
- Chasing the stock at all-time highs without confirmation
Full Coverage on my Newsletter this Week
Keep in the Watchlist and DOYR.
NO RECO. For Buy/Sell.
📌Thank you for exploring my idea! I hope you found it valuable.
🙏FOLLOW for more
👍BOOST if you found it useful.
✍️COMMENT below with your views.
Meanwhile, check out my other stock ideas on the right side until this trade is activated. I would love your feedback.
As per the Latest SEBI Mandate, this isn't a Trading/Investment RECOMMENDATION nor for Educational Purposes; it is just for Informational purposes only. The chart data used is 3 Months old, as Showing Live Chart Data is not allowed according to the New SEBI Mandate.
Disclaimer: "I am not a SEBI REGISTERED RESEARCH ANALYST AND INVESTMENT ADVISER."
This analysis is intended solely for informational purposes and should not be interpreted as financial advice. It is advisable to consult a qualified financial advisor or conduct thorough research before making investment decisions.
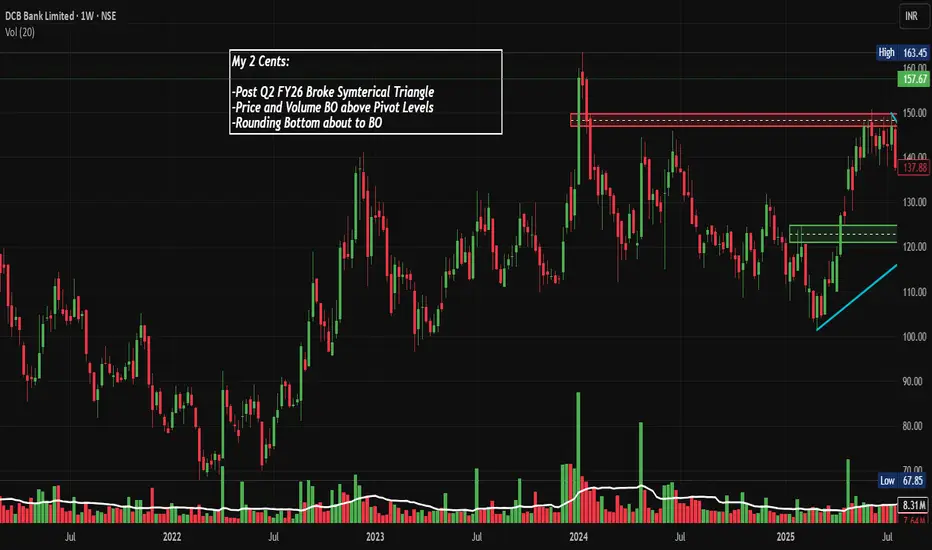
DCBBANK: Strong Q2 FY26 Numbers, Triangle BO, Chart of the MonthNSE:DCBBANK This Banking Stock Just Broke Out After a Year of Consolidation - Is a 30% Rally Coming? Posted Strong Q2 FY26 Numbers, Let's Analyse in the Chart of the Month.
As per the Latest SEBI Mandate, this isn't a Trading/Investment RECOMMENDATION nor for Educational Purposes; it is just for Informational purposes only. The chart data used is 3 Months old, as Showing Live Chart Data is not allowed according to the New SEBI Mandate.
Disclaimer: "I am not a SEBI REGISTERED RESEARCH ANALYST AND INVESTMENT ADVISER."
This analysis is intended solely for informational purposes and should not be interpreted as financial advice. It is advisable to consult a qualified financial advisor or conduct thorough research before making investment decisions.
Price Action Analysis:
Overall Trend Structure:
- The stock demonstrates a year consolidation pattern from 2024 to mid-2025, creating a strong base for accumulation
- Post-Q2 FY26 results, DCB Bank has broken out decisively from a symmetrical triangle pattern that formed during the consolidation phase
- The current price of ₹157.67 represents a significant move above the resistance zone of ₹150, which acted as a ceiling multiple times since early 2024
- A notable ascending trendline (marked in cyan) has been providing dynamic support from early 2024, suggesting sustained buying interest
Recent Price Movement:
- The stock witnessed a dramatic 23% surge in just two trading sessions (October 21-22, 2025) following the Q2 FY26 earnings release
- Current price of ₹157.67 is approaching the 52-week high of ₹163.70, demonstrating strong upward momentum
- The breakout candle shows strong conviction with increased volume participation, validating the move
- Price has successfully reclaimed and is sustaining above the critical ₹150 psychological and technical resistance level
- The stock is still 38% below its all-time high of ₹244.65, providing substantial room for upside potential
Historical Context:
- From 2021 lows around ₹70, the stock rallied to ₹150 levels by mid-2022
- A prolonged correction and consolidation phase lasted from mid-2022 through early 2024
- Multiple attempts to break the ₹150 resistance were rejected during 2024, creating a strong supply zone
- The recent breakout in October 2025 marks the first successful breach of this multi-year resistance with volume confirmation
Volume Action Analysis:
Volume Characteristics:
- Current daily volume stands at 98.79 million shares against an average of 11.07 million shares, representing an 8x surge
- Volume spike coincides perfectly with the breakout above ₹150 resistance, confirming institutional participation
- Consistent volume bars during the consolidation phase suggest steady accumulation by long-term investors
- Volume at key support levels during corrections has been relatively lower, indicating a lack of panic selling
- The volume profile shows the heaviest concentration between the ₹120-130 range, which now acts as a strong demand zone
Volume-Price Relationship:
- Breakout above resistance, accompanied by massive volume expansion, validates the bullish move
- Volume on up days significantly exceeds volume on down days during the recent rally, showing strong buying pressure
- Green volume bars dominating red volume bars in the recent price action indicate bullish accumulation
- Volume during the triangle formation was progressively declining, which is characteristic of a valid continuation pattern
- Post-breakout volume sustaining above average levels suggests continuation rather than exhaustion
Support and Resistance Levels:
Key Resistance Zones:
- Immediate Resistance (R1): ₹163.70 (52-week high and recent high)
- Medium-term Resistance (R2): ₹175-180 (Fibonacci extension level and psychological resistance)
- Major Resistance (R3): ₹200 (round number psychological barrier)
- Long-term Resistance (R4): ₹244.65 (all-time high)
Key Support Zones:
- Immediate Support (S1): ₹150 (previous resistance turned support, breakout level)
- Strong Support (S2): ₹138-140 (50% retracement of recent rally and pivot level marked on chart)
- Major Support (S3): ₹125 (ascending trendline support and breakout point from triangle)
- Critical Support (S4): ₹110-115 (bottom of recent consolidation range)
Support Strength Assessment:
- The ₹150 level has now transformed from a stubborn resistance to a new support base
- The ascending trendline from 2024 lows provides dynamic support that has been tested multiple times successfully
- The ₹125-130 zone represents a confluence of horizontal support, trendline support, and a high-volume node
- Gap support around ₹147 from the recent breakout provides a short-term cushion against minor corrections
Base Formation and Accumulation:
Base Characteristics:
- A well-defined multi-year base formation spanning approximately 2.5 years (mid-2022 to October 2025)
- The base exhibits characteristics of a symmetrical triangle consolidation pattern
- Lower highs and higher lows converging towards the apex created compression, leading to the explosive breakout
- This extended consolidation period allowed for the distribution of weak hands and accumulation by strong hands
- The base depth of approximately 35-40% from top to bottom indicates significant energy buildup
Accumulation Evidence:
- Declining volume during consolidation, followed by expansion on breakout, is a textbook accumulation pattern
- Multiple false breakouts were absorbed without panic selling, indicating patient accumulation
- Price holding above ascending trendline throughout 2024-2025 shows consistent buying support
- The rounding bottom formation visible from mid-2024 through September 2025 is a bullish accumulation pattern
- Improved fundamentals during the consolidation period attracted smart money accumulation
Technical Patterns:
Symmetrical Triangle Pattern:
- A clear symmetrical triangle pattern formed from June 2024 through October 2025
- The pattern shows converging trendlines with at least 4-5 touch points on each side
- Breakout occurred near the apex with strong volume, which is the ideal scenario for this pattern
- The pattern duration of approximately 16 months makes it a highly reliable formation
Ascending Triangle Elements:
- An ascending triangle component is visible in the chart with a flat top resistance at ₹150
- Rising lows forming the ascending trendline show progressive buying interest
- This bullish continuation pattern typically resolves to the upside, which has now been confirmed
- The pattern suggests strong demand overwhelming supply at higher levels
Breakout Pattern Validation:
- The breakout above ₹150 was accompanied by a large bullish engulfing candle
- Gap-up opening on breakout day shows urgency and conviction among buyers
- No immediate throwback to retest breakout level indicates strength
- The breakout occurred with 8x normal volume, validating the move
- Price sustaining above the breakout level for multiple sessions confirms pattern validity
Sectoral Backdrop - Private Banking Industry:
Sector Overview and Trends:
- The Indian banking sector has shown resilience with credit growth in the range of 15-17% year-on-year
- Private sector banks are gaining market share from PSU banks due to superior asset quality and technology adoption
- Small and mid-sized private banks like DCB Bank are carving niches in specific lending segments
- Net Interest Margins (NIMs) are stabilising after compression in 2023-2024, providing earnings visibility
- Asset quality metrics across the banking sector have improved, with Gross NPA levels at multi-year lows
Sector Valuations and Outlook:
- Banking sector trading at reasonable valuations with an average P/B ratio of 2-3x for private banks
- Small-cap private banks trading at a significant discount to large private banks, offering a value opportunity
- Sector outlook remains positive, driven by India's GDP growth trajectory of 6-7%
- Expected rate stability from the RBI in 2025 will help banks maintain margins
- Increasing digital adoption and financial inclusion are driving deposit and loan growth
Competitive Landscape:
- DCB Bank competes with peers like RBL Bank, South Indian Bank, Karur Vysya Bank, and CSB Bank
- Focus areas include retail lending, MSME lending, and specialised products like gold loans
- Technology adoption and digital banking are becoming key differentiators in the competitive landscape
- Consolidation trend in small banks may create M&A opportunities for well-positioned players
- Customer acquisition cost is declining with digital channels gaining prominence
Fundamental Backdrop:
Recent Financial Performance:
- Q2 FY26 results showed a robust 16.2% YoY growth in net profit to ₹184 crore
- Net Interest Income (NII) grew 17% YoY to ₹596 crore, indicating healthy core business growth
- Advances increased by 19% YoY, demonstrating strong loan book expansion
- Total operating income rose 16.22% to ₹1,822.75 crore in Q2 FY26
- Return on Assets (ROA) at 0.85% and Return on Equity (ROE) at 11.4% showing steady improvement
Asset Quality Metrics
- Gross NPA ratio improved to 2.91% as of September 30, 2025, down from 3.29% YoY
- Net NPA ratio at healthy 1.21%, indicating strong recovery and collection mechanisms
- Slippages are moderating sequentially, suggesting improved underwriting standards
- Provision coverage ratio remains adequate, providing a buffer against potential stress
- Management expects credit cost to remain below 45 basis points for the full year, indicating confidence in asset quality
Capital and Liquidity Position:
- Capital Adequacy Ratio (CAR) at strong 16.41% (Tier I: 13.97%, Tier II: 2.44%) as per Basel III norms
- Well-capitalised to support planned 20%+ loan growth without dilution
- CASA ratio at 23.52% as of September 2025, though lower than the desired 25%+
- Cost of deposits declining, helping NIM expansion despite a competitive deposit environment
- Liquidity coverage ratio and statutory ratios comfortably above regulatory requirements
Strategic Initiatives and Growth Drivers:
- Increased focus on gold loans and co-lending partnerships, driving fee income
- Emphasis on employee productivity and technology adoption, reducing Cost to Average Assets
- Digital transformation is improving customer experience and operational efficiency
- Targeting ROA of 1% and ROE of 14-15% by FY27 as per management guidance
- Niche focus areas like school finance, retail microfinance, and supply chain finance, providing growth levers
Valuation Metrics:
- Trading at P/E ratio of 7.30-7.58x, significantly below sector average of 15-20x
- Price to Book Value of 0.85x, below 1x, suggesting undervaluation
- PEG ratio of 0.51 indicates the stock is undervalued relative to the growth rate
- Dividend yield of 0.81-0.87% with a consistent dividend payout history
- Market capitalisation of approximately ₹5,065 crore classifies it as a small-cap bank
- Attractive valuation multiple offers significant re-rating potential as performance improves
Management and Governance:
- Leadership under MD & CEO Praveen Kutty is showing strong execution capabilities
- Management has consistently delivered on stated guidance parameters
- Board composition includes experienced banking professionals and independent directors
- No major governance concerns or regulatory issues flagged
- Transparent communication with stakeholders through regular investor calls and updates
Key Risks to Monitor:
- Small-cap bank status means higher vulnerability to market sentiment and liquidity shocks
- CASA ratio below peers indicates higher cost of funds and margin pressure risk
- Geographic concentration in certain states may lead to regional economic exposure
- Competition from larger banks and fintech players in key product segments
- Regulatory changes impacting small banks could affect operations
- Slower-than-expected economic growth could impact loan demand and asset quality
Technical Sentiment:
- Technical indicators, including MACD and Bollinger Bands, show bullish signals across timeframes
- Golden cross formation (50-day MA crossing above 200-day MA) has bullish implications
- Momentum indicators suggest the stock remains in a bullish zone with room to run
- Pattern completion targets align with brokerage fundamental price targets around ₹175-200
- Short-term overbought conditions may lead to consolidation, but don't negate the bullish thesis
Trade Monitoring and Review Framework:
Daily Monitoring Checklist:
- Check price action relative to key support and resistance levels identified
- Monitor volume patterns - declining volume on pullbacks is healthy, rising volume on breakdowns is concerning
- Track broader market indices (Nifty, Bank Nifty) for sector correlation
- Review any news flow specific to DCB Bank or the banking sector
- Ensure stop loss orders are active and properly placed in the system
Weekly Review Points:
- Assess whether the stock is respecting the ascending trendline support
- Compare DCB Bank's performance relative to the Bank Nifty index and peer banks
- Review any changes in FII/DII holdings or institutional activity
- Check for any upgrades/downgrades from research analysts
- Evaluate whether to book partial profits or adjust stop losses based on price movement
Quarterly Assessment:
- Deep dive into quarterly results when announced against expectations
- Review management commentary and guidance for any changes in outlook
- Assess asset quality trends, NIM trajectory, and expense management
- Compare performance metrics with peer group banks
- Re-evaluate position size and allocation based on updated fundamentals
Red Flags to Watch:
- Any close below the ascending trendline support on high volume
- Significant deterioration in asset quality (GNPAs rising above 3.5%)
- Margin compression beyond 10 basis points in a quarter
- Negative management commentary or guidance revision downwards
- Broader banking sector entering correction phase with systematic risks emerging
My 2 Cents:
- DCB Bank presents a compelling risk-reward opportunity at current levels following a clean technical breakout
- Multi-year base formation and pattern completion project has significant upside potential
- Strong fundamentals with improving profitability, asset quality, and capital ratios support the technical picture
- Attractive valuations at 0.85x P/B and 7.5x P/E provide substantial margin of safety
- Positive sectoral tailwinds and company-specific growth initiatives enhance medium-term outlook
Full Coverage on my Newsletter this Week
Keep in the Watchlist and DOYR.
NO RECO. For Buy/Sell.
📌Thank you for exploring my idea! I hope you found it valuable.
🙏FOLLOW for more
👍BOOST if you found it useful.
✍️COMMENT below with your views.
Meanwhile, check out my other stock ideas on the right side until this trade is activated. I would love your feedback.
As per the Latest SEBI Mandate, this isn't a Trading/Investment RECOMMENDATION nor for Educational Purposes; it is just for Informational purposes only. The chart data used is 3 Months old, as Showing Live Chart Data is not allowed according to the New SEBI Mandate.
Disclaimer: "I am not a SEBI REGISTERED RESEARCH ANALYST AND INVESTMENT ADVISER."
This analysis is intended solely for informational purposes and should not be interpreted as financial advice. It is advisable to consult a qualified financial advisor or conduct thorough research before making investment decisions.
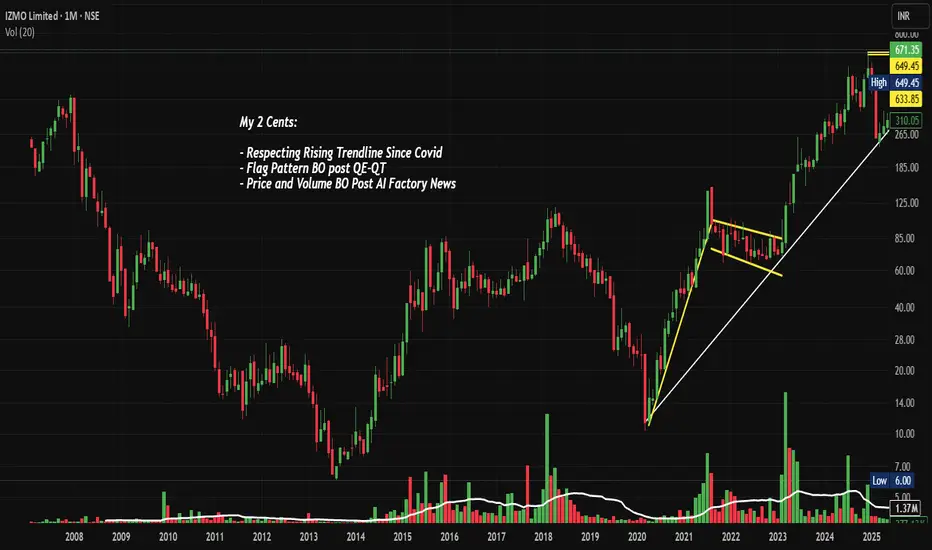
IZMO: From ₹6 to ₹671 - What's Next? Chart of the MonthNSE:IZMO Why This ₹671 Unknown Indian AI Factory Stock Could Be the Next Multibagger in 2025? Let's analyze in the "Chart of the Month"
As per the Latest SEBI Mandate, this isn't a Trading/Investment RECOMMENDATION nor for Educational Purposes; it is just for Informational purposes only. The chart data used is 3 Months old, as Showing Live Chart Data is not allowed according to the New SEBI Mandate.
Disclaimer: "I am not a SEBI REGISTERED RESEARCH ANALYST AND INVESTMENT ADVISER."
This analysis is intended solely for informational purposes and should not be interpreted as financial advice. It is advisable to consult a qualified financial advisor or conduct thorough research before making investment decisions.
Price Action:
- Current Price: ₹671.35 (as of Aug 31, 2025)
- 52-Week Range: ₹230.00 - ₹738.40
- Stock has demonstrated exceptional momentum with 11,000%+ returns since COVID lows
- Currently trading near all-time highs with strong volume confirmation
Volume Spread Analysis:
- Volume spike evident during recent breakout phases
- 13.5M volume this month, showing active institutional participation
- Volume pattern confirms genuine breakout above resistance zones
- Higher volume on up days indicates accumulation by smart money
Key Technical Levels:
Support Levels:
- Primary Support: ₹633.85 (previous resistance turned support)
- Secondary Support: ₹580-590 zone (trend line confluence)
- Critical Support: ₹520-540 (major demand zone)
Resistance Levels:
- Immediate Resistance: ₹738.40 (all-time high)
- Secondary Resistance: ₹800-850 (psychological levels)
- Extended Target: ₹950-1000 (measured move projection)
Base Formation:
- Multi-year base formation from 2020-2022 (₹20-80 range)
- Clean breakout above ₹100 marked the beginning of the current uptrend
- Stage 2 markup phase with consistently higher highs and higher lows
Technical Patterns Identified:
- Cup and Handle pattern completed on a monthly timeframe
- Ascending triangle breakout above ₹600
- Bull flag consolidation pattern near current levels
- Rising wedge formation within broader uptrend (caution signal)
Sectoral and Fundamental Backdrop:
Company Overview:
- NSE:IZMO is a global leader in automotive interactive marketing solutions, providing hi-tech automotive e-retailing solutions across North America, Europe, and Asia
- Founded by Dinanath Soni and Sanjay Vedprakash Soni in 1995, headquartered in Bangalore
Recent Catalysts:
- The company recently launched its Automotive AI Factory, a breakthrough innovation hub to accelerate AI adoption across the automotive industry
- The AI Factory can deliver enterprise-grade AI capabilities at 70-80% lower cost than Western markets
- The hub will deliver customized AI models that optimize pricing and operations while enhancing customer engagement
Financial Metrics:
- Market Cap: ₹1,000 Crores (up 64.5% in 1 year)
- Revenue: ₹234 Crores, Profit: ₹49 Crores
- Trading at 2.78 times book value and 19.6x P/E
- Promoter holding: 34.95%
Sectoral Trends:
- The automotive industry is increasingly adopting AI-driven solutions
- Digital transformation in automotive retail is accelerating post-COVID
- Growing demand for interactive marketing solutions globally
- India emerging as a cost-effective hub for AI and tech services
Key Risks:
- Recent Q1FY26 results showed a -5.52% QoQ revenue decline and -12.9% QoQ net profit decrease
- Concentration risk in the automotive sector
- Currency fluctuation risk due to international operations
Bullish Factors:
- Revolutionary AI Factory launch provides new growth avenue
- Strong technical breakout with volume confirmation
- Global leadership position in niche automotive marketing space
- Cost advantage in AI solutions delivery
- Multi-year base breakout suggesting sustainable uptrend
Risk Factors:
- Recent quarterly performance decline
- Elevated valuation levels
- Potential for profit-taking near all-time highs
- Sector-specific risks and economic sensitivity
Full Coverage on my Newsletter this Week
Keep in the Watchlist and DOYR.
NO RECO. For Buy/Sell.
📌Thank you for exploring my idea! I hope you found it valuable.
🙏FOLLOW for more
👍BOOST if you found it useful.
✍️COMMENT below with your views.
Meanwhile, check out my other stock ideas on the right side until this trade is activated. I would love your feedback.
As per the Latest SEBI Mandate, this isn't a Trading/Investment RECOMMENDATION nor for Educational Purposes, it is just for Informational purposes only. The chart data used is 3 Months old, as Showing Live Chart Data is not allowed according to the New SEBI Mandate.
Disclaimer: "I am not a SEBI REGISTERED RESEARCH ANALYST AND INVESTMENT ADVISER."
This analysis is intended solely for informational purposes and should not be interpreted as financial advice. It is advisable to consult a qualified financial advisor or conduct thorough research before making investment decisions.
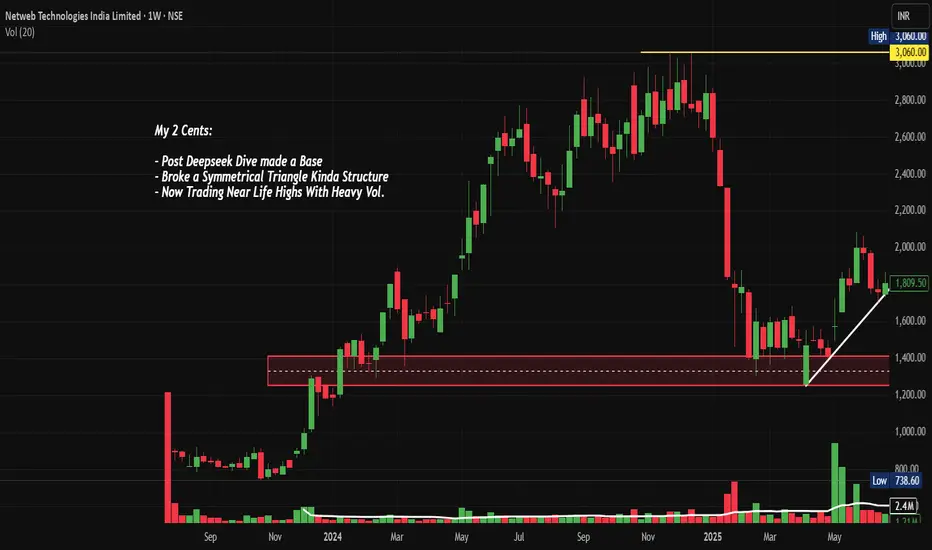
NETWEB: AI Infrastructure Goldmine ? Chart of the MonthNSE:NETWEB MarchingTowards 4,000: Is This the AI Infrastructure Goldmine You've Been Waiting For? Let's analyze in the "Chart of the Month".
As per the Latest SEBI Mandate, this isn't a Trading/Investment RECOMMENDATION nor for Educational Purposes; it is just for Informational purposes only. The chart data used is 3 Months old, as Showing Live Chart Data is not allowed according to the New SEBI Mandate.
Disclaimer: "I am not a SEBI REGISTERED RESEARCH ANALYST AND INVESTMENT ADVISER."
This analysis is intended solely for informational purposes and should not be interpreted as financial advice. It is advisable to consult a qualified financial advisor or conduct thorough research before making investment decisions.
Price Action Analysis:
- Current Price: ₹3,695.40
- 52-Week Range: ₹738.60 - ₹3,745.00
- Recent Performance: +64% gain in a Month with strong momentum
- Price structure shows consistently higher highs and higher lows pattern
- Stock has demonstrated remarkable resilience with a 380% rally from its 52-week low
Volume Spread Analysis:
- Volume surge visible during recent breakout phases
- High volume of 24.25M shares traded, indicating institutional participation
- Volume expansion coinciding with price breakouts confirms genuine buying interest
- Strong volume accumulation during consolidation phases suggests smart money positioning
Chart Patterns Identified:
- Symmetrical Triangle Breakout: Successfully broken above the triangle pattern
- Ascending Triangle: Multiple resistance tests followed by decisive breakout
- Flag and Pennant Patterns: Short-term consolidation after sharp moves
Key Technical Levels:
Support Levels:
- Immediate Support: ₹3,200 (recent consolidation zone)
- Strong Support: ₹2,800 (previous resistance turned support)
- Major Support: ₹2,400 (trendline support and psychological level)
- Critical Support: ₹2,000 (long-term ascending trendline)
Resistance Levels:
- Immediate Resistance: ₹3,745 (52-week high)
- Next Resistance: ₹4,000 (psychological round number)
- Extended Resistance: ₹4,400 (measured move projection)
- Long-term Resistance: ₹5,000
Base Formation:
- Primary Base: ₹1,200-₹1,600 range (established during deep consolidation)
- Secondary Base: ₹2,400-₹2,800 range (recent re-accumulation zone)
- The stock has clearly established a strong foundation above the ₹2,400 levels
Technical Indicators Assessment:
Momentum Indicators:
- RSI is in overbought territory but showing positive divergence
- MACD showing bullish crossover with expanding histogram
- Stochastic indicates strong upward momentum
- ADX suggesting strong trending behaviour
Moving Averages:
- Price trading well above all major moving averages
- 20 EMA, 50 EMA, and 200 EMA in perfect bullish alignment
- Strong uptrend confirmed by ascending moving averages
- No signs of trend reversal in the near term
Sectoral and Fundamental Backdrop:
AI Infrastructure Sector Outlook:
- India's IndiaAI Mission with ₹10,372 crore budget creating massive opportunities
- Government's push for sovereign AI infrastructure benefiting domestic players
- Global demand for AI computing infrastructure is experiencing exponential growth
- Limited domestic competition in the high-end computing solutions space
Company-Specific Fundamentals:
- Netweb's supercomputers have appeared 15 times across three entries in the global Top 500 supercomputers ranking
- The company is almost debt-free with a market cap of ₹20,936 crore
- Recent order wins worth ₹1,734 crore for IndiaAI Mission and ₹450 crore additional order
- Order pipeline of ₹4,142.1 crore as of June 2025, excluding new mandates
Key Growth Catalysts:
- Delivery of servers built on NVIDIA's Blackwell Architecture for India's Sovereign AI System
- Expanding presence in high-performance computing and AI systems
- Strong relationships with global technology partners
- Beneficiary of the government's Digital India and AI initiatives
Financial Performance Metrics:
- Strong revenue visibility from a large order book
- Improving profit margins due to premium product offerings
- Healthy cash flows supporting future expansion
- Zero debt structure providing financial flexibility
Strategic Outlook:
- Expect continued momentum driven by the AI infrastructure theme
- News-driven volatility possible around order execution updates
- Sector rotation into a technology infrastructure play is expected
- Quarterly results will be the key catalyst for sustained momentum
- India's AI infrastructure buildout is a multi-year opportunity
- The company is well-positioned to capture significant market share
Risk Factors to Monitor:
Technical Risks:
- Overbought conditions may lead to profit-taking
- High volatility expected given the stock's momentum
- Any break below ₹3,000 would signal trend weakness
Fundamental Risks:
- Execution risk on large government orders
- Competition from global players in AI infrastructure
- Technology disruption risks in a rapidly evolving sector
- Dependence on government spending cycles
Market Risks:
- Overall market correction could impact high-beta stocks
- Sector rotation away from technology themes
- Global supply chain disruptions affecting component availability
My 2 Cents:
NSE:NETWEB presents a compelling technical setup with strong fundamental support from India's push for AI infrastructure. The stock's breakout from multiple chart patterns, combined with substantial order wins and sector tailwinds, creates an attractive risk-reward proposition. However, position sizing and disciplined risk management remain crucial given the stock's high volatility and premium valuation.
Full Coverage on my Newsletter this Week
Keep in the Watchlist and DOYR.
NO RECO. For Buy/Sell.
📌Thank you for exploring my idea! I hope you found it valuable.
🙏FOLLOW for more
👍BOOST if you found it useful.
✍️COMMENT below with your views.
Meanwhile, check out my other stock ideas on the right side until this trade is activated. I would love your feedback.
As per the Latest SEBI Mandate, this isn't a Trading/Investment RECOMMENDATION nor for Educational Purposes; it is just for Informational purposes only. The chart data used is 3 Months old, as Showing Live Chart Data is not allowed according to the New SEBI Mandate.
Disclaimer: "I am not a SEBI REGISTERED RESEARCH ANALYST AND INVESTMENT ADVISER."
This analysis is intended solely for informational purposes and should not be interpreted as financial advice. It is advisable to consult a qualified financial advisor or conduct thorough research before making investment decisions.
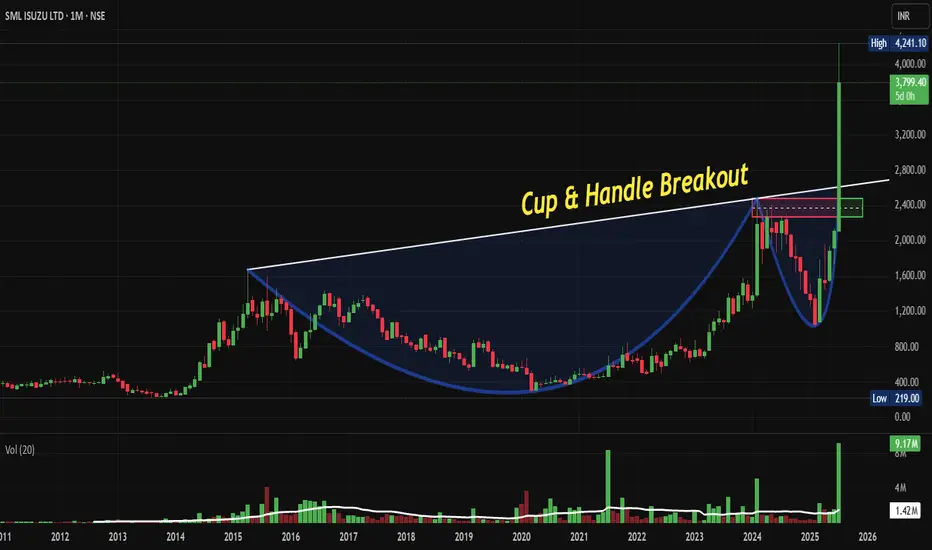
SMLISUZU: Explosive Cup and Handle Breakout, Chart of the Month From Years of Consolidation to Explosive Breakout: Why NSE:SMLISUZU Cup & Handle Pattern Could Deliver Multi-Bagger Returns. Let's Deep Dive into "Chart of the Month"
Price Action Analysis:
- Current trading price is approximately ₹3,799.40
- The stock has demonstrated a textbook Cup & Handle formation spanning over a decade (2015-2025)
- Post-breakout momentum shows strong bullish continuation with healthy volume expansion
- Recent breakout above the ₹2,400 breakout level indicates institutional accumulation
Volume Spread Analysis:
- Volume spike during the 2024-2025 breakout phase confirms genuine institutional interest
- Average daily volume has increased significantly from historical levels
- Volume pattern shows healthy distribution during consolidation phases and accumulation during breakouts
- Recent volume bars indicate sustained buying interest at higher levels
Key Technical Levels:
Base Formation:
- Primary base formed between 2020-2023 at ₹400-800 levels
- Secondary base consolidation occurred in 2023-2024 around ₹1,200-1,600 range
- The decade-long cup formation created a strong foundation for the current uptrend
Support Levels:
- Immediate support: ₹3,200-3,400 (recent consolidation zone)
- Strong support: ₹2,400-2,600 (cup breakout level)
- Critical support: ₹1,800-2,000 (previous resistance turned support)
- Long-term support: ₹1,200-1,400 (base formation)
Resistance Levels:
- Immediate resistance: ₹4,200-4,400 (psychological round number)
- Next resistance: ₹4,800-5,000 (projected target based on cup depth)
- Long-term target: ₹6,000+ (measured move from cup formation)
Technical Pattern:
Cup & Handle Pattern
- Formation period: 2015-2025 (10-year formation)
- Cup depth: Approximately ₹1,800 (from ₹2,400 high to ₹600 low)
- Handle formation: 2024-2025 consolidation
- Breakout confirmation: Volume expansion above ₹2,400
Moving Average Alignment:
- Price trading above all major moving averages
- Strong uptrend with moving averages in bullish sequence
- No signs of trend reversal in the immediate term
Trade Setup:
Entry Levels:
- Aggressive entry: ₹3,600-3,700 (current market price on minor dips)
- Conservative entry: ₹3,200-3,400 (on pullback to support)
- Accumulation zone: ₹2,800-3,200 (for long-term positions)
Exit Levels:
- Target 1: ₹4,500-4,700 (25-30% upside)
- Target 2: ₹5,500-5,800 (50-60% upside)
- Target 3: ₹6,500+ (multi-bagger potential)
Stop-Loss Strategy:
- For aggressive entries: ₹3,100 (8-10% risk)
- For conservative entries: ₹2,800 (12-15% risk)
- Trailing stop: Use a 20% trailing stop once the position moves 30% in favour
Position Sizing & Risk Management:
Position Sizing Guidelines
- Conservative investors: 2-3% of portfolio
- Moderate risk investors: 3-5% of portfolio
- Aggressive investors: 5-8% of portfolio (maximum recommended)
Risk Management Framework
- Never risk more than 2% of the total portfolio on a single trade
- Use position sizing formula: (Portfolio Risk ÷ Trade Risk) × 100
- Implement pyramid buying on pullbacks to support levels
- Book partial profits at each target level (33% at each target)
Portfolio Allocation Strategy:
- Core holding: 60% of position for long-term (2-3 years)
- Trading position: 40% for swing trades and profit booking
- Rebalance quarterly based on technical developments
Sectoral & Fundamental Backdrop:
Commercial Vehicle Sector Overview:
- The Commercial Vehicles market in India is projected to grow by 2.13% (2025-2030), resulting in a market volume of 1,165.00k vehicles in 2030
- India's commercial vehicle industry is gearing up for a modest recovery, with ICRA forecasting a 3-5 per cent year-on-year growth in wholesale volumes for FY26
- The India Commercial Vehicles Market size is estimated at 51.09 billion USD in 2025, and is expected to reach 62.95 billion USD by 2029, growing at a CAGR of 5.36%
Industry Dynamics:
- Infrastructure development is driving demand for commercial vehicles
- The government's focus on road construction and the logistics sector
- The e-commerce boom is increasing last-mile delivery vehicle demand
- Replacement demand cycle supporting steady growth
Company Fundamentals:
- Net profit of SML ISUZU rose 44.34% to Rs 67 crore in the quarter ended June 2025 as against Rs 46 crore during the previous quarter ended June 2024. Sales rose 13.39% to Rs 846 crore in the quarter ended June 2025
- Market Cap: 5,498 Crore (up 84.8% in 1 year), Revenue: 2,498 Cr, Profit: 142 Cr, Promoter Holding: 43.96%
Business Model Strengths:
- NSE:SMLISUZU Limited manufactures and sells commercial vehicles and related parts in India and internationally. Its products include trucks and buses
- Strong partnership with Isuzu Motors for technology and product development
- Focus on fuel-efficient and reliable commercial vehicles
- Growing aftermarket services contributing to recurring revenue
Financial Health Indicators:
- Consistent revenue growth over recent quarters
- Improving profit margins, indicating operational efficiency
- Stable promoter holding, suggesting management confidence
- Strong balance sheet supporting growth investments
Risk Assessment:
Technical Risks:
- Failure to hold ₹3,200 support could trigger correction to ₹2,800
- High volatility expected due to recent sharp price appreciation
- Potential profit booking pressure at psychological levels
Fundamental Risks:
- Cyclical nature of the commercial vehicle industry
- Dependency on economic growth and infrastructure spending
- Competition from established players like Tata Motors
- Raw material cost fluctuations impacting margins
Market Risks:
- Overall market correction could impact individual stock performance
- Interest rate changes affecting vehicle financing demand
- Regulatory changes in emission norms requiring investment
My Take:
NSE:SMLISUZU presents a compelling technical setup with the successful breakout from a decade-long Cup & Handle pattern. The combination of strong fundamentals, improving sector dynamics, and bullish technical indicators suggests potential for significant upside. However, investors should implement proper risk management given the stock's recent appreciation and inherent sector volatility.
The stock appears well-positioned to benefit from India's infrastructure growth story and the recovery of the commercial vehicle sector. Technical indicators support a bullish outlook with multiple price targets achievable over the next 12-18 months.
Keep in the Watchlist and DOYR.
NO RECO. For Buy/Sell.
📌Thank you for exploring my idea! I hope you found it valuable.
🙏FOLLOW for more
👍BOOST if you found it useful.
✍️COMMENT below with your views.
Meanwhile, check out my other stock ideas on the right side until this trade is activated. I would love your feedback.
Disclaimer: "I am not a SEBI REGISTERED RESEARCH ANALYST AND INVESTMENT ADVISER."
This analysis is intended solely for informational and educational purposes and should not be interpreted as financial advice. It is advisable to consult a qualified financial advisor or conduct thorough research before making investment decisions.
Supreme Power Equipment: Technically Strong, Chart of the MonthNSE:SUPREMEPWR Technically Strong Momentum is my pick in this month's "Chart of the Month"
Price Action Analsis:
- Stock currently trading at ₹227.50, up 21.35 (+10.36%), showing strong bullish momentum
- Recent breakout from a prolonged Correction phase that lasted from July 2024 to May 2025
- Price has successfully cleared multiple resistance levels and is now approaching previous highs
- Strong recovery from the March 2025 lows around ₹95-100 levels
Volume Spread Analysis:
- Current volume at 324.68K shares, significantly higher than the 20-day average
- Volume spike during the recent breakout confirms institutional participation
- Volume pattern shows accumulation during the consolidation phase
- Strong volume support during the current upward move validates the breakout
Key Technical Levels:
Support Levels:
- Immediate support: ₹210-215 (recent breakout level)
- Secondary support: ₹190-195 (previous resistance turned support)
- Major support: ₹160-170 (consolidation zone)
- Critical support: ₹120-130 (long-term moving average zone)
Resistance Levels:
- Immediate resistance: ₹240-250 (previous high zone)
- Major resistance: ₹280-290 (historical resistance)
- Ultimate target: ₹350-370 (measured move from base)
Base Formation:
- Clear accumulation base formed between ₹120-250 from July 2024 to May 2025
- Base depth of approximately 130 points provides a strong foundation
- Base duration of 10+ months indicates strong institutional accumulation
- Recent breakout from this base suggests potential for significant upward move
Technical Patterns:
- The cup and Handle pattern formation is visible on the monthly timeframe
- The ascending triangle breakout pattern recently completed
- Moving average convergence suggesting trend reversal
- RSI is likely showing bullish divergence from the March lows
Trade Setup:
Entry Strategy:
- Primary entry: ₹225-230 on any pullback to the breakout level
- Aggressive entry: Current market price ₹227.50 for momentum traders
- Conservative entry: Wait for retest of ₹210-215 support zone
- Scale-in approach: 50% at current levels, 50% on any dip to ₹215
Exit Levels:
- Target 1: ₹280 (24% upside) - Previous resistance zone
- Target 2: ₹320 (41% upside) - Measured move target
- Target 3: ₹370 (63% upside) - Ultimate breakout target
- Trailing stop: Use a 10% trailing stop once Target 1 is achieved
Stop-Loss:
- Initial stop-loss: ₹195 (14% downside risk)
- Breakeven stop: Move to ₹230 once price reaches ₹260
- Trailing stop: 8-10% below recent swing high
Position Sizing:
- Conservative investors: 2-3% of portfolio
- Moderate risk tolerance: 3-5% of portfolio
- Aggressive traders: 5-7% of portfolio (with tight stops)
- Maximum exposure: Not more than 7% given single stock concentration risk
Risk Management:
- Risk-reward ratio: 1:2 minimum for all positions
- Never risk more than 2% of the total portfolio on this single trade
- Use position sizing calculators to determine the exact share quantity
- Consider partial profit booking at each target level
- Monitor sector rotation and overall market conditions
Sectoral Backdrop:
Power Equipment Sector Overview:
- India's power sector is undergoing a massive transformation with a renewable energy push
- The government's target of 500 GW of renewable capacity by 2030 is driving equipment demand
- Infrastructure spending and rural electrification programs supporting sector growth
- PLI scheme for manufacturing provides additional tailwinds
Sector Challenges:
- Raw material cost inflation is impacting margins
- Supply chain disruptions affecting delivery timelines
- Intense competition from Chinese manufacturers
- Regulatory changes and policy uncertainties
Sector Opportunities:
- Make in India initiative favours domestic manufacturers
- Rising power demand from industrial and commercial sectors
- Smart grid implementation creating new revenue streams
- Export opportunities in emerging markets
Fundamental Backdrop:
Company Strengths:
- Established player in power transmission and distribution equipment
- Strong order book providing revenue visibility
- Diversified product portfolio, reducing concentration risk
- Experienced management team with industry expertise
Financial Health:
- Need to verify recent quarterly results for revenue and profit trends
- Debt levels and interest coverage ratios require monitoring
- Cash flow generation capability is important for sustained growth
- Return on equity and asset turnover metrics need evaluation
Growth Catalysts:
- Government infrastructure spending on the power sector
- Rural electrification and grid modernization projects
- Renewable energy integration requires specialized equipment
- Potential for export market expansion
Risk Factors:
- Dependence on government orders and policy changes
- Working capital-intensive business model
- Competition from larger players and imports
- Raw material price volatility affecting margins
My Take:
NSE:SUPREMEPWR exhibits a strong technical setup, characterised by a clear breakout from a well-formed base. The combination of volume confirmation, sector tailwinds, and government policy support creates a favourable risk-reward scenario. However, traders should maintain disciplined risk management and avoid overexposure to this single position.
Honourable Mentions:
Other stocks that have a good Setup
NSE:KIRLOSBROS , NSE:CGCL , NSE:SUNDRMFAST
Keep in the Watchlist.
NO RECO. For Buy/Sell.
📌Thank you for exploring my idea! I hope you found it valuable.
🙏FOLLOW for more
👍BOOST if you found it useful.
✍️COMMENT below with your views.
Meanwhile, check out my other stock ideas on the right side until this trade is activated. I would love your feedback.
Disclaimer: "I am not a SEBI REGISTERED RESEARCH ANALYST AND INVESTMENT ADVISER."
This analysis is intended solely for informational and educational purposes and should not be interpreted as financial advice. It is advisable to consult a qualified financial advisor or conduct thorough research before making investment decisions.
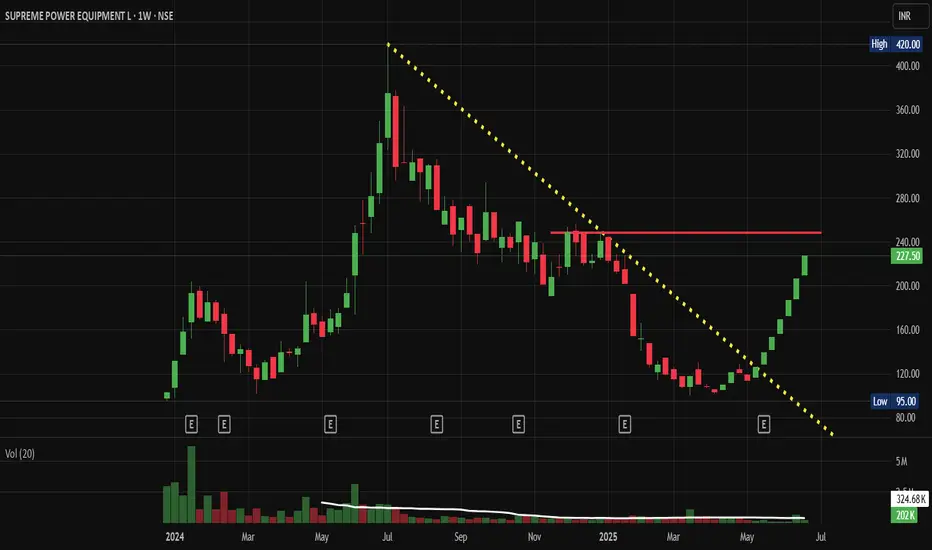
GRSE: Can this Defence Stock Double Your Money in 2025?NSE:GRSE : Can this Defence Stock Double Your Money in 2025? Let's analyse this weekend's My Chart of the Month
NSE:GRSE presents one of the most compelling technical setups in the defence sector, with the stock currently trading at ₹3,003 after a massive rally from its 2019 lows around ₹77. The chart reveals a textbook case of a multi-year accumulation followed by explosive breakout dynamics.
Price Action Analysis :
The stock underwent a dramatic transformation from a prolonged consolidation phase between 2019 and 2022, during which it traded in a narrow range of ₹150-300. The real fireworks began in late 2022, when GRSE broke out of its multi-year base with exceptional volume, signalling institutional accumulation.
The most striking feature is the parabolic move from ₹1,000 levels in early 2024 to the current high of ₹3,250. This represents over 200% gains in just over a year, accompanied by consistently high volumes averaging 40-130 million shares, indicating strong institutional participation.
Volume Analysis:
Volume patterns have been particularly bullish, with spikes coinciding with price advances. The recent correction has seen relatively lower volumes, suggesting profit-booking rather than institutional selling. The volume-weighted average price (VWAP) continues to trend upward, indicating underlying strength.
Key Technical Levels:
Support Zone: The stock has established strong support around ₹2,400-2,500 levels, coinciding with the 0.5 Fibonacci retracement from the recent rally.
Immediate Support: ₹2,683 (recent swing low)
Critical Support: ₹2,165 (0.618 Fibonacci level)
Resistance Levels: The stock recently touched ₹3,250 and is currently consolidating. The next major resistance lies at ₹3,500-3,600 based on measured move projections.
Trade Setup:
Entry Strategy:
- Primary Entry: ₹2,650-2,750 (current levels to slight dip)
- Aggressive Entry: ₹2,900-3,000 on any pullback
- Conservative Entry: ₹2,400-2,500 (major support retest)
Target Levels:
- Target 1: ₹3,400 (15% upside)
- Target 2: ₹3,800 (35% upside)
- Target 3: ₹4,200 (50% upside based on measured moves)
Stop Loss: ₹2,300 (below critical Fibonacci support)
Risk-Reward: Favourable 1:2 to 1:3 ratio across all entry points
Sectoral & Fundamental Backdrop:
The defence sector is experiencing a renaissance driven by the government's push for Atmanirbhar Bharat and increased defence spending. GRSE, being a premier shipbuilding company under the Ministry of Defence, is directly benefiting from:
1. Increased naval modernization programs
2. Export opportunities under government initiatives
3. Project 75(I) submarine program participation
4. Anti-submarine warfare corvette projects
The company's order book has been consistently growing, with recent announcements of significant contracts providing revenue visibility for the next 3-4 years. The shift towards indigenous defence production gives GRSE a strategic advantage in the naval segment.
Risk Factors:
Primary risks include overall market correction affecting high-beta defence stocks, profit-booking by retail investors after substantial gains, and any delays in government defence projects. The stock's high valuation multiple also makes it susceptible to sector rotation.
My Take:
GRSE represents a compelling blend of strong fundamentals backed by government policy support and technically sound chart patterns. The risk-adjusted returns appear favourable for medium-term investors, with the stock likely to test new highs once the Pullback is done. However, position sizing should account for the inherent volatility in defence stocks and the broader market environment. Therefore, BUY ON DIPS
The combination of sectoral tailwinds, robust order book, and technical breakout makes GRSE a candidate for continued outperformance, though investors should remain mindful of profit-booking opportunities at resistance zones.
Keep in the Watchlist.
NO RECO. For Buy/Sell.
📌Thank you for exploring my idea! I hope you found it valuable.
🙏FOLLOW for more
👍BOOST if you found it useful.
✍️COMMENT below with your views.
Meanwhile, check out my other stock ideas on the right side until this trade is activated. I would love your feedback.
Disclaimer: "I am not a SEBI REGISTERED RESEARCH ANALYST AND INVESTMENT ADVISER."
This analysis is intended solely for informational and educational purposes and should not be interpreted as financial advice. It is advisable to consult a qualified financial advisor or conduct thorough research before making investment decisions.
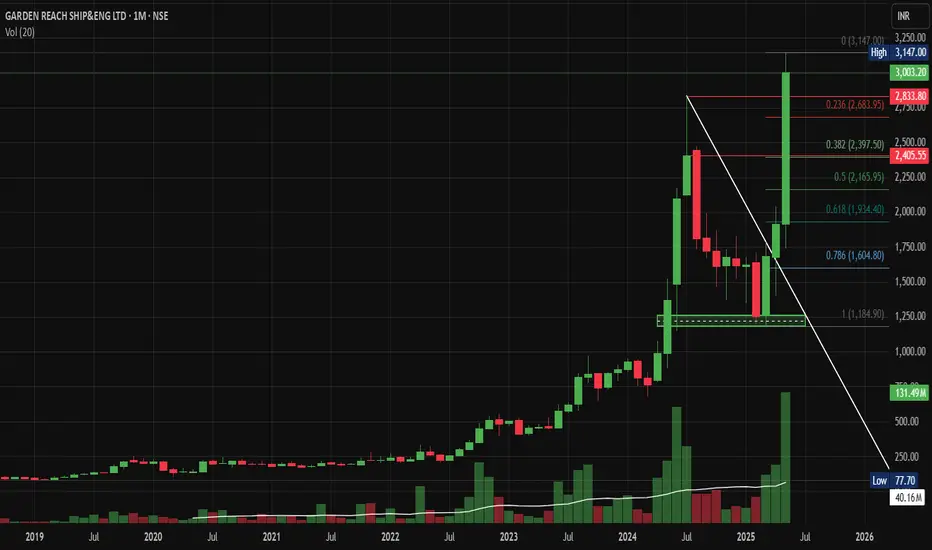
Data Patterns - Trendline BO with High Vol. - Chart of the MonthNSE:DATAPATTNS showed good price action this month, breaking the trendline with high volumes, showcasing strength in this market. Defence Industry Stocks are showing relative strength and looking to continue that further, qualifying for my Chart of the Month.
About:
NSE:DATAPATTNS is one of the fastest-growing companies in the Defence and Aerospace Electronics sector in India. It is among the few vertically integrated defence
and aerospace electronics solutions providers catering to the indigenously developed defence products industry. It is focused on in-house development and manufacturing facilities led by innovation and design, and development efforts. It has been in business for over 35 years. It has supplied products catering to all the platforms, viz., space, air, land and sea, including products for LCA-Tejas.
Trade Setup:
Buy on Dips near Trendline Support or the base for Positional Traders and on breakout of the candle high for Swing Traders.
Target:
Around ATH Zones, ideally, if sustained,d can go further up.
Stop Loss:
Entry Candle Low For Swing Traders and Base Marked for Positional Traders.
📌Thank you for exploring my idea! I hope you found it valuable.
🙏FLLOW for more
👍BOOST if useful
✍️COMMENT below with your views.
Meanwhile, check out my other stock ideas on the right side until this trade is activated. I would love your feedback.
Disclaimer: "I am not SEBI REGISTERED RESEARCH ANALYST AND INVESTMENT ADVISER."
This analysis is intended solely for informational and educational purposes and should not be interpreted as financial advice. It is advisable to consult a qualified financial advisor or conduct thorough research before making investment decisions.

Sumitomo Chemical - Chart of the MonthNSE:SUMICHEM showed good price action this month, showcasing strength in this market and looking to continue that further, hence qualifying for my Chart of the Month.
About:
NSE:SUMICHEM is one of the leading players in the industry, which has a balanced portfolio of technical and formulation products along with backward integration for some products.
The Company is known for domestic marketing of proprietary products of its Japanese parent, TSE:4005 in agrochemicals, animal nutrition, and environmental health business segments. With the integration of Excel Crop Care Limited, the Company now has a strong portfolio of generics in addition to specialty products and a strong combined marketing network.
Trade Setup:
It crossed major Swing High Levels this Month and is now looking to cross ATH, RSI & MACD Trending Upwards. Buy on DIPS can be done if it consolidates. The Base Formed Will be an Ideal Stop Loss.
Target:
Around 672 Levels can book a partial at the ATH Zones.
Stop Loss:
Entry Candle Low For Swing Traders and Base Marked for Positional Traders.
