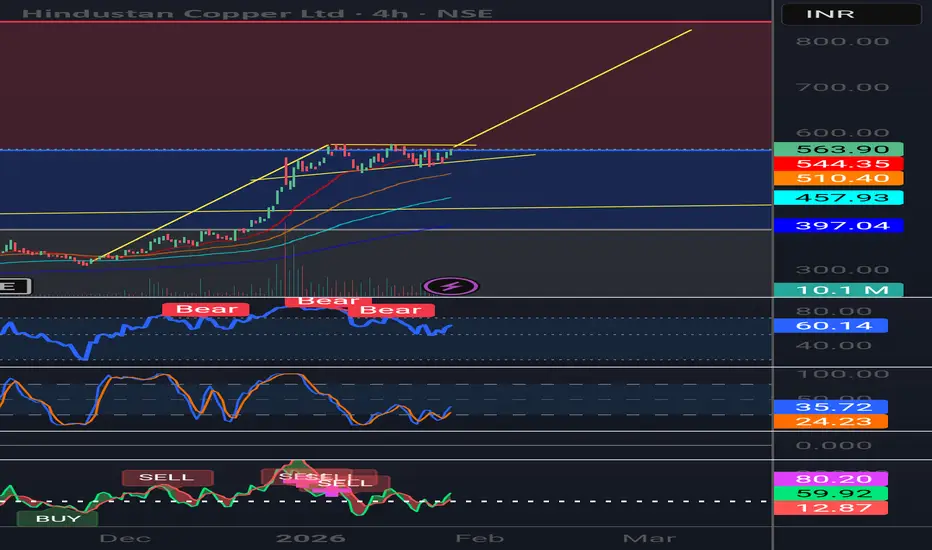
Bullish pennant HindCopperStrong uptrend. Price is consolidating just below resistance (~₹565–570). This looks like a healthy pause after a sharp rally. Expectation: a breakout above ₹570 can lead to a fast move higher; downside remains limited as long as ~₹545 holds.
Next possible targets (on upside):
₹620–630 → first immediate target after breakout
₹650 → next resistance / partial profit zone
₹700–720 → measured move if momentum sustains
Final target 820
Key condition: these come into play only if price sustains above ~₹570.
Chart Patterns
Part 2 Intrday Institutional TradingPsychology of Option Trading
Trading is 80% mindset, 20% strategy.
You must learn to:
Accept losses
Avoid revenge trading
Stick to plan
Control emotions
Avoid fear of missing out (FOMO)
Consistent success requires discipline.

XAUUSD trying to fill gapWe are seeing XAUUSD approach a significant area of interest. The zone between $4,930 and $4,946 (highlighted on the chart) is currently acting as a magnet for price.
There is a notable Gap just above this zone that trying to be filled. How the price reacts at the $4,930-$4,946 floor will dictate the trend for the coming days.
Primary Target: $5,070 (on a bounce from gap zone or from decider zone)
Secondary Target: $4,835 (on a breakdown below decider zone)
Use SL small to capture big move with better R:R

Reliance - Multi time frame analysisThe price is trending inside a descending channel in the lower time frame and is now testing the important zone at 1400. As per the daily chart, the price has taken support from 1370. Another support is also there at 1340. If the price does not gain bullish strength, there is a chance to test 1340.
Buy above 1404 with the stop loss of 1392 for the targets 1416, 1428, 1440 and 1454.
Sell below 1380 with the stop loss if 1392 for the targets 1368, 1354, 1340 and 1322.
Always do your analysis before taking any trade.

ADANIENSOL at key decision zone.ADANIENSOL is currently trading at a high-stakes "Make or Break" level on the 15-minute timeframe. After a sharp intraday decline of over 10% today, the price has plummeted directly into a Decisive Historical Zone (₹792 – ₹807).
The stock is under pressure today following reports that the US SEC is seeking to serve summons to group executives regarding a civil securities case.
The company also reported Q3 results yesterday, showing a record EBITDA of ₹2,210 crore (up 21%), though net profit saw a slight decline due to a one-time tax adjustment from the previous year.
Intraday volatility has surged to over 8%, with a massive 21% jump in Open Interest (OI), suggesting aggressive new positions are being built at these levels.
Look for a reversal from this zone. If the price breaks upside with strong volume from 807, the initial target is ₹865.
Safe Entry: For extra confirmation, wait for a sustain above ₹833 to ensure the immediate selling pressure has cooled for target 888
if the stock fails to hold the ₹791 level on a 15-min closing basis, target: ₹762 (next major psychological support).
I am not sebi registered financial advisor.

Part 1 Intrday Institutional Trading Role of Institutions & Smart Money in Options
Institutions dominate the option markets.
They control the market using:
Delta hedging
Gamma scalping
Liquidity creation
Option selling walls
Volume absorption
Understanding their footprints helps predict:
Support zones
Resistance zones
Directional bias
Volatility behavior

PNB right now inside a demand zonePNB is currently sitting at a critical juncture on the 15-minute timeframe. After a sharp correction from the ₹135 levels, the price has landed directly into a Decisive Demand Zone (₹119.50 – ₹120.60). Historically, this zone has acted as a strong "springboard" for the stock, attracting buyers and halting previous declines.
Price is currently testing the lower boundary of this zone. A reversal or a breakdown here will likely dictate the trend for the final week of January.
Bullish Case (Buy): If price sustains above the zone and breaks with a spike in volume, then target: ₹124
Bearish Case (Sell): If price closes decisively below ₹119.30 on the 15-min candle, then target: ₹116
This analysis is for educational purposes only. Please consult your financial advisor before trading.

Part 5 Advance Option Trading How Option Trading Works – Step-by-Step
You choose a strike price based on your directional view.
You decide whether to buy the option or sell it, depending on your risk appetite.
If you expect strong movement, you typically buy.
If you expect sideways movement, you typically sell.
When market moves in your direction, premium increases.
When market moves against you, premium decreases.
Premium also falls automatically due to theta decay, especially near expiry.
Option chain helps identify support and resistance based on OI built-up.
Volume profile shows where big institutions executed trades.
Market structure tells you whether to buy CE, PE, or sell options.

Bitcoin Bybit chart analysis JENUARY 26
Hello
It's a Bitcoin Guide.
If you "follow"
You can receive real-time movement paths and comment notifications on major sections.
If my analysis was helpful,
Please click the booster button at the bottom.
This is a Bitcoin 30-minute chart.
There are no Nasdaq indicators released.
*If the red finger moves,
this is a long position strategy.
1. Confirm the first touch of the purple finger at the top
-> Red finger: $87,538.8, long position entry point
/ Stop-loss price if the green support line is broken
2. $89,210.1, long position first target -> Top: second target
If the strategy is successful, 88.6K is the long position re-entry point.
If the top falls immediately without touching the first point,
Long hold at the second point / Stop-loss price if the green support line is broken
From the green support line breakout, the bottom point / sideways market. Below that, the most important support line remains at $85,238.3.
Please note that if this point is broken, a prolonged correction is possible.
Up to this point, I ask that you use my analysis for reference only.
I hope you operate safely, with a focus on principled trading and stop-loss orders.
Thank you.

Gold 5200/1h ChartGold moving in channel from last 10 days. I believe breaking the 5110 level will put gold to new high of 5200. Although I don't see this happing today. Failing to do so might trigger a profit booking as it has already moved 15% from previous high (+last 7 days green candle closing).
Be vigilant with SL, and don't go all in.

$RIVER Turned $1K Into $52K In 41 Days But Here’s Why I’m Not BuCRYPTOCAP:RIVER Turned $1K Into $52K In 41 Days But Here’s Why I’m Not Buying
CRYPTOCAP:RIVER Pumped 5,221% In 41 Days. From $1.616 (Dec 17) → $86 (Yesterday)
What Caused This Pump?
🔹 Arthur Hayes + Justin Sun ($8M) Backed It
🔹 $12M Funding Round With Big Investors
🔹 Sui Network Partnership
🔹 Listed On Binance, OKX, Bybit, Coinone
🔹 Only 20% Tokens In Circulation
🔹 One Whale Bought 50% Supply At $4
⚠️ My Warning:
👉 Don’t Try To Catch This Knife Now
👉 Strong Support Is At $8–$12 - High Chance Price Revisits $10–$15
👉 Fresh Longs At ATH = Very Risky
Key Risks:
🔴 Whale Controls 50% Supply: Dump Risk Anytime
🔴 Pump Driven By Leverage, Not Organic Demand
🔴 80% Tokens Still Locked
Conclusion:
Wait For A Proper Pullback
Don’t Become Exit Liquidity
DYOR
My Take:
Good Project, Very Risky Price Right Now
Wait For Cooldown Or Proper Structure
FOMO Is Not A Strategy

Hindustan Unilever Ltd – Descending Trendline Breakout SetupHUL has been trading under a clear descending trendline since the recent swing high near 2,700. Price structure showed lower highs and lower lows, confirming short-term bearish control.
Recently, price has broken above the descending trendline and is attempting to sustain above it, suggesting a potential shift in short-term momentum.
Key Observations:
• Clean descending trendline from swing high
• Strong base formation around 2,250–2,300 support zone
• Breakout above trendline with improving structure
• Price attempting to hold above 2,380–2,400 region
Trade Plan (Swing Perspective):
Entry Zone: 2,380–2,420
Stop Loss: Below 2,300 (recent higher low zone)
Target 1: 2,585 (previous horizontal resistance)
Target 2: 2,650–2,700 (prior supply zone)
Risk–Reward remains favorable if price sustains above the breakout level and volume supports continuation.
Invalidation: A daily close back below 2,300 would weaken the bullish structure and indicate potential false breakout.
This setup is based purely on trendline breakout and price structure. Confirmation through sustained closes is preferred before aggressive positioning.

PC Jeweller Ltd – Potential Trend Reversal SetupPrice has been trading inside a well-defined descending channel for several months, respecting both upper and lower trendline boundaries. Recently, price bounced strongly from the lower channel support and is now attempting to reclaim short-term structure.
Key Observations:
• Sustained downtrend within a falling channel
• Strong reaction from lower trendline support zone (~9.00–9.50)
• Early signs of higher lows forming on daily timeframe
• Price currently testing minor resistance near 10.80–11.00
Trade Plan (Positional / Swing):
Entry Zone: 10.70–10.90
Stop Loss: Below 9.90 (recent swing low)
Target 1: 13.00 (mid-channel resistance)
Target 2: 14.30–14.50 (upper channel resistance)
Risk–Reward looks favorable if price sustains above 10.50 with volume confirmation.
Invalidation: A decisive daily close below 9.90 would negate bullish bias and suggest continuation of the broader downtrend.
This setup is based purely on price action and channel structure. Waiting for confirmation before aggressive positioning is prudent.

MAJOR INDEX OUTLOOK | NASDAQ (US100) Market Structure Update Global indices are currently approaching critical decision zones, and NASDAQ (US100) is showing a
notable shift in short-term market sentiment.
After a prolonged corrective phase, the H1 time frame now confirms a bullish structural transition —
price is forming Higher Highs and Higher Lows, indicating that buyers are gaining short-term control.
However, the index is now testing a major resistance zone near 26,000 — a psychological level combined
with historical supply pressure.
This is a decisive area.
Key Technical Levels
🔺 Major Resistance:
26,000 (Psychological Level)
26,150 (Recent Swing High)
🔻 Immediate Support:
25,750
🔻 Structural Support:
25,600
Scenario 1: Bullish Breakout Continuation
A strong H1 candle close above 26,050 could trigger continuation momentum.
Upside Targets:
➡️ 26,200
➡️ 26,350
A breakout followed by a clean retest of 26,000 as support would offer higher-probability confirmation.
Scenario 2: Bearish Rejection
If price fails to sustain above 26,000–26,050 and prints rejection wicks or bearish confirmation,
a corrective pullback may follow.
Downside Targets:
➡️ 25,750
➡️ 25,600
Lower-high confirmation on M15 would strengthen the rejection case.
Market Note
NASDAQ is highly volatile during impulsive phases. Entering directly into resistance without
confirmation increases risk exposure significantly.
Disciplined execution and controlled position sizing remain essential.
Current Bias: Short-Term Bullish (Caution at 26,000 Resistance)
The reaction around 26,000 will likely determine the next 150–300 point directional move.
#NASDAQ #US100 #IndexTrading #MarketStructure #ForexAnalysis #TechnicalAnalysis #MustProfitFX
Disclaimer: This content is for educational purposes only. Trading involves significant risk.

JINDAL SAW LTD (JINDALSAW): Recovery Play or Value Trap?Market Insights by Ayushi Shrivastava | NISM-Certified Research Analyst
View: Bullish Recovery (Short to Medium Term)
Jindal SAW is showing early signs of a structured recovery, both on charts and in fundamentals.
The stock appears to be transitioning from a prolonged downtrend into a base-building + accumulation phase.
The key question now:
👉 Is this a genuine recovery… or just another dead-cat bounce?
📊 Technical Analysis — The Chart Story
The chart is starting to send some encouraging signals:
• Support & Accumulation Zone
The stock has formed a stable base at lower levels.
Rising yellow trendlines suggest a gradual shift toward an upward trajectory.
• Volume Expansion = Smart Participation
Recent high-volume spikes indicate accumulation at the bottom,
often seen when institutional interest begins to build.
• Breakout Structure
If price continues to respect the rising trendline and holds above recent higher lows,
the recovery structure remains technically valid.
🏗️ Fundamental Highlights — The Backstory
It’s not just the chart — the business numbers are also turning supportive:
• Strong Order Book Visibility
The company has a robust order book of 19.64 lakh metric tons,
providing solid revenue visibility for the coming quarters.
• Debt Reduction = Balance Sheet Healing
Standalone net debt has reduced to ₹3,154 Cr,
with a much healthier Debt-to-Equity ratio of 0.41.
• Global Expansion Tailwinds
– 6.22 lakh MT HSAW pipes contract in Saudi Arabia
– New Seamless Pipe Plant in Abu Dhabi
These projects act as medium-term growth drivers.
⚠️ Key Triggers & Risks to Track
• Jal Jeevan Mission (JJM) Receivables
Around ₹350 Cr is still pending due to payment delays,
which may impact short-term cash flows.
• Union Budget — Feb 1st
Market will closely watch JJM allocation and fund flow clarity.
• Margin Sensitivity
Although Q3 showed improvement,
margins are still below last year’s levels.
🎯 Conclusion — The Investment Thesis
Jindal SAW currently looks like a “Value Recovery” candidate.
Management has indicated that Q2 FY26 marked the cycle bottom,
and early momentum is now returning.
With:
✔ Low debt
✔ High order book visibility
✔ Improving structure
✔ Global expansion triggers
…the stock offers a favorable risk–reward setup,
provided domestic receivable issues ease out.
📌 Final Verdict
👉 Strategy: Buy on Dips
👉 Focus: Structure + Budget outcome + JJM fund flow
— Ayushi Shrivastava
NISM-Certified Research Analyst
⚠️ Disclaimer:
This analysis is based on publicly available data and technical charts and is for educational and informational purposes only.
It does not constitute financial, investment, or trading advice.
Stock market investments are subject to market risks.
Please consult your financial advisor before making any investment or trading decisions.

Part 4 Technical Analysis VS. Institutional Option TradingOption Trading in Trending vs. Range-Bound Markets
1. Trending Market
Buyers → High reward
Sellers → Increased risk
Look for:
Market structure break
Volume surge
Imbalance zones
Clearing of option OI levels
2. Range-Bound Market
Sellers → Consistent profits
Buyers → Theta decay damage
Indicators:
High HVN
OI build-up on both sides
Low IV environment

NAUKRI - Shorting opportunity?!!!Naukri - Info edge is consistently making highs and lower highs and lows and lower lows
Its been forming a channel pattern...which is perfectly visible...
Targets and sl levels as mentioned @ chart!!!
This bearish view goes nullified on making the higher high(sl level)
Let's wait and watch!!!
Just my view...not a tip nor advice!!!!
Thank you!!!

Part 3 Technical Analysis VS. Institutional Option TradingHow Option Pricing Works
Option pricing is influenced by market structure, volatility, liquidity, and hedging flows.
Three components determine premium:
Intrinsic Value
For Call Option:
Max(Spot price – Strike price, 0)
For Put Option:
Max(Strike price – Spot price, 0)
Time Value
Extra value based on:
Time left to expiry
Volatility
Market expectations
Demand & supply
As expiry approaches:
Time value decays → Premium decreases
This is called theta decay.
Implied Volatility (IV)
IV measures the market’s expectation of future movement.
High IV → High premiums
Low IV → Low premiums
Events that cause IV spikes:
Budget announcements
RBI policy decisions
Elections
Global news
Understanding IV is essential for timing entry, especially for option sellers.

Hindalco Industries Ltd Stock price will hit 1020-1035Hindalco Industries Ltd is well-positioned for a short-term long trade at ₹962, supported by favorable price and volume action. The setup indicates upside potential toward the ₹1,020–1,035 zone in the near term, making current levels an attractive entry for short-term traders.

HMVL 1 Month Time Frame 📊 Current Price Snapshot (Latest Close)
- Approximate latest price: ₹70.9 – ₹72.2 per share (data from multiple live sources on 23 Jan 2026) showing HMVL trading around ~₹71–₹72 levels.
- Intraday range: ₹69.00 – ₹72.00 recently observed.
- 52‑week range: ₹61.76 (low) to ₹103.40 (high).
📈 1‑Month Performance
- Over the past 1 month, the stock’s performance shows a slight decline or mild sideways move: approx −1 % to −3 % change depending on the exact start/end dates used (TradingView indicated ~‑2.75 % monthly fall).
- Other data suggests very modest monthly change (slight positive/negative depending on source).
📅 Recent Daily Price Levels (Indicative)
From historical price data for the first half of January 2026:
01 Jan 2026: ~₹68.5
06 Jan 2026: ~₹70.4
09–12 Jan 2026: ~₹66‑₹69
16–23 Jan 2026: ~₹69‑₹72
→ This shows a 1‑month trading range roughly between ~₹65 and ~₹72.
📍 1‑Month Key Levels to Watch
Support zone: ~₹65 – ₹67 (recent lows).
Near‑term resistance: ~₹72 – ₹74 (recent highs).
Mid‑range pivot: ~₹69 – ₹71 — recent close vicinity area.

CONCOR 1 Day Time Frame 📊 CONCOR — 1‑Day Time Frame Key Levels (Indicative)
Current Price (recent session)
• ~₹478–₹480 (down intraday) — trading near session lows.
🔁 Pivot & Classic Levels (from standard technical calculation)
These are typical pivot/SR levels used by traders for one‑day setups:
Pivot Point: ~₹520
➡️ The central reference level where bias may shift.
If price trades above this level intraday → bullish bias; below → bearish bias.
Resistance Levels:
• R1: ~₹524
• R2: ~₹527
• R3: ~₹531
➡️ Levels where selling pressure may emerge if price rallies.
Support Levels:
• S1: ~₹516
• S2: ~₹513
• S3: ~₹509
➡️ Key intraday levels where buyers may step in on pullbacks.
📉 Today’s Range & Observations
Day’s High: ~₹497–₹498
Day’s Low: ~₹477–₹478
➡️ CONCOR is trading nearer its session low, showing short‑term selling pressure.
52‑Week Context:
• 52‑week low ~₹472–₹478
• 52‑week high ~₹652 (prior broader trend)
📌 How Traders Use These Levels (1 Day Time Frame)
Bullish Scenarios (intraday):
✔ If price breaks above Pivot (~₹520) with volume → potential move toward R1 ~₹524 and beyond.
✔ Strength above R1/R2 indicates buyers stepping in.
Bearish Scenarios (intraday):
✔ Price staying below pivot and failing at R1/R2 → continuation lower.
✔ Breakdown below S1 (~₹516) and S2/S3 amplifies downside pressure.

CIPLA 1 Day Time Frame 📌 Live Price Snapshot (Intraday)
📍 Cipla Share Price (NSE): ~₹1,305 (mid‑session)
• Today’s range so far: High ~₹1,308.80 — Low ~₹1,281.70.
• This is near its 52‑week low (~₹1,281.70) after recent downward pressure on the stock.
⚠️ Immediate Intraday Levels to Watch
📈 Upside Resistance
• ₹1,334–₹1,366 — key near‑term resistance cluster above current price.
• Break above ₹1,366 with volume may challenge ₹1,417+ zone.
📉 Downside Support
• ₹1,283 — first major support (already tested).
• Below that ₹1,250–₹1,200 are lower supports from daily pivots.
📍 How Traders Use These Levels Today
Bullish scenario (intraday):
If price sustains above ₹1,334 pivot → watch for rebounds toward ₹1,366 → ₹1,417 → ₹1,449.
Bearish scenario (intraday):
If price breaks and closes below ₹1,283 → likely continuation toward ₹1,250 / ₹1,200.
Neutral/range action:
Between ₹1,283–₹1,334 — range trading expected with tight stops.

zinc mcx breakout update will go 340--373++++??zinc trade in near previous high 319 last was 325@ if mkt sustain abv 325 or close abv than looks 340--373++++ where support 310--305@ only blow some down correction expect till 300-295@ yes buy on dips good way with support sl use .
